rightsretained
123-4567-24-567/08/06
$15.00
Will Sanders Supporters Jump Ship for Trump? Fine-grained Analysis of Twitter Followers
Abstract
In this paper, we study the likelihood of Bernie Sanders supporters voting for Donald Trump instead of Hillary Clinton. Building from a unique time-series dataset of the three candidates’ Twitter followers, which we make public here, we first study the proportion of Sanders followers who simultaneously follow Trump (but not Clinton) and how this evolves over time. Then we train a convolutional neural network to classify the gender of Sanders followers, and study whether men are more likely to jump ship for Trump than women. Our study shows that between March and May an increasing proportion of Sanders followers are following Trump (but not Clinton). The proportion of Sanders followers who follow Clinton but not Trump has actually decreased. Equally important, our study suggests that the jumping ship behavior will be affected by gender and that men are more likely to switch to Trump than women.
keywords:
Presidential Election; Bernie Sanders; Donald Trump; Hillary Clinton; Gender;<ccs2012> <concept> <concept_id>10003120.10003130.10003131.10003579</concept_id> <concept_desc>Human-centered computing Social engineering (social sciences)</concept_desc> <concept_significance>500</concept_significance> </concept> </concept> </ccs2012>
[500]Human-centered computing Social engineering (social sciences) \ccsdesc[500]Human-centered computing Social media \printccsdesc
1 Introduction
Even as Hillary Clinton moves closer and closer to clinch the Democratic nomination, some Sanders supporters insist that they will not vote for her in the general election. This leaves a golden opportunity to Donald Trump, the presumptive Republican nominee who has been sharing similar campaign messages with Sanders on trade and campaign finance. Trump, on the other hand, also makes it clear that he will target Sanders supporters.111Newsweek, http://www.newsweek.com/can-trump-win-over-bernie-sanders-supporters-459218.
This new dynamic quickly became hotly debated and the looming question is “Can Trump win over Sanders supporters?”222New York Times, http://www.nytimes.com/2016/04/29/ us/politics/hillary-clinton-donald-trump-women.html. A number of recent polls, including ABC/Washington Post, CBS/NYT and YouGov, do suggest that some Sanders supporters could end up voting for Trump and that this is particularly so for his male supporters.333New York Times, http://www.nytimes.com/2016/05/25/ upshot/explaining-hillary-clintons-lost-ground-in-the-polls. html. In this paper, we investigate this dynamic in Twitter.
Building from a unique dataset of the three candidates’ Twitter followers (Figure 1), we first examine the proportion of Sanders followers who simultaneously follow Trump or Clinton. Then we train a convolutional neural network to classify the followers’ gender and study how men in particular are responding to Trump’s overture. Our study suggests that in Twitter there also exists a shift towards Trump among Sanders followers, and that male Sanders followers are responding more positively to Trump than females.
2 Related Literature
Our work builds on previous literature in electoral studies, data mining, and computer vision.
In eletoral studies, researchers have argued that gender constitutes an important factor in voting behavior. One common observation is that women tend to vote for women, which is usually referred to as gender affinity effect [4, 1]. In the 2016 presidential election, Hillary Clinton also portrays herself as a champion “fighting for women’s healthcare and paid family leave and equal pay.” Our work will test the strength of this gender affinity effect when Sanders supporters decide whether to jump ship for Trump or not.
In data mining, there is a burgeoning literature on using social media data to analyze and predict elections. In particular, several studies have explored ways to infer users’ preferences. According to [7], tweets with sentiment can potentially serve as votes and substitute traditional polling. [12] exploits the variations in the number of ‘likes’ of the tweets to infer Trump followers’ topic preferences. [6] uses candidates’ ‘likes’ in Facebook to quantify a campaign’s success in engaging the public. [11] uses follower growth on public debate dates to measure candidates’ debate performance. Our work also pays close attention to the number of followers, but we go further by investigating the composition of these followers.
Our work also ties in with current computer vision research. In this dimension, our work is related to gender classification using facial features. [5] uses a five-layer network to classify both age and gender. [3] introduces a dataset of frontal-facing American high school yearbook photos and uses the extracted facial features to study historical trends in the U.S. [2] provides a comprehensive survey of race classification based on facial features. [9] uses user profile images to study and compare the social demographics of Trump followers and Clinton followers. [10] focuses specifically on the unfollowers of Donald Trump and Hillary Clinton and reports that women are more likely to unfollow both candidates. [8] studies the ‘woman card’ exchange between Trump and Clinton, and finds that the ‘woman card’ exchange has made women more likely to follow Clinton and less likely to unfollow her.
3 Data and Methodology
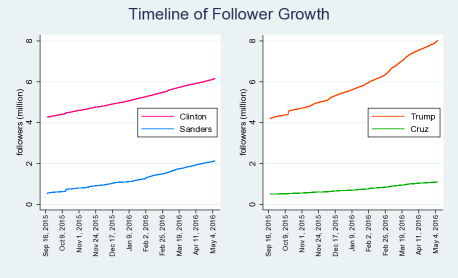
In this section, we describe our dataset US2016, the pre-processing procedures and our CNN model. One key variable is number of followers. This variable is available for all three candidates and covers the entire period from Sept. 18, 2015 to May 7, 2016. Compared with the candidates who have dropped out of the race, the three remaining presidential candidates also have the most Twitter followers (Figure 1). This variable is updated every 10 minutes.
Besides the number of followers, our dataset US2016 also contains the detailed follower IDs for Trump, Clinton and Sanders on specific dates, including March 24th, April 17th and May 10th. This information enables us to track the evolution of the election dynamics. We report the summary statistics in Table 1.
| March 24 | April 17 | May 10 | |
|---|---|---|---|
| Bernie Sanders | 1,777,861 | 1,977,982 | 2,134,917 |
| Hillary Clinton | 5,755,618 | 5,905,124 | 6,176,731 |
| Donald Trump | 7,075,507 | 7,604,915 | 8,020,568 |
Using follower information, we first study among Sanders followers who are following Trump but not Clinton and who are following Clinton but not Trump. We think it is reasonable to assume that if Sanders drops out of the race, Sanders followers who are following Trump but not Clinton will support Trump, and that those who are following Clinton but not Trump will support Clinton. To match the candidates’ millions of followers, we first sort their IDs and then use binary search. The entire matching process can be done within a few minutes.444Codes and data used in this paper are available on the first author’s website.
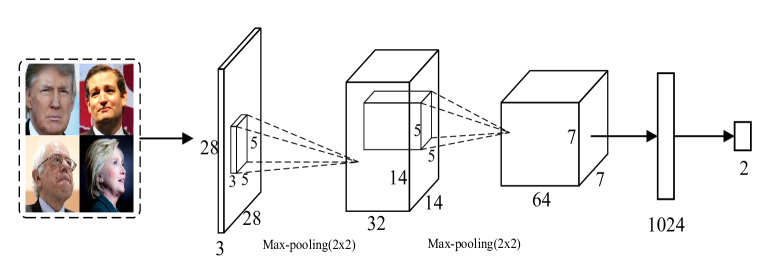
Furthermore, we collect the profile images based on follower IDs. Our goal is to infer an individual’s gender based on the profile image and to test the hypothesis that individuals who follow both Sanders and Trump are more likely to be male than an average Sanders follower.
To process the profile images, we first use OpenCV to identify faces, as the majority of profile images only contain a face.555http://opencv.org/. We discard images that do not contain a face and the ones in which OpenCV is not able to detect a face. When multiple faces are available, we choose the largest one. Out of all facial images thus obtained, we select only the large ones. Here we set the threshold to 18kb. This ensures high image quality and also helps remove empty faces. Lastly we resize those images to (28, 28, 3). Eventually, we get 40,088 images sampled from all Sanders followers and 34,921 images from Sanders followers who also follow Trump (Table 2).
| All Sanders | Sanders & Trump | |
| Number of Images | 40,088 | 34,921 |
To classify profile images, we train a convolutional neural network using 42,554 weakly labeled images, with a gender ratio of 1:1. These images come from Trump’s and Clinton’s current followers. And we infer their labels using the followers’ names. For example, David, John, Luke and Michael are male names, and Caroline, Elizabeth, Emily, Isabella and Maria are female names.666The full list of label names together with the validation data set and the trained model, is available at the first author’s website. For validation, we use a manually labeled data set of 1,965 profile images for gender classification. The validation images come from Twitter as well so that we can avoid the cross-domain problem. Moreover, they do not intersect with the training samples as they come exclusively from individuals who unfollowed Hillary Clinton before March 2016.
| Architecture | Precision | Recall | F1 | Accuracy |
| 2CONV-1FC | 91.36 | 90.05 | 90.70 | 90.18 |
4 Main Results
In this section, we answer the question of whether Sanders followers are jumping ship for Trump. Specifically, we examine whether an increasing proportion of Sanders followers are now following Trump and, if so, whether this phenomenon is particularly significant for men.
4.1
In this subsection, we analyze the composition of Sanders followers between March and May. We divide Sanders followers into four groups: (1) only follow Trump and Sanders, (2) only follow Clinton and Sanders, (3) follow Trump, Clinton and Sanders, (4) only follow Sanders. We assume that followers in Group 1 are the most likely to switch to Trump and followers in Group 2 are the least likely. We report our results in Figures 3, 4, 5.
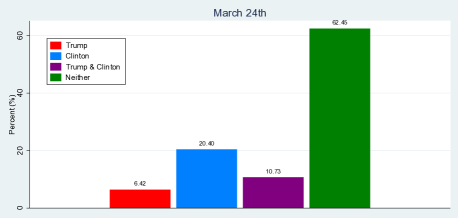
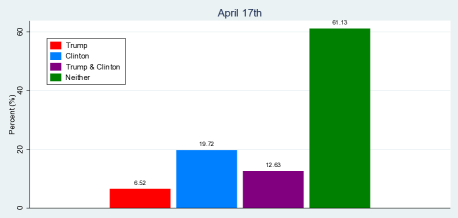
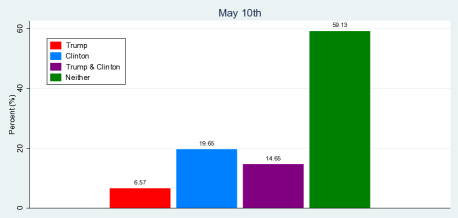
The results indicate a decrease of Clinton followers and an increase of Trump followers among Sanders followers between March and May. In Table 5, we use score test to show that the increase of Trump’s presence and the drop of Clinton’s presence are statistically significant.777The formula for the score test statistic is: , where With large and , z is approximately standard normal.
Meanwhile, we also observe that individuals who follow only Sanders, marked by green, make up a smaller share in May than in March and that the share of individuals who follow all the three candidates has increased. Using score test, we are also able to show that these changes are statistically significant.
| Null Hypothesis | Clinton & Sanders | Trump & Sanders | ||
|---|---|---|---|---|
| z statistic | p value | z statistic | p value | |
| PrMarch=PrMay | -18.47 | 0.00 | 5.99 | 0.00 |
4.2
In this subsection, we study whether men are more likely to jump ship for Trump than women. Our investigation is motivated by poll findings that show white male supporters of Bernie Sanders are the most likely to switch to Trump.888Washington Post, https://www.washingtonpost.com/news/ the-fix/wp/2016/05/24/how-likely-are-bernie-sanders-supporters-to-actually-vote-for-donald-trump-here-are-some-clues.
We use data collected on May 10th, when Sanders has 2,134,917 followers, of which 140,185 simultaneously follow Trump but not Clinton. Using the neural network reported in Section 3, we classify the gender of these followers. We report the results in Figure 6.
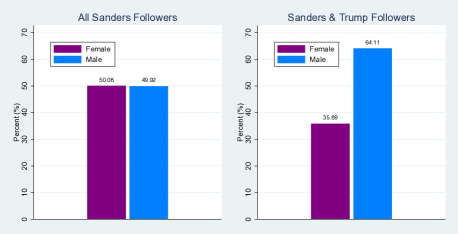
We find that of all Sanders followers 49.92% are male, but for those who follow both Sanders and Trump (and not Clinton) the percentage is as high as 64.11%. Using score test (Table 5), we show that among the Sanders followers, those who simultaneously follow Trump but not Clinton are more likely to be male than an average Sanders follower. Our results are consistent with the poll results and lend further support to previous studies that demonstrate the gender effect.
| Null Hopythesis | Men | |
|---|---|---|
| z statistic | p value | |
| PrSanders=Pr | 39.10 | 0.00 |
5 Conclusions
As Hillary Clinton moves closer and closer to clinch the Democratic nomination, the question of whether Sanders supporters would jump ship for Trump becomes decisive. A number of polls suggest that Sanders supporters could end up voting for Trump and that this is particularly so for his male supporters. In this paper, we explored this new dynamic in social media. Building from a unique dataset of the three candidates’ Twitter followers, we first analyzed the evolution in the composition of Sanders followers and then using neural network we studied whether there is a gender effect when Sanders supporters consider jumping ship for Trump.
Our study shows that between March and May an increasing proportion of Sanders followers are following Trump (but not Clinton). The proportion of Sanders followers who follow Clinton but not Trump has actually decreased. Equally important, our study suggests that the jumping ship behavior will be affected by the gender effect and that men are more likely to switch to Trump than women.
6 Acknowledgment
We gratefully acknowledge support from the University and from our corporate sponsors Xerox and Yahoo.
References
- [1] Dolan, K. Is There a “Gender Affinity Effect" in American Politics? Information, Affect, and Candidate Sex in U.S. House Elections. Political Research Quarterly (2008).
- [2] Fu, S., He, H., and Hou, Z.-G. Learning Race from Face: A Survey. In Pattern Analysis and Machine Intelligence, IEEE Transactions on (2014), vol. 36.
- [3] Ginosar, S., Rakelly, K., Sachs, S., Yin, B., and Efros, A. A. A Century of Portraits: A Visual Historical Record of American High School Yearbooks. In ICCV 2015 Extreme Imaging Workshop Proceedings (2015).
- [4] King, D. C., and Matland, R. E. Sex and the Grand Old Party: An Experimental Investigation of the Effect of Candidate Sex on Support for a Republican Candidate. American Politics Research (2003).
- [5] Levi, G., and Hassner, T. Age and Gender Classification using Deep Convolutional Neural Networks. In Proceedings of the IEEE Conference on Computer Vision and Pattern Recognition (2015), pp. 34–42.
- [6] MacWilliams, M. C. Forecasting Congressional Elections Using Facebook Data. PS: Political Science & Politics 48, 04 (October 2015).
- [7] O’Connor, B., Balasubramanyan, R., Routledge, B. R., and Smith, N. A. From Tweets to Polls: Linking Text Sentiment to Public Opinion Time Series. In Proceedings of the Fourth International AAAI Conference on Weblogs and Social Media (2010).
- [8] Wang, Y., Feng, Y., Li, Y., Zhang, X., Niemi, R., and Luo, J. Pricing the Woman Card: Gender Politics between Hillary Clinton and Donald Trump. In In arXiv preprint:1605.05401 (2016). In arXiv prepring:1605.05401 (2016).
- [9] Wang, Y., Li, Y., and Luo, J. Deciphering the 2016 U.S. Presidential Campaign in the Twitter Sphere: A Comparison of the Trumpists and Clintonists. In Tenth International AAAI Conference on Web and Social Media (2016).
- [10] Wang, Y., Li, Y., You, Q., Zhang, X., Niemi, R., and Luo, J. Voting with Feet: Who are Leaving Hillary Clinton and Donald Trump? In arXiv preprint :1604.07103 (2016).
- [11] Wang, Y., Luo, J., Niemi, R., and Li, Y. To Follow or Not to Follow: Analyzing the Growth Patterns of the Trumpists on Twitter. In Workshop Proceedings of the 10th International AAAI Conference on Web and Social Media (2016).
- [12] Wang, Y., Luo, J., Niemi, R., Li, Y., and Hu, T. Catching Fire via ‘Likes’: Inferring Topic Preferences of Trump Followers on Twitter. In Tenth International AAAI Conference on Web and Social Media (2016).