Competing effects of Mn and Y doping on the low-energy excitations and phase diagram of La1-yYyFe1-xMnxAsO0.89F0.11 iron-based superconductors
Abstract
Muon Spin Rotation (SR ) and 19F Nuclear Magnetic Resonance (NMR) measurements were performed to investigate the effect of Mn for Fe substitutions in La1-yYyFe1-xMnxAsO0.89F0.11 superconductors. While for a very low critical concentration of Mn (%) is needed to quench superconductivity, as increases the negative chemical pressure introduced by Y for La substitution stabilizes superconductivity and for % it is suppressed at Mn contents an order of magnitude larger. A magnetic phase arises once superconductivity is suppressed both for =0 and for %. Low-energy spin fluctuations give rise to a peak in 19F NMR with an onset well above the superconducting transition temperature and whose magnitude increases with . Also the static magnetic correlations probed by 19F NMR linewidth measurements show a marked increase with Mn content. The disruption of superconductivity and the onset of the magnetic ground-state are discussed in the light of the proximity of LaFeAsO0.89F0.11 to a quantum critical point.
pacs:
74.70.Xa, 76.60.-k, 76.75.+i, 74.40.Kb, 74.25.DwI Introduction
The introduction of impurities in superconductors is a well known approach to probe the local response function and to unravel their intrinsic microscopic properties.Alloul Both spinless and paramagnetic impurities perturb the local electronic environment and cause a significant change in the spin polarization around them. When the spin correlations are particularly enhanced, as it is the case in the proximity of a quantum critical point (QCP),QCP ; Sachdev or when the amount of impurities starts to be significant, cooperative effects become relevant and marked changes in the superconducting transition temperature are observed, eventually leading to the appearance of a magnetic order.Alloul1
In the pnictides extensive studies on the effect of impurities on the superconducting ground-state have been reported Sato1 ; Lee ; Sato1B ; SannaPRL ; Sanna1su4 ; Bobroff and the most dramatic and yet not fully understood effect is induced by Mn for Fe substitution in the optimally electron-doped LaFeAsO0.89F0.11.Hammerath2014 In this material it is sufficient to introduce a tiny amount of Mn, as low as 0.2%, to fully quench superconductivity. It has been shown that at this doping level there is a divergence of the in-plane correlation length, characteristic of a two-dimensional (2D) antiferromagnetically correlated metal approaching a quantum critical point.Hammerath2014 This QCP separates the superconducting phase from a magnetic ground-state developing at Mn contents above 0.2%. Originally it was suggested that Mn impurities could lead to a shift in the spectral weight of the fluctuations from (stripe wave-vector) to (Néel wave-vector) Tucker and accordingly to a suppression of interband pairing processes.Millis However, no evidence of a Néel phase in Mn-doped LaFeAsO0.89F0.11 has been ever reported and recent experiments seem rather to suggest that the magnetic order is still characterized by a stripe collinear arrangement.Moroni2016 It is interesting to notice that such a marked effect is observed for LaFeAsO0.89F0.11 only, whereas LnFeAsO0.89F0.11 with smaller lanthanide ions (e.g. for Ln=Sm) shows a much less dramatic effect and much larger amounts of Mn are needed to suppress superconductivity. sato2010 ; singh2013
In this paper we present a study of the effect of Mn doping in LaFeAsO0.89F0.11 where La is partially substituted by Y, for doping levels up to 20 %. By combining muon spin rotation SR with superconducting quantum interference device (SQUID) magnetometry we were able to draw the phase diagram of La1-yYyFe1-xMnxAsO0.89F0.11, at fixed Y content as a function of the Mn doping level and at fixed Mn doping as a function of the Y doping level. It is shown that Y doping causes a significant shift of the QCP observed in the system and that magnetism arises only for %, for %. 19F nuclear spin-lattice relaxation measurements evidence the enhancement of low-frequency dynamics already present in the normal phase of the samples without Mn. The mechanism giving rise to the onset of the magnetic phase and the suppression of superconductivity are discussed in the light of recent theoretical models.
II Experimental methods and results
Two series of polycrystalline La1-yYyFe1-xMnxAsO0.89F0.11 samples have been studied: the first one with fixed % yttrium content (LaY20 hereafter) and nominal Mn contents ranging from % to %, while the second one was prepared with fixed % Mn content and %, %, %, %, %, % yttrium contents (LaYMn05 hereafter). The samples were synthesized using a two-step solid-state reaction Alfonsov2011 . Details on sample preparation and characterization by means of powder x-ray diffraction, electron microscopy (SEM) and SQUID magnetometry, used to determine , have been already partially reported in Refs. SupMoroni2015, ; Sabine2016, . Electron microscopy WDX revealed that Y and Mn contents are quite close to the nominal ones. All the samples are optimally electron doped with a nominal fluorine content of 11%. The results obtained in the LaY20 series will be compared to those already derived for LaFe1-xMnxAsO0.89F0.11 (LaY0 hereafter).Hammerath2014 It is pointed out that the LaY0 series Sato1 was not grown with exactly the same procedure as the LaY20 series. Although this may lead to slight changes in the phase diagram this will not affect the analysis and the conclusions presented in this work.
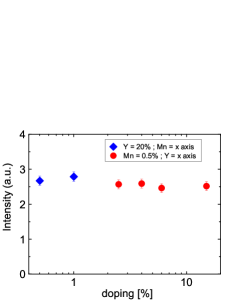
The intensity of the 19F NMR signal was measured at room temperature in order to check the effective fluorine content both for the LaY20 and for the LaYMn05 series. The results, reported in Fig. 1 show that the absolute fluorine stoichiometry is constant in each sample series within .
II.1 Muon spin relaxation results
In a muon spin relaxation (SR) experiment 100% spin-polarized positive muons () are implanted uniformly into the sample. The muon spin acts as a magnetic probe, precessing around the local magnetic field at a frequency , where MHz/T is the muon gyromagnetic ratio. When the muons decay they emit a positron preferentially along the direction of their spins. Hence, by counting the positrons emitted along a given direction one can reconstruct the time dependence of the muon decay asymmetry , proportional to the time evolution of the muon spin polarization.DrewBlundell2008 ; YaouancBook
In order to probe the local magnetic properties of La1-yYyFe1-xMnxAsO0.89F0.11, zero field (ZF) and longitudinal field (LF) measurements were carried out at the Paul Sherrer Institut (PSI) with the Dolly instrument of SS facility. ZF measurements are extremely sensitive to spontaneous magnetism since in this configuration the local field at the muon site originates from the internal magnetic order only. On the other hand, LF measurements represent a useful tool to study the spin dynamics and can conveniently be used to distinguish between static and dynamic magnetism DrewBlundell2008 ; YaouancBook .
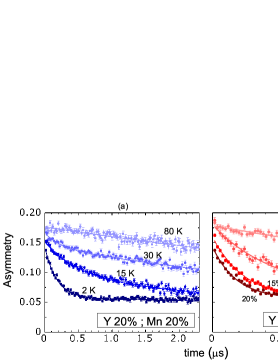
Figure 2 shows the typical time dependence of the ZF SR asymmetry at different temperatures for the samples that display a magnetic order below . The time evolution of the muon asymmetry could be fit with the following standard function:
| (1) |
where is the initial SR asymmetry, while and are the longitudinal () and transverse () fractions of the asymmetry, respectively. The function determines the time dependence of the transverse component, whereas the longitudinal one decays exponentially with a decay rate .
At high temperature ( 30 K) the samples of the LaY20 and LaYMn05 series are in the paramagnetic regime and the muon asymmetry can be fit by setting =0, with decay rates s-1. Upon decreasing the temperature a fast decaying component emerges in the LaY20 samples with %, evidencing the presence of overdamped oscillations in the muon asymmetry. A similar behavior is observed for samples close to the magnetic superconducting boundary carretta2013 ; prando2013 and reflects the presence of a significant distribution of local magnetic fields, typically observed when a short range AF magnetic order develops.carretta2013 The size of the internal fields is of the order of the field distribution , which can be roughly estimated as . The values of obtained from the fit of the data with Eq. 1, of the order of 10 mT, are shown in Fig 3(a). The static character of the magnetism developing at has been confirmed by LF SR experiment which have shown that a field of about 100 mT is enough to completely recover the initial muon asymmetry at 2 K. At variance, all LaY20 samples with % and all the samples of the LYaMn05 series do not display a spontaneous magnetic order down to 2 K.
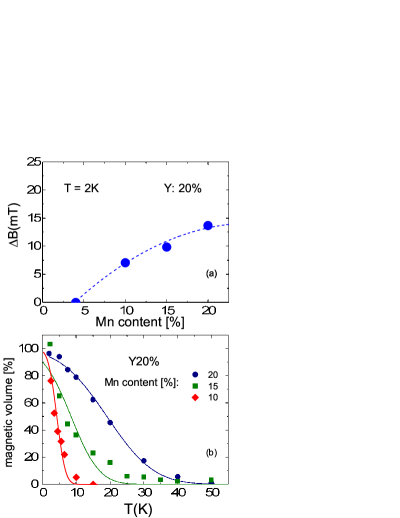
The sample magnetic volume fraction , namely the fraction of the sample volume where the muons sense the magnetic order, can be derived from . From simple geometric arguments DrewBlundell2008 ; YaouancBook it can be shown that in a polycrystalline sample with 100% magnetic volume fraction and that in general one can write . The temperature dependence of (Fig. 3b) shows that the full magnetic volume condition is reached only at low temperatures for all the magnetically ordered samples (LaY20 with ). The magnetic ordering temperature can be estimated by fitting to the error function
| (2) |
which assumes the presence of a Gaussian distribution of local transition temperatures centered around the average value . The results are reported in the phase diagram in Fig. 7.
II.2 Nuclear magnetic resonance results
19F NMR experiments were performed on LaY20 samples in order to complete the study reported in Ref Moroni2015, . The Y for La substitution results in a system with higher chemical pressure with respect to La1111 (La3+ and Y3+ ionic radii are 103 pm and 90 pm, respectively), without introducing paramagnetic lanthanide ions, such as Sm3+, which would significantly affect the 19F spin-lattice relaxation rate (1/T1). Prando2010
The polycrystalline samples were milled to fine powders in order to improve the radiofrequency penetration. All the measurements were performed in a magnetic field of 1.36 T, in the temperature range between 4 K and 100 K. For a few selected samples the temperature range was extended up to 200 K to precisely estimate the high temperature 19F trend.
The 19F spin lattice relaxation rate was estimated by fitting the recovery of the longitudinal magnetization after a saturation recovery pulse sequence (). For all the samples the recovery could be nicely fit to a stretched exponential (see Fig. 4):
| (3) |
with the nuclear magnetization at thermal equilibrium and the stretching exponent.
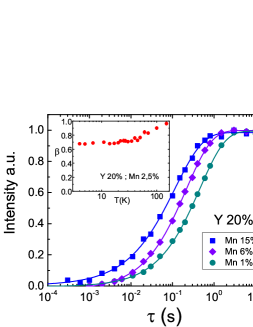
The stretching exponent progressively decreased on cooling below 100 K and it was found in the range for all samples (see the inset to Fig. 4). This behaviour indicates the presence of a distribution of spin lattice relaxation times which is a common feature of disordered systems and in our case it is probably due to the different inequivalent impurity configurations resulting from Y and Mn doping. In fact, the low temperature values of get smaller on increasing the Mn content, namely the number of impurities.
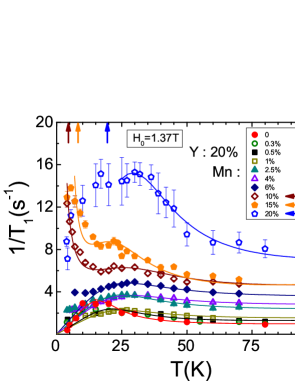
The temperature dependence of in LaY20, for Mn contents ranging from up to , is shown in Fig. 5. While at high temperature displays a linear Korringa behavior (see Ref. Moroni2015, ) typical of weakly correlated metals, below 80K the spin lattice relaxation rate progressively increases on cooling, giving rise to a broad peak around 25K. It is remarked that this increase starts well above Tc or well above TN, for the magnetically ordered samples. Insights on the nature of the peak can be gained by observing its evolution upon changing the magnitude of the external magnetic field . Measurements in a lower field of 0.75 T revealed that while at high temperature is only weakly field dependent, the magnitude of the peak at 25 K is significantly enhanced,Moroni2015 which is exactly the behaviour expected for slow dynamics with a characteristic frequency in the MHz range, close to the Larmor frequency .
The behavior of below 25 K depends on the Mn doping level: in samples with Mn doping below 10% the spin lattice relaxation rate decreases with lowering temperature, while for samples with higher Mn doping we observed a steep increase of with a divergence at temperatures approaching the magnetic transition temperature determined by SR. This behavior is associated with the critical divergence of the spin correlation length on approaching the magnetic transition, which yields a power law divergence of .
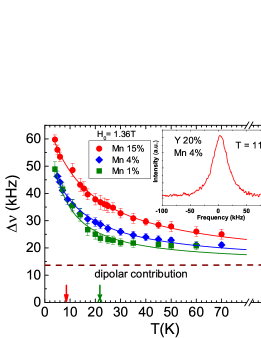
Further insights on the effects of Mn doping can be gained from the study of the temperature dependence of the 19F NMR linewidth , directly related to the amplitude of the staggered magnetization developing around the Mn impuritylinewidth_parigi . was derived from the Fast Fourier Transform of half of the echo signal after a Hahn spin-echo pulse sequence. As it can be seen in Fig. 6 by increasing the Mn content a marked increase of is observed. The data reported were fitted with a Curie-Weiss law (see solid lines in Fig. 6). The temperature independent term kHz estimated from the fit of the data up to K, is in very good agreement with the value 13.5 kHz estimated for the nuclear dipole-dipole interaction derived from lattice sums. About 80% of the second moment is due to F-La nuclear dipole interaction and about 19.5% to F-F interaction, while only a minor contribution arises from F-As interactions. This term practically does not change by increasing the Mn doping since the lattice parameters change by less than 1.2% between and % SupMoroni2015 and the dipolar contribution of 55Mn nuclei for % would cause a change by less than 1% of the linewidth. The results of the fits are summarized in Table. 1.
| Mn (%) | (kHzK) | (K) |
|---|---|---|
| 1 | ||
| 4 | ||
| 15 |
III Discussion
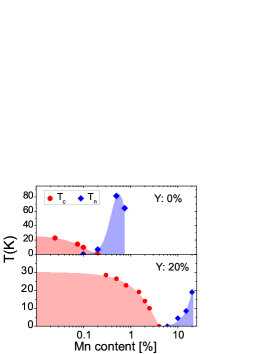
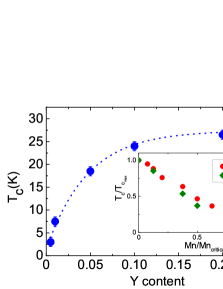
The phase diagram of LaY20, and for comparison that of LaY0 Hammerath2014 , derived from SQUID magnetization and SR measurements, are shown in Fig. 7 as a function of Mn content. These data show that the substitution of La with Y causes a sizeable increase of the critical Mn threshold required to suppress superconductivity, with an increase from 0.2% to 4% on increasing the Y content from 0 to 20%. In the latter system the threshold is comparable to the one observed sato2010 ; singh2013 when smaller paramagnetic ions fully substitute La, namely one has = 4 and 8% for Ln=Nd and Sm, respectively. The results on LaY20, where La is partially substituted by the smaller but non-magnetic Y ion, clearly evidence that the electronic properties of the LaFeAsO0.89F0.11 are significantly affected by the chemical pressure or strain induced by the different radii of the lanthanide ions on the FeAs planes. The effect of the chemical pressure is further evidenced in Fig. 8 showing as a function of the La/Y substitution in La1-yYyFe0.995Mn0.005AsO0.89F0.11. Superconductivity, suppressed by the tiny quantity of 0.5% of Mn for the end member, is gradually restored by increasing the Y content or, in other terms, the chemical pressure.
When superconductivity is fully suppressed a magnetic order arises both in the LaY0 and in the LaY20 series, as shown in Fig. 7. This behavior suggests that the two orders are competing and that for LaY0 a quantum critical point is separating the superconducting and magnetic phases, as supported by the previousHammerath2014 analysis of the temperature dependence of the magnetic correlation length. On the other hand, it should be pointed out that for LaY20 a crossover region where both Tc and TN are zero is observed for 4% 6%.
The onset of a magnetic order for just 0.2% of Mn in LaY0 indicates that in this compound significant electronic correlations must be present. If the ratio between Hubbard repulsion and the hopping integral associated with the -th band is sizeable, a significant enhancement of the local spin susceptibility occurs.Brian In the iron-based superconductors quite different behaviours may be observed for the electrons in the five bands crossing the Fermi level and Hund’s coupling may even lead to orbital selective Mott transitions.Capone However, for simplicity in the following discussion we will consider that in LaFeAsO0.89F0.11 the behaviour can be described by an average value of . If is close to a critical value leading to charge localization, the amplitude and the extension of the spin polarization around the Mn impurity significantly increase with respect to a weakly correlated metalBrian and even a tiny amount of impurities may drive the system towards a magnetic ground-state. Hence, the undoped LaFeAsO0.89F0.11 superconductor must be very close to a QCP since a significant change in the electronic properties occurs by perturbing the system with tiny Mn amounts. This aspect is further supported by the charge localization observed in the LaY0 for Mn contents above and by the significant changes in the axis lattice parameter.Sato1 Moreover, as we have previously mentioned, we found that the behaviour of the spin correlation length is that expected for a two-dimensional antiferromagnet close to a QCP. Hammerath2014 Hence the quenching of superconductivity should not be ascribed to a pair breaking effect, where the suppression of superconductivity yields the recovery of the normal metallic state, but to a quantum phase transition affecting the LaY0 electronic ground-state.
The increase in the chemical pressure induced by Y doping causes an increase in the metallic character and a decrease in . Accordingly, the spin polarization around the Mn impurity is reduced and larger Mn contents are needed to induce a magnetic order which, in any case, appears to be characterized by an order parameter which is weaker than that observed in the LaY0 system (Fig. 7). However, the behaviour of the LaY0 and LaY20 series becomes similar (see the inset of Fig. 8) once the phase diagram is rescaled by the critical Mn content and the superconducting transition temperature for T. Namely the Mn doping level yielding the quantum critical point is renormalized by the decrease in .
Further insights on the effect of Mn in LaY0 and LaY20 can be derived from the analysis of the 19F NMR spin-lattice relaxation rate. As it is shown in Fig. 5 a broad peak in , which is increasing with the Mn content, is detected around 25 K. That peak, observed both in the LaY0 and in the LaY20 series, is a very general feature of these systems since it is present both in superconducting and magnetic samples and also in the sample without Mn doping,Hammerath2013 ; Moroni2015 although slightly shifted to lower temperatures. The introduction of increasing Mn contents gives rise to a progressive enhancement of the peak magnitude, suggesting that the presence of paramagnetic impurities strengthens the low-frequency dynamics already present in the pure compound. Its dependence on the magnetic field intensity Moroni2015 indicates that it has to be associated with low-frequency fluctuations (MHz range). This peak should not be ascribed to the slowing down of the critical fluctuations on approaching , which are present only in the magnetic samples and give rise to a steeper increase in only at lower temperatures (Fig. 5).
The approach devised by Bloembergen-Purcell-PoundBPPtheory (BPP model) is often suited to describe in presence of hyperfine field fluctuations approaching the Larmor frequency , namely in the MHz range. The model assumes that the autocorrelation function for the field fluctuations decays exponentially:
| (4) |
where is the characteristic time of the fluctuations and is the component of the local fluctuating hyperfine field perpendicular to , with its mean square amplitude. The spin lattice relaxation rate, which probes the spectral density at , then takes the form:
| (5) |
where is the nuclear gyromagnetic ratio. In many disordered systems, including cuprates,MHJ2 is described by a thermally activated law , where is the energy barrier and the correlation time at infinite temperature. However, monodispersive fluctuations cannot explain the broad peaks observed in Mn doped compounds. A much better result can be obtained by considering a distribution of energy barriers, and thus of correlation times, associated with the irregular distribution of Mn impurities.
For simplicity, the energy barrier distribution was taken as squared, centered around and with a width . Accordingly Eq.5 takes the form:squareddist
| (6) |
where a linear Korringa-like term was added to account for the high temperature behaviour. Eq. 6 was used to fit the data for all samples with Mn contents lower than 8%, while for samples with higher Mn doping a term proportional to was added to account for the divergence of at the magnetic phase transition. As it is shown in Fig. 5 the data can be suitably fit to Eq. 6, with the parameters reported in Fig. 9. The critical exponent was found to be both for % and for %. Since in quasi-2D antiferromagnets ,carrettaZn with the spin correlation length and and scaling exponents close to the unity Boucher , the value derived for appears to be quite reasonable.
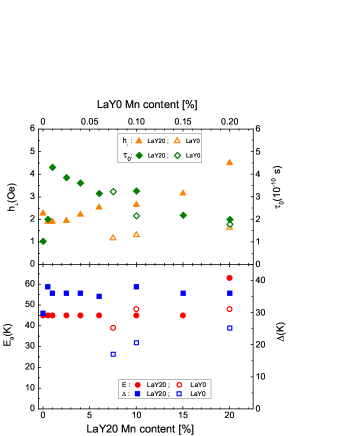
The fit parameters shown in Fig. 9 evidence that the mean value of the energy barrier is nearly constant as a function of Mn and that the variation of the correlation time of the spin fluctuations is small, in the range of 0.1-0.4 ns. In the LaY0 series increases with suggesting that the Mn leads to a distribution of activation energies which reflects a strong inhomogeneous electronic environment, even at very small Mn doping levels. For the LaY20 system this distribution is nearly constant and affected by the disorder induced by the large amount of Y introduced in the system. The most significant change is the increase in the amplitude of the local fluctuating field with , which indicates that the strength of the local spin susceptibility in the FeAs plane becomes progressively enhanced by Mn doping. The enhancement of the local spin susceptibility is further supported by the analysis of the temperature dependence of the 19F NMR line width (Fig. 6), which is directly related to the amplitude of the staggered magnetization developing around the impurity. The results, summarized in Table. 1, show that both the Curie constant and the Curie-Weiss temperature increase as a function of Mn, indicating that the insertion of Mn strengthens the spin correlations.
The origin of the low-energy fluctuations giving rise to the peak in NMR is not yet clear. They seem to be intrinsic to the system since they are detected also for the LaY20 compound without manganese. Furthermore the related activation energies and correlation time are almost insensitive to the Mn content indicating that the low-frequency dynamics is nearly unaltered when approaching the disruption of superconductivity. Bumps in the 1/ vs behaviour have also been detected in other optimally electron-doped iron-based superconductors Hammerath2013 ; bossoni2013 ; dioguardi2015 ; bossoni2015 in the same T range where the peak in 19F NMR 1/ arises in Fig. 5. They have been tentatively associated with nematic fluctuations dioguardi2015 or with the motion of domain walls separating nematic phases bossoni2015 . In this scenario the energy barrier may be related to the one separating the degenerate nematic phases fernandes2012 and the enhancement of the low-frequency dynamics could be associated with the pinning of those fluctuations by impurities. These dynamics do not seem to be involved in the superconducting mechanism since they survive well above the critical threshold for the suppression of .
IV Conclusions
We have shown that Y for La substitution in the optimally electron doped LaFe1-xMnxAsO0.89F0.11 superconductor leads to a shift in the QCP driven by Mn to doping levels much higher than the ones detected in the series without Y. This shift is associated with an increase in the chemical pressure which causes a decrease in the electronic correlations by Y doping, namely in the ratio . Both in the LaY0 and LaY20 series Mn is observed to enhance low-frequency fluctuations in the MHz range which are already present in the normal phase of the Mn and Y free superconductor. These low energy fluctuations are signaled by a peak in which is observed in different families of iron-based superconductors and whose origin still has to be clarified.
acknowledgments
Brian Andersen and Maria Gastiasoro are thanked for useful discussions. This work was supported by MIUR-PRIN2012 Project No. 2012X3YFZ2. This work has been supported by the Deutsche Forschungsgemeinschaft through the Priority Programme SPP1458 (Grant No. BE1749/13), SFB 1143, under grant DFG-GRK1621, and through the Emmy Noether Programme WU595/3-1 (S.W.).
References
- (1) H. Alloul, J. Bobroff, M. Gabay, and P. J. Hirschfeld, Rev. Mod. Phys. 81, 45 (2009).
- (2) J.A. Hertz, Phys. Rev. B 14, 1165 (1975).
- (3) S.Sachdev in Quantum Phase Transitions, Cambridge University Press (1999).
- (4) J. S. Parker, D. E. Read, A. Kumar and P. Xiong, Europhys. Lett. 75, 950 (2006).
- (5) M. Sato and Y. Kobayashi, Solid State Commun. 152, 688 (2012).
- (6) E. Satomi, S. C. Lee, Y. Kobayashi, and M. Sato, Journal of the Physical Society of Japan 79, 094702 (2010).
- (7) S.C. Lee, E. Satomi, Y. Kobayashi and M. Sato, J. Phys.Soc. Jpn. 79, 023702 (2010).
- (8) S. Sanna, P. Carretta, P. Bonfá, G. Prando, G. Allodi, R. De Renzi, T. Shiroka, G. Lamura, A. Martinelli, andM. Putti, Phys. Rev. Lett. 107, 227003 (2011).
- (9) S. Sanna, P. Carretta, R. De Renzi, G. Prando, P. Bonfà, M. Mazzani, G. Lamura, T. Shiroka, Y. Kobayashi, and M. Sato, Phys. Rev. B 87, 134518 (2013).
- (10) D. LeBoeuf, Y. Texier, M. Boselli, A. Forget, D. Colson, and J. Bobroff, Phys. Rev. B 89, 035114 (2014); Y.Texier, Y.Laplace, P.Mendels, J.T.Park, G.Friemel, D.L.Sun, D.S.Inosov, C.T.Lin and J.Bobroff, Eur.Phys.Lett.99, 17002 (2012).
- (11) F. Hammerath, P. Bonfá, S. Sanna, G. Prando, R. De Renzi, Y. Kobayashi, M. Sato, and P. Carretta, Phys. Rev. B 89, 134503 (2014).
- (12) G. S. Tucker, D. K. Pratt, M. G. Kim, S. Ran, A. Thaler, G. E. Granroth, K. Marty, W. Tian, J. L. Zarestky, M. D. Lumsden, S. L. Bud’ko, P. C. Canfield, A. Kreyssig, A. I. Goldman, and R. J. McQueeney, Phys. Rev. B 86, 020503 (2012).
- (13) R. M. Fernandes and A. J. Millis, Phys. Rev. Lett. 110, 117004 (2013).
- (14) M. Moroni, in preparation
- (15) Masatoshi Sato, Yoshiaki Kobayashi, San Chul Lee, Hidefumi Takahashi, Erika Satomi, Yoko Miura, J. Phys. Soc. Jpn. 79 014710 (2010).
- (16) S.J. Singh, J. Shimoyama, A. Yamamoto, H. Ogino, K. Kishio, Physica C 494, 57 (2013).
- (17) A. Alfonsov, F. Murányi, V. Kataev, G. Lang, N. Leps, L. Wang, R.Klingeler, A. Kondrat, C. Hess, S. Wurmehl, A. Köhler, G. Behr, S.Hampel, M. Deutschmann, S. Katrych, N. D. Zhigadlo, Z. Bukowski, J.Karpinski and B. Büchner, Phys. Rev. B 83, 094526 (2011).
-
(18)
F. Hammerath et al., Supplementary Material, Phys. Rev. B 92, 020505(R) (2015), Link: http://link.aps.org/supplemental/10.1103/
PhysRevB.92.020505. - (19) R. Kappenberger, F. Hammerath, P. Rousse, M. A. Afrassa, H. M. Haghighi, S. Kamusella, G. Prando, G. Lamura, A. U. B. Wolter 1 , M. Moroni, S. Sanna, P. Carretta, C. Hess, H. J. Grafe, H. H. Klauß, S. Wurmehl, and B. Büchner, in preparation
- (20) A. J. Drew, F. L. Pratt, T. Lancaster, S. J. Blundell, P. J. Baker, R. H. Liu, G. Wu, X. H. Chen, I. Watanabe, V. K. Malik, A. Dubroka, K. W. Kim, M. Rossle, and C. Bernhard, Phys. Rev. Lett. 101, 097010 (2008).
- (21) Alain Yaouanc and Pierre Dalmas de Réotier, Muon Spin Rotation, Relaxation, and Resonance: Applications to Condensed Matter (Oxford University Press, Oxford, 2011).
- (22) P. Carretta, R. De Renzi, G. Prando, S. Sanna, Physica Scripta 88, 068504 (2013).
- (23) G. Prando, O. Vakaliuk, S. Sanna, G. Lamura, T. Shiroka, P. Bonfa, P. Carretta, R. De Renzi, H.-H. Klauss, C.G.F. Blum, S. Wurmehl, C. Hess, B. Büchner, Phys. Rev. B 87, 174519 (2013).
- (24) F. Hammerath, M. Moroni, L. Bossoni, S. Sanna, R. Kappenberger, S. Wurmehl, A. U. B. Wolter, M. A. Afrassa, Y. Kobayashi, M. Sato, B. Büchner, and P. Carretta, Phys. Rev. B 92, 020505(R) (2015).
- (25) D. LeBoeuf, Y. Texier, M. Boselli, A. Forget, D. Colson, and J. Bobroff, Phys. Rev. B 89, 035114 (2014).
- (26) G. Prando, P. Carretta, A. Rigamonti, S. Sanna, A. Palenzona, M. Putti, and M. Tropeano, Phys. Rev. B 81, 100508 (2010).
- (27) M.N.Gastiasoro and B.M. Andersen, Phys. Rev. Lett. 113, 067002 (2014); M.N.Gastiasoro, F. Bernardini and B.M. Andersen, in preparation
- (28) L. dé Medici, G. Giovannetti and M. Capone Phys. Rev. Lett. 112, 177001(2014).
- (29) N. Bloembergen, E. M. Purcell, and R. V. Pound, Phys. Rev. 73, 679 (1948).
- (30) M.-H. Julien, A. Campana, A. Rigamonti, P. Carretta, F. Borsa, P. Kuhns, A. P. Reyes, W. G. Moulton, M. Horvatic, C. Berthier, A. Vietkin and A. Revcolevschi, Phys. Rev. B 63, 144508 (2001).
- (31) M. Filibian, P. Carretta, T. Miyake, Y. Taguchi, and Y. Iwasa, Phys. Rev. B 75, 085107 (2007).
- (32) P. Carretta, A.Rigamonti and R.Sala, Phys. Rev. B 55, 3734(1997).
- (33) H.Benner and J.P.Boucher in Magnetic Properties of Layered Transition Metal Compounds Ed. L.J. De Jongh, Kluwer Academic Pub. (1990).
- (34) F. Hammerath, U. Grafe, T. Kühne, H. Kühne, P. L. Kuhns, A. P. Reyes, G. Lang, S. Wurmehl, B. Buchner, P. Carretta, and H.-J. Grafe, Phys. Rev. B 88, 104503 (2013).
- (35) L. Bossoni, P. Carretta, W. P. Halperin, S. Oh, A. Reyes, P. Kuhns, and P. C. Canfield, Phys. Rev. B 88, 100503 (2013).
- (36) A. P. Dioguardi, M. M. Lawson, B. T. Bush, J. Crocker, K. R. Shirer, D. M. Nisson, T. Kissikov, S. Ran, S. L. Budko, P. C. Canfield, S. Yuan, P. L. Kuhns, A. P. Reyes, H.-J. Grafe, and N. J. Curro, Phys. Rev. B 92, 165116 (2015).
- (37) L. Bossoni, M. Moroni, P. C. Canfield, W. P. Halperin, M. H. Julien, H. Mayaffre, A. Reyes and P. Carretta, arXiv:1602.01710
- (38) R. M. Fernandes and J. Schmalian, Supercond. Sci. Technol. 25, 084005 (2012).