Four dual AGN candidates observed with the VLBA
Abstract
According to hierarchical structure formation models, merging galaxies are expected to be seen in different stages of their coalescence. However, currently there are no straightforward observational methods neither to select nor to confirm a large number of dual active galactic nuclei (AGN) candidates. Most attempts involve the better understanding of double-peaked narrow emission line sources, to distinguish the objects where the emission lines originate from narrow-line kinematics or jet-driven outflows from those which might harbour dual AGN. We observed four such candidate sources with the Very Long Baseline Array (VLBA) at 1.5 GHz with 10 milli-arcsecond angular resolution where spectral profiles of AGN optical emission suggested the existence of dual AGN. In SDSS J210449.13000919.1 and SDSS J23044.82093345.3, the radio structures are aligned with the optical emission features, thus the double-peaked emission lines might be the results of jet-driven outflows. In the third detected source SDSS J115523.74+150756.9, the radio structure is less extended and oriented nearly perpendicular to the position angle derived from optical spectroscopy. The fourth source remained undetected with the VLBA but it has been imaged with the Very Large Array at arcsec resolution a few months before our observations, suggesting the existence of extended radio structure. In none of the four sources did we detect two radio-emitting cores, a convincing signature of duality.
1 Introduction
Currently it is widely accepted that most of the massive galaxies harbour supermassive black holes (SMBHs) in their centres (Kormendy & Richstone, 1995). In hierarchical structure formation models (Davis et al., 1985; Springel et al., 2005), interactions and mergers between galaxies play an important role in their evolution and consequently in the growth of their central SMBHs (e.g., Ferrarese & Merritt, 2000). It is expected that a particular phase in the merging process, systems with dual SMBHs must be observed in the Universe. Following the definition of Merritt (2013), we refer to systems consisting of dual SMBHs (or dual AGN), where the separation of the two SMBHs are much larger than their influence radii. In contrast, binary SMBHs are those systems where the separation is smaller than the influence radius. In the literature, kpc-scale separation systems are referred to as dual AGN, and pc-scale separation systems as binary AGN (e.g., Colpi, 2014; Volonteri et al., 2015; Müller-Sánchez et al., 2015)
The galaxy merging process can cause enhanced accretion onto the central SMBHs and thus initiate activity. One or both of the dual SMBHs may be active or re-activated. Simulations (e.g., Van Wassenhove et al., 2012) suggest that simultaneous activity is mostly expected at the late phases of mergers, at or below 10 kpc-scale separations. Additionally, recent work of Fu et al. (2015b) indicates that mergers trigger and tend to synchronize activity at separations of few kpc. Therefore dual active galactic nuclei (AGN) are expected to be observed, but they are not easily resolvable with the current observing facilities. The number of convincing dual AGN systems, mostly detected by X-ray and radio observations (e.g., Junkkarinen et al., 2001; Beswick et al., 2001; Komossa et al., 2003; Hudson et al., 2006; Bianchi et al., 2008; Koss et al., 2011; Fu et al., 2011b; Koss et al., 2012; Mazzarella et al., 2012; Liu et al., 2013; Comerford et al., 2015; Müller-Sánchez et al., 2015), are relatively few compared to the theoretically predicted abundance (see also, Komossa & Zensus, 2016). While very long baseline interferometric (VLBI) radio observations currently provide the highest spatial resolution, thus they would be a promising tool for the detection of dual AGN111In fact thanks to its superior resolution, the first binary AGN was discovered by VLBI technique (Rodriguez et al., 2006)., only about % of AGN are radio-loud, therefore dual radio emitting active nuclei would be quite rare. Moreover, when trying to confirm the existence of dual AGN in candidate sources, the non-detection in radio does not immediately falsify the dual AGN hypothesis because radio-quiet nuclei may as well be present. Burke-Spolaor (2011) searched the archival VLBI observations of 3114 radio-emitting AGN for sources containing compact double sources. Only one source (B3 0402379) was found with double nucleus with separation of about pc, which was already known from the observations of Rodriguez et al. (2006).
On the other hand, not just the confirmation of dual AGN, but the selection of candidate sources is not straightforward. During the last decade, it was proposed that double-peaked narrow emission lines might be used to select possible dual AGN sources, where the two sets of narrow lines originate in the two distinct narrow-line regions (NLR) of the two AGN (e.g. Zhou et al., 2004; Wang et al., 2009; Xu & Komossa, 2009). However, it was also shown that this spectral behaviour can be explained by other effects occurring in single AGN. According to Heckman et al. (1981, 1984), double-peaked narrow emission lines can arise due to peculiar kinematics and jet–cloud interaction in a single NLR. More recently Xu & Komossa (2009) discussed several mechanisms for creating double-peaked emission lines in single AGN, including a rotating disk-like NLR, and, in particular, the possibility of a single AGN illuminating the interstellar media of two galaxies in a merger. Further, Crenshaw et al. (2010) pointed out that blobby NLRs and extinction effects can produce multi-peaked narrow emission lines (see also Fischer et al., 2011). To select the real dual AGN from candidate sources, Tingay & Wayth (2011) conducted VLBI observations of a sample of AGN with double-peaked optical emission lines. Among the observed 11 sources, they have found no evidence for double radio cores. Our group also conducted VLBI search for double radio cores from optically-selected dual AGN candidates. In the first of a systematic study of dual AGN candidates, we performed VLBI observations of 3C 316, which is the most radio-loud source in the double-peaked narrow-line AGN sample (Smith et al., 2010), in order to confirm its duality. The VLBI image detected a series of discrete compact knots, however, none of which could be compact enough to be identified as an AGN core. The most possible explanation of the observed radio structure is that it is the radio jet of a single radio-loud AGN in 3C 316. These works thus do not support the idea that double-peaked narrow emission lines are good tracer for dual AGN (although investigations of larger samples are needed to obtain firm statistical result).
Comerford et al. (2012) proposed additional selection critera to narrow down the list of dual AGN candidates from a group of sources showing double-peaked narrow lines. Using long-slit spectroscopy of double-peaked narrow-line AGN (), they tried to separate the sources where the double-peaked lines are the result of AGN outflows or gas kinematics from those which can be compelling dual AGN candidates. Comerford et al. (2012) selected their targets from the catalogs of Wang et al. (2009), Liu et al. (2010), and Smith et al. (2010). They identified double-peaked active galaxies in the Sloan Digital Sky Survey (SDSS) spectral database using the [O III] emission lines. Comerford et al. (2012) proposed that sources with spatially compact emission components may be preferentially produced by dual AGN. Moreover, they concluded that in more than one-third of their sample the double emission features are aligned with the major axis of the host galaxy, which is more than twice the expected amount assuming uniform distribution of the position angles. They proposed that this was also an indication of dual AGN in those objects. In summary, Comerford et al. (2012) concluded that from the observed sources are promising dual AGN candidates with angular separation less than . In sources, the emission features are aligned with the major axis of the host galaxies, in sources the measured spatial offsets and position angles of the emission features are consistent with the separations and position angles of stellar components detected in adaptive optics images.
Among these dual AGN candidates, seven have been detected in the Very Large Array (VLA) Faint Images of the Radio Sky at Twenty-centimeters (FIRST) survey (Becker et al., 1995) at GHz with flux densities between mJy and mJy. We selected the four sources, SDSS J102325.57324348.4 (hereafter J1023+3243), SDSS J115523.74150756.9 (hereafter J1155+1507), SDSS J210449.13000919.1 (hereafter J21040009), and SDSS J23044.82093345.3 (hereafter J23040933) which have integrated flux densities mJy in the FIRST survey, and observed them with the Very Long Baseline Array (VLBA) at GHz. If two compact radio features can be detected at the separations and position angles derived by Comerford et al. (2012) from the optical observations, that would be a clear indication of the existence of dual AGN in the sources. One compact AGN and extended jet-like feature aligned with the optical features may be indicative of jet-driven AGN outflow. However, the detection of only one or no compact radio emission does not exlcude the possibility of dual AGN in the galaxy, since the majority of AGN are not radio emitters.
Throughout the paper we assume a standard flat CDM cosmological model with Hubble constant , and density parameters , and . The linear scales and luminosities were obtained with the online calculator of Wright (2006).
2 Observations and data reduction
The ten 25-m diameter radio telescopes of the U.S. National Radio Astronomy Observatory (NRAO) VLBA were used for observing the four target sources at the central frequency of 1.5 GHz in phase-reference mode (e.g., Beasley & Conway, 1995). Two sources (J1023+3243 and J1155+1507) were observed for 6 h on 2013 March 2 (experiment BA103A). Another 6-h experiment targeting J21040009 and J23040933 was performed on 2013 June 15 (experiment BA103B). The data were taken with 2 Gbit s-1 recording rate, leading to the total bandwidth of 256 MHz in both left and right circular polarizations using 2-bit sampling, in 8 separate intermediate-frequency (IF) channels, each with 32 spectral points. Phase-referencing was performed by periodically nodding the radio telescopes between the targets and the respective nearby bright and compact calibrator source. Nearly 3.5 min in each of the 4.5-min calibrator–target cycles were spent on the targets. The delay, delay rate, and phase solutions derived for the phase-reference calibrators (J1021+3437, J1157+1638, J2105+0033, and J23031002) could later be interpolated and applied for the respective target-source data, to improve the sensitivity of the observations of these weaker objects. The target–reference angular separations were (between J1023+3243 and J1021+3437), (between J1155+1507 and J1157+1638), (between J21040009 and J2105+0033), and (between J23040933 and J23031002). The total on-source time spent on each target was 2 h, the expected image thermal noise was 20 Jy beam-1. In addition, the strong fringe-finder sources 4C 39.25 and 3C 454.3 were occasionally observed in experiments BA103A and B, respectively.
The NRAO Astronomical Image Processing System222http://www.aips.nrao.edu (AIPS) was used for the data calibration (e.g., Diamond, 1995). We followed the standard procedures applicable to the calibration of continuum VLBA data. This involved corrections for the dispersive ionospheric delay using maps of the total electron content derived from global navigation satellite systems measurements, for the accurately measured Earth orientation parameters, and for digital sampling effects. The visibility amplitudes were calibrated using system temperatures and antenna gains measured at the telescopes. The amplitude calibration was performed following the procedure outlined in Walker (2014). Phases were then corrected for parallactic angle effects. After an initial correction of instrumental phases and delays using a short scan on a strong calibrator source, fringe-fitting was first performed for all the phase-reference calibrator (J1021+3437, J1157+1638, J2105+0033, and J23031002) and fringe-finder sources (4C 39.25, 3C 454.3). The calibrated data were then exported to the Difmap package (Shepherd et al., 1994) for imaging. The conventional hybrid mapping procedure with subsequent iterations of CLEANing (Högbom, 1979) and phase (then amplitude) self-calibration provided the images and brightness distribution models for the calibrators. Overall antenna gain correction factors were determined at the first step of the amplitude self-calibration. These indicated that the a-priori amplitude calibration was accurate within % for each antenna, therefore no further gain correction was necessary for the target sources. Fringe-fitting was repeated for the phase-reference calibrators in AIPS. For this second case, the CLEAN component models of their brightness distributions derived in Difmap were also taken into account, to compensate for any residual phases resulting from their non-pointlike structure. The solutions obtained were interpolated and applied to the respective target source data. Finally, the calibrated and phase-referenced visibility data of the four target sources (J10233243, J11551507, J21040009, and J23040933) were also exported to Difmap for imaging. Natural weighting was applied to achieve the lowest image noise. No self-calibration was attempted. The images displayed in Figures 1–3 were restored with CLEAN component models obtained in Difmap for the three target sources detected.
To describe the brightness distribution quantitatively, we fitted the visibilities with circular Gaussian model components using the task modelfit within Difmap. The parameter errors were calculated following the equations given by Fomalont (1999); to account for an assumed VLBI amplitude calibration uncertainty, another % error was added quadratically to the flux density errors. The sum of the integrated flux densities of these model components () for each source is given in Col. 6 in Table 1. The parameters and designations of the model components are listed in Table 2.
3 Results
| Name | RA | DEC | Scale | |||||
|---|---|---|---|---|---|---|---|---|
| mJy | mJy beam-1 | mJy | mJy beam-1 | pc mas-1 | ||||
| J1023+3243 | aaJ1023+3243 was undetected with VLBA, thus the coordinates given are from the FIRST survey (Helfand et al., 2015). | aaJ1023+3243 was undetected with VLBA, thus the coordinates given are from the FIRST survey (Helfand et al., 2015). | 2.7 0.4 | 1.2 0.1 | 0.127 | 2.271 | ||
| J1155+1507 | 2.0 0.3 | 1.6 0.1 | 0.287 | 4.319 | ||||
| J21040009 | 3.5 0.2 | 4.0 0.1 | 0.135 | 2.393 | ||||
| J23040933 | 8.9 0.3 | 9.0 0.2 | 0.032 | 0.639 |
Col. 1: source names; Col. 2: right ascensions; Col. 3: declinations; Col. 4 integrated flux densities from the FIRST catalog (Helfand et al., 2015), the errors, since they are not given in the catalog, are derived from the FITS images downloaded from Vizier (http://vizier.u-strasbg.fr/viz-bin/VizieR?-source=VIII/92) ; Col. 5 peak brightness and errors from the FIRST catalog (Helfand et al., 2015); Col. 6: sums of the flux density of the Gaussian model components fitted to the VLBA visibilities; Col. 7: peak brightness of the VLBA maps; Col. 8: redshifts; Col. 9: linear scales of the sources.
Three sources were detected out of our four targets. The brightness upper limit for the non-detected source, J1023+3243, is Jy beam-1. According to the FIRST survey, this source has the smallest peak brightness value ( mJy beam-1) and it is the least compact among the four, indicated by the smallest ratio of the peak brightness to the integral flux density (Table 1). Therefore it is not surprising that it was undetected in our high-resolution VLBA observation.
We used the AIPS verb maxfit to derive the astrometric positions of the brightness peaks in the detected three sources. These coordinates do not necessarily coincide with the position of the AGN core. The obtained positions are listed in Col. 2 of Table 1. We estimate that each coordinate is accurate to within milli-arcseconds (mas). The sources of positional error are the thermal noise of the interferometer phases, the error of the phase-reference calibrator positions and the systematic error of the phase-reference observations mainly originating from atmospheric turbulences. In the case of the calibrator source J23031002, the positional accuracy given in the second realization of the International Celestial Reference Frame (ICRF2, Fey et al., 2015) is mas. However, more accurate coordinates are given in the latest Radio Fundamenal Catalog of L. Petrov (rfc2015c)333http://astrogeo.org/vlbi/solutions/rfc_2015c/. When we calculated the astrometric position of the target source J23040933, we used the latter values, thus we were able to obtain the coordinates with the same accuracy as for the other two detected sources.
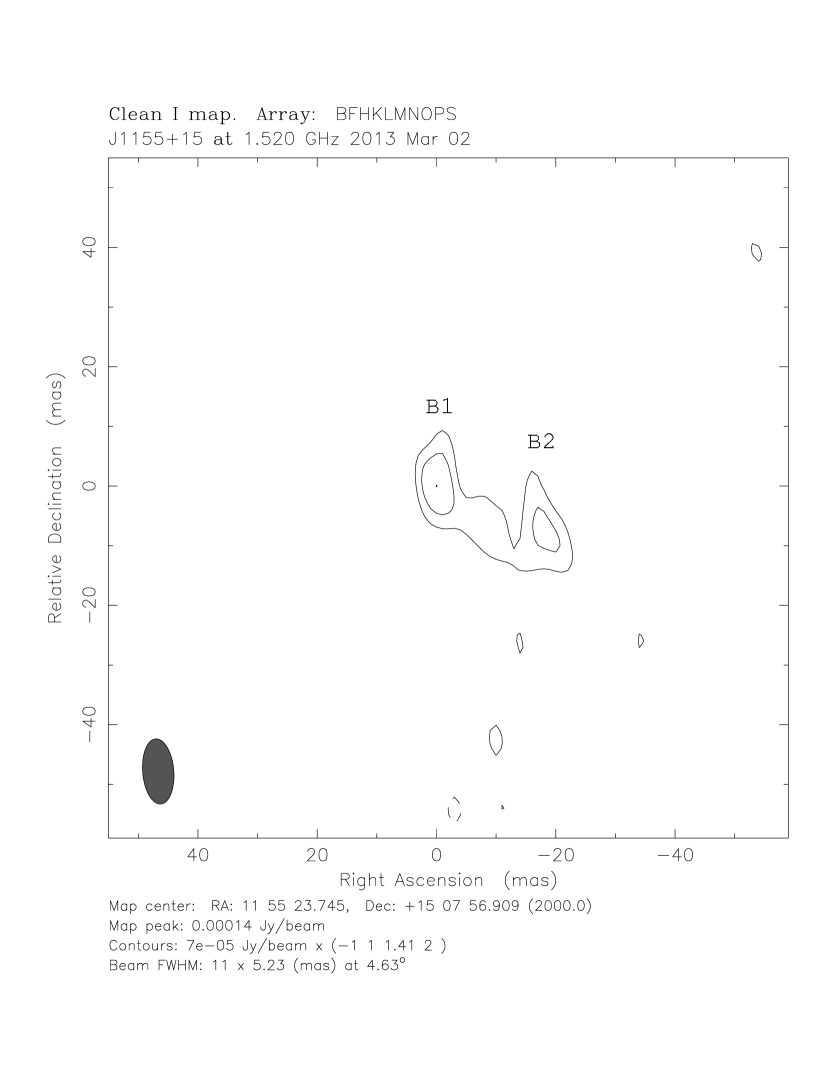
J11551507 is the most distant () and the faintest of the three detected sources. It has an elongated structure of mas (Figure 1). The brightness distribution can be best fitted with two circular Gaussian components (Table 2), a compact (B1), and a more extended one (B2). Among the three detected sources, this has the largest ratio of the ‘missing’ flux density compared to the FIRST flux density, i.e. more than % of the radio flux density detected on arcsec scale originates from extended emission that is resolved out with the VLBA.
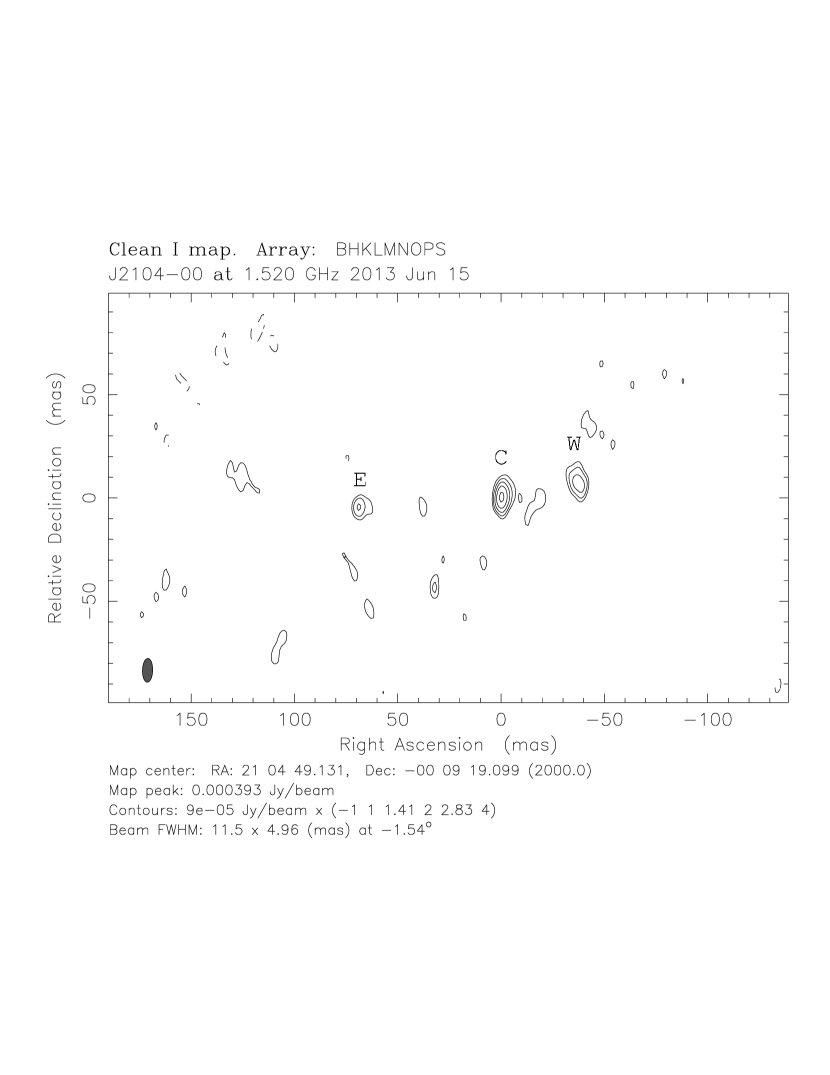
The radio image of J21040009 (Figure 2) is dominated by a compact bright feature (C). It can be well fitted with a circular Gaussian brightness distribution of mJy flux density and mas diameter (full width at half-maximum, FWHM). Several low-brightness features can be detected at both sides of the compact central component. The elongated structure is rather asymmetrical. Considering the most prominent detected features, it can be traced to mas to the east and mas to the west of component C. These two distant features can be fitted with circular Gaussian components. The eastern one (E) is smaller and fainter, while the western one (W) is slightly more extended and brighter (Table 2).
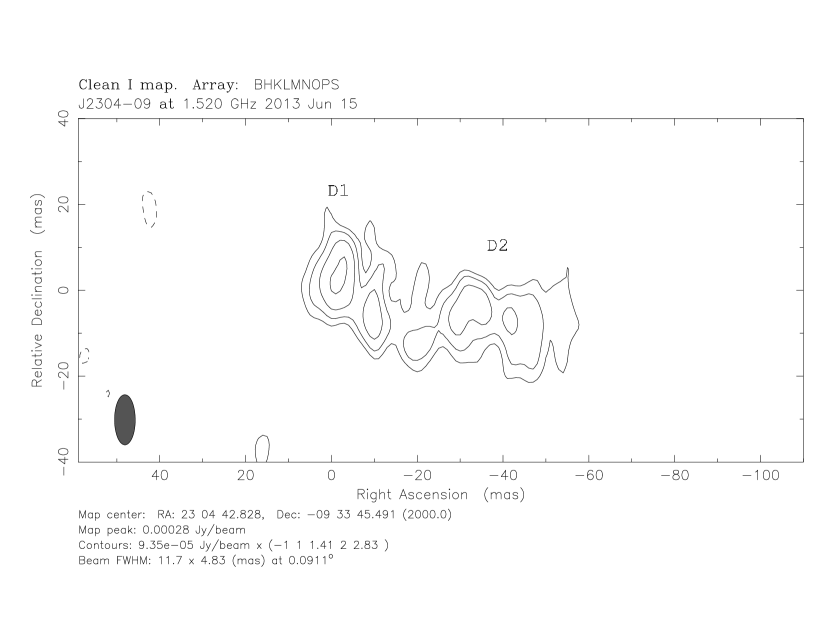
J23040933 is the brightest and the closest source () in our sample. At the high resolution of the VLBA, it exhibits a complex linear radio structure oriented roughly east–west with a size of almost mas (Figure 3). The source seems to be decomposed into 5 or 6 different features along the direction of the minor axis of the restoring beam. However, they cannot be fitted individually, the best fitted model consists of two slightly extended circular Gaussian brightness distribution components, D1 and D2 (Table 2).
| Name | Comp. ID | Distance | PA | Flux density | FWHM size | |
| mas | mJy | mas | ||||
| J11551507 | B1 | |||||
| B2 | ||||||
| J21040009 | C | |||||
| E | ||||||
| W | ||||||
| J23040933 | D1 | |||||
| D2 |
Col. 1: source names; Col. 2: component designations; Col 3 and 4: separations and position angles with respect to the brightest component (position angles are measured from north through east); Col. 5: integrated flux densities; Col. 6: FWHM sizes; Col. 7: calculated brightness temperatures.
We calculated the brightness temperature of the Gaussian components in the detected three sources as:
| (1) |
where is the flux density measured in Jansky, is the FWHM size of the fitted circular Gaussian component in mas, is the redshift and is the observing frequency in GHz. The brightness temperatures of each component given in the last column of Table 2 are typically a few million K, except for component C in J21040009 which has an order of magnitude higher brightness temperature value, K. Thus the radio emission from these components are non-thermal, of synchrotron origin. The derived brightness temperature values all exceed the limit of K, which is the maximum brightness temperature for starburst galaxies not containing an active nucleus (Condon, 1992). On the other hand, the brightness temperatures are all well below the equipartition brightness temperature ( K, Readhead, 1994), thus there is no indication of relativistic beaming of the radio (jet) emission in any of the sources. These values are typical for low luminosity radio AGN (e.g., Alexandroff et al., 2012; Panessa & Giroletti, 2013).
We can estimate the monochromatic radio power of the detected VLBI components according to
| (2) |
where is the luminosity distance, is the flux density at GHz, is the redshift, and is the spectral index (defined as ). Compact radio sources usually have flat spectra (thus ), while more extended, jet-like features have steep spectra with a spectral index typically between and (e.g., Hovatta et al., 2014). As we do not have spectral information of our sources, for the VLBI-detected compact features we assume a spectral index of . Since the redshifts of the sources are small, the choice of spectral index does not influence significantly the value of the obtained radio powers. The calculated radio powers are a few times in the case of the components of J11551507 and J21040009, and an order of magnitude lower, in the case of J23040933. According to Kewley et al. (2000) and Middelberg et al. (2011), AGN have high-luminosity cores, with power exceeding . On the other hand, Alexandroff et al. (2012) use the luminosities of the supernova remnant (SNR) complexes of Arp 299-A and Arp 220 to determine an upper limit for non-thermal radio emission that can originate from starburst-related activity. These are , and in the case of Arp 299-A and Arp 220, respectively. The derived radio powers of our faint radio sources are very close to these limiting values, however there are no other indications of starburst activity in any of the objects. All of the sources in Comerford et al. (2012) were selected using optical emission line diagnostics to ensure the selection of AGN. Additionally, Brinchmann et al. (2004) give star formation rate (SFR) for two of our sources, for J21040009, and for J23040933. They classify both sources as AGN as well. These SFR values are much lower than those of the two extreme starburst galaxies mentioned above (, e.g., Howell et al., 2010). Thus the non-thermal radio emission detected in our VLBA observations can most probably be explained as originating from the AGN in these sources.
We can also invoke the radio–far-infrared correlation (Yun et al., 2001) to estimate the maximum starburst-related contribution in our sources. None of the sources are listed in the publicly available archives of the m observations, therefore we used the Infrared Astronomical Satellite (IRAS) Scan Processing and Integration Tool444Provided by the NASA/IPAC Infrared Science Archive: http://irsa.ipac.caltech.edu/applications/Scanpi/ (SCANPI) to derive upper limits for the m flux densities from the IRAS archive; this is mJy for three sources (J10233243, J21040009, and J23040933). In the case of J11551507, there is a detection according to SCANPI with a m flux density of mJy. The radio flux densities reported by FIRST in all sources are in excess of the radio emissions calculated from the radio–far-infrared correlation using the upper limit of mJy and using the mJy detection. This also indicates that AGN must contribute to the radio emission.
The radio structures of the detected three sources are compact with sizes well below kpc. Following the description of Compact Symmetric Objects (CSOs) as given in Fanti (2009) (not necessarily symmetric but two-sided radio structure with respect to a weak or undetected core), J11551507 and J23040933 can be categorized as CSOs. Their low radio powers and small sizes would place them in the lower left part of the radio power–linear size diagram shown in Figure 1. of An & Baan (2012). On the other hand, the radio morphology of J21040009 (e.g., its prominent central component, C) is not typical of CSOs.
The flux densities obtained with the VLBI observations on angular scales of mas are significantly below the flux densities reported in the FIRST survey at a similar observing frequency. The missing flux densities are %, %, %, and % for the sources, J11551507, J21040009, J23040933, and J10233243 respectively. This can arise from the different angular resolution (our high-resolution VLBA observations resolve out the large-scale structure in the sources), or from flux density variability, or the combination of both effects. While flux density variability cannot be ruled out completely, we expect that compact features (on VLBI scales) are responsible for the variability. It is however unlikely that in all sources the most compact features decreased in flux density by a factor of % to % between their observations in the FIRST survey and our VLBA observations. On the other hand, in all detected sources we see complex, resolved VLBI structures. Thus, it is natural to expect that (at least most of) the missing flux densities belong to extended features larger than the largest recoverable size () in our VLBA observations. The largest recoverable size of an interferometer is set by its shortest baseline () and the observing wavelength () as (Wrobel, 1995). In our VLBA observation, the shortest baseline length is that of between Los Alamos and Pie Town ( km), thus the array at GHz is insensitive for structures larger than mas.
We can estimate the radio power connected to these missing flux densities; these are thus upper limits of the radio powers originating from the extended structures of the sources. The values are in J11551507, J21040009, and J10233243 and an order of magnitude lower for J23040933. Some of the radio emission might originate from starburst activity in the AGN host galaxy. Using the relation of Hopkins et al. (2003), one can estimate the star formation rate from the radio power as:
| (3) |
Knowing the upper limit for the radio power, we can derive an upper limit for the star formation rate. These are , , , and for J11551507, J21040009, J23040933, and J10233242 respectively. In the two sources for which SFR values are given in the literature (J21040009, J23040933; Brinchmann et al., 2004), the upper limits are consistent with those, thus part of the missing flux density can originate from star formation, but AGN related radio emission (from e.g., extended lobes) plays an important role.
4 Discussion
J11551507 was one of the candidate dual AGN selected by Comerford et al. (2012) based on the adaptive optics images of Fu et al. (2011a) (see also Fu et al., 2012), while J21040009, J23040933, and J10233243 were selected on the basis that their emission features aligned with the major axis of the host galaxy. Comerford et al. (2012) determined the spatial extent and position angle of the two emission components in their sample. The angular projected spatial offsets of the narrow-line emission features are , , and in the case of J11551507, J21040009, and J23040933, respectively. These separations are an order of magnitude (in the case of J11551507, and J23040933), or more than times (in the case of J21040009) larger than the size of the radio structures detected in our VLBA observations.
We checked the fields around the four sources’ positions, but we did not find any additional radio emission above image brightness level, thus above Jy beam-1, Jy beam-1, and Jy beam-1 in the case of J11551507, J21040009, and J23040933, respectively. Using equation 2, and assuming a spectral index, we can estimate the monochromatic the radio power upper limits associated with these image brightness levels. The largest (most conservative) upper limits are obtained assuming a steep spectral index of . The estimated upper limits for the monochromatic powers, W Hz-1 in the case of J11551507, and W Hz-1 in the case of J21040009, do not exclude the existence of a low-luminosity radio-emitting AGN. In the case of the third source, J23040933, the derived upper limit of the radio power is W Hz-1, therefore considering the lower limit of radio power for AGN cores ( W Hz-1) given by Kewley et al. (2000) and Middelberg et al. (2011), we can exclude the existence of another radio-emitting AGN around this source. However a radio-silent AGN can still give rise to the optical emission features detected by Comerford et al. (2012) and remain undetected in our observation.
We can compare the position angles of the optical emission features and the radio structure as well. Our fitted Gaussian model components to the visibility data, W and E in J21040009 are at position angles and at , respectively. This roughly east–west oriented structure (Figure 2) matches well with the position angle of of the optical emission components given by Comerford et al. (2012). In J23040933 (Figure 3) the position angle of D2 is which is broadly consistent (modulo ) with the position angle of given by Comerford et al. (2012). Thus in these two sources the VLBI-detected radio features, similarly to the optical emission features, are located along the plane of the host galaxy. Radio emission aligned with the plane of the host galaxy might indicate that it originates from star formation rather than AGN jet activity. However, in Sect. 3, we showed that the high radio powers in J21040009 and the star formation rate estimate for J23040933 render unlikely that these radio emission features originate from SNRs or SNR complexes.
J21040009 and J23040933 were imaged in the near-infrared with the NIRC2 camera (PI: Keith Matthews) enhanced by Laser Guide Star Adaptive Optics system on the Keck II Telescope (Keck II/LGSAO, Wizinowich et al., 2006). J21040009 was observed with a broadband H(m) filter, J23040933 was observed with a broadband Kp(m) filter. The images were published by McGurk et al. (2015). Both sources show single spatial structures. McGurk et al. (2015) concluded that the double-peaked narrow-line emissions in these sources are likely not caused by kpc-separation dual AGN but are due to NLR kinematics, outflows, jets, rings of star formation, or a close pair of AGN which cannot be resolved in the near-infrared. The good coincidence between the double emission components and the radio structure in our VLBA images (Figs. 2, 3) suggest that the radio jets, although on much larger scales than mapped here, do play a role in producing the emission regions responsible for the double-peaked spectral lines. Thus our data support the jet-driven scenario for the double-peaked emission lines. Both of these sources were selected by Comerford et al. (2012) as good candidates of being dual AGN, because of the orientation of the optical emission features in the plane of the host galaxy. Our observations together with the results of near-infrared imaging seems to suggest that this criterion may not be a good indicator of AGN duality.
For J11551507, the position angle of the two emission components given by Comerford et al. (2012) is . The position angle of the radio structure (Figure 1) is , nearly perpendicular the position angle derived from optical spectroscopy, thus they are probably not related. According to the high-resolution image of J11551507 obtained with the NIRC2 camera on Keck II/LGSAO with a broadband Kp(m) filter by Fu et al. (2011a) (see also Fu et al., 2012), this source is a merging system with a component separation of kpc. The component separation and the position angle are also compatible with the values given in Comerford et al. (2012). Additionally, integral-field spectroscopy of the source with the Supernova Integral-Field Spectrograph (Aldering et al., 2002; Lantz et al., 2004) on the University of Hawaii m telescope on Mauna Kea was acquired by Fu et al. (2012). The integral-field spectroscopy data spatially resolved the emission line in the source; Fu et al. (2012) classified J11551507 as having extended NLR. The resolved stellar components were enveloped by the spatially extended [O III] emission. Fu et al. (2012) concluded that although the extended NLR is clearly responsible for the double-peaked line profiles, it is impossible to decide whether both or just one AGN powers the NLR. In our VLBA image, the detected two components are separated by pc, and connected with continuous emission structure; their radio emission most probably originate in one of the two merging galaxies detected in the near-infrared image (Fu et al., 2012). Because of the lack of astrometric registration of the adaptive-optics image (Fu et al., 2012), we cannot determine which near-infrared component is associated with the VLBI-detected compact radio emission.
The fourth source in our sample, J10233243, which was not detected with VLBA in our experiment, was however successfully observed and imaged by Müller-Sánchez et al. (2015) with the VLA555Unfortunately Müller-Sánchez et al. (2015) do not list the date of their observations. According to the NRAO archive, within their program, the observations of J10233243 took place on 2012 October 13 and 2013 January 5. Both of these dates precede by several months our VLBA observation (2013 March 2).. Müller-Sánchez et al. (2015) observed several sources of the sample of Comerford et al. (2012) with the VLA in A configuration in X band to clarify the nature of the of the double-peaked narrow line emission galaxies. The only overlapping source with our sample is J10233243. Müller-Sánchez et al. (2015) used two subbands within the X band, the lower one centered at GHz, the upper one at GHz. They detected two radio components in J10233243 when combining the observations from the two subbands by averaging across all spectral channels. The position angle of the radio structure is in agreement within the errors with the results given by Comerford et al. (2012) from the optical spectroscopy. The position angle agrees also well with the photometric major axis of the host galaxy. The separation of the two radio features are slightly smaller than that of the optical emission line features. The two radio features are also detected in the lower subband, while the detection of the fainter component is only marginal in the upper subband; the fainter feature is detected at noise level at GHz. The VLA-detected radio features are weak with flux densities of mJy. The spectrum of the brighter feature is slightly inverted, , while the fainter feature is flat with . (However, because of the marginal detection of the latter feature in the upper subband, the spectrum can be much steeper.) Müller-Sánchez et al. (2015) conclude that the VLA observation confirm the existence of dual AGN in J10233243, however based upon the difference between the distance derived from the optical emission and the distance between the VLA-detected radio features, they suggest that additional kinematic component related to outflows may be present in the source.
To interpret the VLA results of Müller-Sánchez et al. (2015) and our own VLBA observations of J10233243 in a common context, we assume that the radio spectra of the two features follow the same power-law down to GHz. Then the two VLA components have a flux density of mJy and mJy, respectively, at 1.5 GHz. Our VLBA observation would have had adequate sensitivity to detect the brighter one. Our non-detection may be explained by source variability, or resolved source structure (which is already hinted by the very low value, less than of the ratio of peak brightness to integrated flux density in the FIRST, see Table 1), or an even more inverted spectrum () than the one derived from the X-band VLA data.
At GHz (in L band), the source was detected in the FIRST survey with a flux density of mJy, but remained undetected in the NRAO VLA Sky Survey (NVSS, Condon et al., 1998). The latter has a completeness level of mJy, thus it may have just missed J10233243. (Since the NVSS was conducted at lower resolution than the FIRST, the non-detection cannot be explained by resolution effect.) One can also compare the extrapolated (to GHz) and summed flux density of the features detected by Müller-Sánchez et al. (2015), mJy, to the value given in FIRST. If the assumption about the power-law spectra with the X-band spectral indices holds, only one-tenth of the FIRST flux density is detected by Müller-Sánchez et al. (2015). This, together with the very low value (less than 50 %) of the ratio of peak brightness to integrated flux density in the FIRST, already suggests a resolved radio structure.
Thus we cannot strengthen the conclusion of Müller-Sánchez et al. (2015) that J10233243 is a dual AGN, since we did not detect any compact (on VLBA scales), high radio power feature in this source. If there is a compact radio-emitting core in any of the two features detected in the VLA observations, they must have low radio luminosity, a few times , similar to J23040933. Interestingly, dual AGN scenario for J10233243 was not supported by the near-infrared image of McGurk et al. (2015), since only a single spatial structure was detected.
5 Summary
According to hierarchical structure formation models, we expect to see merging galaxies in different stages of their coalescence. Dual AGN with kpc-scale separation bridge the gap between the earliest (galaxy pairs at tens of kpc separations) and ultimate (SMBH binaries at pc or sub-pc separations) evolutionary stages of galaxy mergers, thus they provide vital information on the galaxy evolution and SMBH growth during this intermediate stage (Merritt & Milosavljević, 2005; Komossa, 2006).
Because high spatial resolution is required, it is difficult to directly map dual AGN, especially in the distant Universe. Instead, the search for spatially unresolved dual AGN relies mostly on indirect evidence. However, currently there is no known observational signature which can be used to reliably select dual AGN candidates. Double-peaked narrow emission lines in which the radial velocity offset between two line features marks the orbital motion of dual AGNs were proposed as such (Wang et al., 2009). But further observations of these candidate sources with high resolution found that only 1 % of them can be genuine dual AGN (Fu et al., 2011a); in most of the sources this spectral behaviour can be be explained by other effects not requiring dual AGN (Heckman et al., 1981, 1984; Xu & Komossa, 2009; Crenshaw et al., 2010). As shown by several works (e.g., Fu et al., 2011a; Fischer et al., 2011; Shen et al., 2011; Tingay & Wayth, 2011; Frey et al., 2012; Comerford et al., 2013; An et al., 2013; Gabányi et al., 2014; Kharb et al., 2015; McGurk et al., 2015), double-peaked narrow lines alone are not good indicators to select compelling dual AGN candidates, other diagnostic methods have to be used.
Comerford et al. (2012) used high-resolution long-slit spectroscopy to select the most compelling dual AGN candidates from the double-peaked narrow emission line active galaxies. They concluded that out of the observed are good dual AGN candidates. We observed with the VLBA at GHz four of the candidate sources, which have the highest radio flux densities according to the FIRST survey. These observations were intended as a pilot study aimed to those sources where results can be obtained with reasonable integration time. Thus our sample is not complete. To obtain a statistically useful result more observations of the fainter sources are essential.
From the observed sources, we were able to detect three. None of them has a secondary compact radio-emitting source at a separation indicated by the optical emission line features (Comerford et al., 2012) at a level. In the case of J23040933, the lower limit of the radio power calculated from the rms noise level is less than the lower limit implied for the cores of radio-emitting AGN by Kewley et al. (2000) and Middelberg et al. (2011). Thus in the case of J23040933, we can exclude the existence of another radio-emitting AGN in the host galaxy. In the other two detected sources, low-luminosity ( W Hz-1 and W Hz-1) radio-emitting AGN can in princple be still present in the sources.
In two sources (J21040009 and J23040933), the radio structures are oriented at similar position angles as the optical emission features. The radio components in these two sources may be associated with jet emission, thus the double-peaked emission lines can be caused by jet-driven outflows, instead of dual AGN. However, in the third source (J11551507), where Fu et al. (2012) imaged and spatially resolved the two interacting galaxies in the near-infrared positionally coinciding with the double-peaked emission line features, the observed VLBA radio structure is less extended and is oriented in a nearly perpendicular position angle. Thus, the radio structure is seemingly unrelated to the structure seen in the narrow emission line emitting regions. Likely one of the merging galaxies has a radio-emitting AGN, but we cannot determine which galaxy is associated with the compact radio emission.
The fourth source (J10233243) which remained undetected in our VLBA mini-survey, was however detected by Müller-Sánchez et al. (2015) with the VLA at GHz and GHz a few months before our observations. They observed two radio components at a position angle corresponding to that of the optical emission features. Using the derived spectral index of the brighter feature, if the source is not variable, and/or if it is compact, we should have been able to detect it with the VLBA. FIRST survey data suggest that the source has extended, resolved structure at GHz. Thus we cannot strengthen the conclusion of Müller-Sánchez et al. (2015) that J10233243 is a dual AGN.
In summary, we did not find two compact radio emitting cores in any of the four VLBA-observed candidate dual-AGN sources. This does not exclude the presence of dual AGN in these sources, since % of AGN are known to be radio-quiet.
VLBI observations are an effective way to prove AGN-related radio emission and can provide the required resolution to confirm the existence of the two radio-emitting nuclei in dual AGN candidates (e.g., Deane et al., 2014). However, the majority of the AGN are not radio-loud and currently it is not clear whether the triggering of radio emission is related anyhow to duality or merging phases. On the other hand, mapping the jet structure with radio observations and compare it to structures associated with those emitting the optical spectral features might indicate that the double-peaked emission lines originate from jet-driven outflows. For nearby sources, mapping the spectral index distribution at VLA resolution may help in this regard. For example, Fu et al. (2015b) discarded two of their six candidate dual AGN sources (Fu et al., 2015a) based upon the radio spectral index maps. But to reliably distinguish jets and outflows from the AGN core, the fine resolution provided by the VLBI technique is important.
Achieving the required imaging sensitivity to completely rule out the existence of two low-luminosity radio-emitting AGN in a candidate source requires ample amount of observing time (preferably at more than one frequency), thus with currently available instruments it can realistically be accomplished for individual sources or small samples, and not in survey mode. The Square Kilometre Array (SKA), when fully deployed would have the powerful survey efficiency and the sufficient sensitivity to detect dual AGN with separations less than kpc in principle at all redshifts (Deane et al., 2015). The SKA as an element of a VLBI array (Paragi et al., 2015) could be necessary to identify close pairs at pc-scale separations.
References
- Aldering et al. (2002) Aldering, G., Adam, G., Antilogus, P., et al. 2002, in Society of Photo-Optical Instrumentation Engineers (SPIE) Conference Series, Vol. 4836, Survey and Other Telescope Technologies and Discoveries, ed. J. A. Tyson & S. Wolff, 61
- Alexandroff et al. (2012) Alexandroff, R., Overzier, R. A., Paragi, Z., et al. 2012, MNRAS, 423, 1325
- An & Baan (2012) An, T., & Baan, W. A. 2012, ApJ, 760, 77
- An et al. (2013) An, T., Paragi, Z., Frey, S., et al. 2013, MNRAS, 433, 1161
- Beasley & Conway (1995) Beasley, A. J., & Conway, J. E. 1995, in Astronomical Society of the Pacific Conference Series, Vol. 82, Very Long Baseline Interferometry and the VLBA, ed. J. A. Zensus, P. J. Diamond, & P. J. Napier, 327
- Becker et al. (1995) Becker, R. H., White, R. L., & Helfand, D. J. 1995, ApJ, 450, 559
- Beswick et al. (2001) Beswick, R. J., Pedlar, A., Mundell, C. G., & Gallimore, J. F. 2001, MNRAS, 325, 151
- Bianchi et al. (2008) Bianchi, S., Chiaberge, M., Piconcelli, E., Guainazzi, M., & Matt, G. 2008, MNRAS, 386, 105
- Brinchmann et al. (2004) Brinchmann, J., Charlot, S., White, S. D. M., et al. 2004, MNRAS, 351, 1151
- Burke-Spolaor (2011) Burke-Spolaor, S. 2011, MNRAS, 410, 2113
- Colpi (2014) Colpi, M. 2014, Space Sci. Rev., 183, 189
- Comerford et al. (2012) Comerford, J. M., Gerke, B. F., Stern, D., et al. 2012, ApJ, 753, 42
- Comerford et al. (2015) Comerford, J. M., Pooley, D., Barrows, R. S., et al. 2015, ApJ, 806, 219
- Comerford et al. (2013) Comerford, J. M., Schluns, K., Greene, J. E., & Cool, R. J. 2013, ApJ, 777, 64
- Condon (1992) Condon, J. J. 1992, ARA&A, 30, 575
- Condon et al. (1998) Condon, J. J., Cotton, W. D., Greisen, E. W., et al. 1998, AJ, 115, 1693
- Crenshaw et al. (2010) Crenshaw, D. M., Schmitt, H. R., Kraemer, S. B., Mushotzky, R. F., & Dunn, J. P. 2010, ApJ, 708, 419
- Davis et al. (1985) Davis, M., Efstathiou, G., Frenk, C. S., & White, S. D. M. 1985, ApJ, 292, 371
- Deane et al. (2015) Deane, R., Paragi, Z., Jarvis, M., et al. 2015, Proceedings of Science, PoS(ASKAA14), 151
- Deane et al. (2014) Deane, R. P., Paragi, Z., Jarvis, M. J., et al. 2014, Nature, 511, 57
- Deller et al. (2011) Deller, A. T., Brisken, W. F., Phillips, C. J., et al. 2011, PASP, 123, 275
- Diamond (1995) Diamond, P. J. 1995, in Astronomical Society of the Pacific Conference Series, Vol. 82, Very Long Baseline Interferometry and the VLBA, ed. J. A. Zensus, P. J. Diamond, & P. J. Napier, 227
- Fanti (2009) Fanti, C. 2009, Astronomische Nachrichten, 330, 120
- Ferrarese & Merritt (2000) Ferrarese, L., & Merritt, D. 2000, ApJ, 539, L9
- Fey et al. (2015) Fey, A. L., Gordon, D., Jacobs, C. S., et al. 2015, AJ, 150, 58
- Fischer et al. (2011) Fischer, T. C., Crenshaw, D. M., Kraemer, S. B., et al. 2011, ApJ, 727, 71
- Fomalont (1999) Fomalont, E. B. 1999, in Astronomical Society of the Pacific Conference Series, Vol. 180, Synthesis Imaging in Radio Astronomy II, ed. G. B. Taylor, C. L. Carilli, & R. A. Perley, 301
- Frey et al. (2012) Frey, S., Paragi, Z., An, T., & Gabányi, K. É. 2012, MNRAS, 425, 1185
- Fu et al. (2011a) Fu, H., Myers, A. D., Djorgovski, S. G., & Yan, L. 2011a, ApJ, 733, 103
- Fu et al. (2015a) Fu, H., Myers, A. D., Djorgovski, S. G., et al. 2015a, ApJ, 799, 72
- Fu et al. (2015b) Fu, H., Wrobel, J. M., Myers, A. D., Djorgovski, S. G., & Yan, L. 2015b, ApJ, 815, L6
- Fu et al. (2012) Fu, H., Yan, L., Myers, A. D., et al. 2012, ApJ, 745, 67
- Fu et al. (2011b) Fu, H., Zhang, Z.-Y., Assef, R. J., et al. 2011b, ApJ, 740, L44
- Gabányi et al. (2014) Gabányi, K. É., Frey, S., Xiao, T., et al. 2014, MNRAS, 443, 1509
- Heckman et al. (1984) Heckman, T. M., Miley, G. K., & Green, R. F. 1984, ApJ, 281, 525
- Heckman et al. (1981) Heckman, T. M., Miley, G. K., van Breugel, W. J. M., & Butcher, H. R. 1981, ApJ, 247, 403
- Helfand et al. (2015) Helfand, D. J., White, R. L., & Becker, R. H. 2015, ApJ, 801, 26
- Högbom (1979) Högbom, J. A. 1979, A&AS, 36, 173
- Hopkins et al. (2003) Hopkins, A. M., Miller, C. J., Nichol, R. C., et al. 2003, ApJ, 599, 971
- Hovatta et al. (2014) Hovatta, T., Aller, M. F., Aller, H. D., et al. 2014, AJ, 147, 143
- Howell et al. (2010) Howell, J. H., Armus, L., Mazzarella, J. M., et al. 2010, ApJ, 715, 572
- Hudson et al. (2006) Hudson, D. S., Reiprich, T. H., Clarke, T. E., & Sarazin, C. L. 2006, A&A, 453, 433
- Junkkarinen et al. (2001) Junkkarinen, V., Shields, G. A., Beaver, E. A., et al. 2001, ApJ, 549, L155
- Kewley et al. (2000) Kewley, L. J., Heisler, C. A., Dopita, M. A., et al. 2000, ApJ, 530, 704
- Kharb et al. (2015) Kharb, P., Das, M., Paragi, Z., Subramanian, S., & Chitta, L. P. 2015, ApJ, 799, 161
- Komossa (2006) Komossa, S. 2006, Mem. Soc. Astron. Italiana, 77, 733
- Komossa et al. (2003) Komossa, S., Burwitz, V., Hasinger, G., et al. 2003, ApJ, 582, L15
- Komossa & Zensus (2016) Komossa, S., & Zensus, J. A. 2016, in IAU Symposium, Vol. 312, IAU Symposium, ed. Y. Meiron, S. Li, F.-K. Liu, & R. Spurzem, 13–25
- Kormendy & Richstone (1995) Kormendy, J., & Richstone, D. 1995, ARA&A, 33, 581
- Koss et al. (2012) Koss, M., Mushotzky, R., Treister, E., et al. 2012, ApJ, 746, L22
- Koss et al. (2011) —. 2011, ApJ, 735, L42
- Lantz et al. (2004) Lantz, B., Aldering, G., Antilogus, P., et al. 2004, in Society of Photo-Optical Instrumentation Engineers (SPIE) Conference Series, Vol. 5249, Optical Design and Engineering, ed. L. Mazuray, P. J. Rogers, & R. Wartmann, 146
- Liu et al. (2013) Liu, X., Civano, F., Shen, Y., et al. 2013, ApJ, 762, 110
- Liu et al. (2010) Liu, X., Shen, Y., Strauss, M. A., & Greene, J. E. 2010, ApJ, 708, 427
- Mazzarella et al. (2012) Mazzarella, J. M., Iwasawa, K., Vavilkin, T., et al. 2012, AJ, 144, 125
- McGurk et al. (2015) McGurk, R. C., Max, C. E., Medling, A. M., Shields, G. A., & Comerford, J. M. 2015, ApJ, 811, 14
- Merritt (2013) Merritt, D. 2013, Dynamics and Evolution of Galactic Nuclei (Princeton: Princeton University Press)
- Merritt & Milosavljević (2005) Merritt, D., & Milosavljević, M. 2005, Living Reviews in Relativity, 8, 8
- Middelberg et al. (2011) Middelberg, E., Deller, A., Morgan, J., et al. 2011, A&A, 526, A74
- Müller-Sánchez et al. (2015) Müller-Sánchez, F., Comerford, J. M., Nevin, R., et al. 2015, ApJ, 813, 103
- Panessa & Giroletti (2013) Panessa, F., & Giroletti, M. 2013, MNRAS, 432, 1138
- Paragi et al. (2015) Paragi, Z., Godfrey, L., Reynolds, C., et al. 2015, Proceedings of Science, PoS(ASKAA14), 143
- Readhead (1994) Readhead, A. C. S. 1994, ApJ, 426, 51
- Rodriguez et al. (2006) Rodriguez, C., Taylor, G. B., Zavala, R. T., et al. 2006, ApJ, 646, 49
- Shen et al. (2011) Shen, Y., Liu, X., Greene, J. E., & Strauss, M. A. 2011, ApJ, 735, 48
- Shepherd et al. (1994) Shepherd, M. C., Pearson, T. J., & Taylor, G. B. 1994, in BAAS, Vol. 26, 987
- Smith et al. (2010) Smith, K. L., Shields, G. A., Bonning, E. W., et al. 2010, ApJ, 716, 866
- Springel et al. (2005) Springel, V., White, S. D. M., Jenkins, A., et al. 2005, Nature, 435, 629
- Tingay & Wayth (2011) Tingay, S. J., & Wayth, R. B. 2011, AJ, 141, 174
- Van Wassenhove et al. (2012) Van Wassenhove, S., Volonteri, M., Mayer, L., et al. 2012, ApJ, 748, L7
- Volonteri et al. (2015) Volonteri, M., Bogdanovic, T., Dotti, M., & Colpi, M. 2015, in Astronomy in Focus, Proceedings of The Gravitational Wave Symphony of Structure Formation, XXIXth IAU General Assembly, arXiv:1509.09027 to be published
- Walker (2014) Walker, R. C. 2014, VLBA Scientific Memo, 37
- Wang et al. (2009) Wang, J.-M., Chen, Y.-M., Hu, C., et al. 2009, ApJ, 705, L76
- Wizinowich et al. (2006) Wizinowich, P. L., Le Mignant, D., Bouchez, A. H., et al. 2006, PASP, 118, 297
- Wright (2006) Wright, E. L. 2006, PASP, 118, 1711
- Wrobel (1995) Wrobel, J. M. 1995, in Astronomical Society of the Pacific Conference Series, Vol. 82, Very Long Baseline Interferometry and the VLBA, ed. J. A. Zensus, P. J. Diamond, & P. J. Napier, 411
- Xu & Komossa (2009) Xu, D., & Komossa, S. 2009, ApJ, 705, L20
- Yun et al. (2001) Yun, M. S., Reddy, N. A., & Condon, J. J. 2001, ApJ, 554, 803
- Zhou et al. (2004) Zhou, H., Wang, T., Zhang, X., Dong, X., & Li, C. 2004, ApJ, 604, L33