11email: g.quintana@icmm.csic.es,jose.cenicharo@icmm.csic.es 22institutetext: Observatorio Astronómico Nacional (IGN), Ap 112, E–28803, Alcalá de Henares, Spain.
22email: v.bujarrabal@oan.es 33institutetext: Department of Astrophysics, Astrobiology Center (CSIC-INTA), Postal address: ESAC campus, P.O. Box 78, E-28691 Villanueva de la Cañada, Madrid, Spain.
33email: csanchez@cab.inta-csic.es 44institutetext: Institut de RadioAstronomie Millimétrique, 300 rue de la Piscine, 38406 Saint Martin d’Héres, France.
44email: ccarrizo@iram.fr 55institutetext: Observatorio Astronómico Nacional (IGN), Alfonso XII No3, 28014 Madrid, Spain.
55email: j.alcolea@oan.es
A 3 mm and 1 mm line survey toward the yellow hypergiant IRC +10420. ††thanks: Based on observations carried out with the IRAM 30 m Telescope. IRAM is supported by INSU/CNRS (France), MPG (Germany) and IGN (Spain)
Abstract
Aims. Our knowledge of the chemical properties of the circumstellar ejecta of the most massive evolved stars is particularly poor. We aim to study the chemical characteristics of the prototypical yellow hypergiant star, IRC +10420. For this purpose, we obtained full line surveys at 1 and 3 mm atmospheric windows.
Methods. We have identified 106 molecular emission lines from 22 molecular species. Approximately half of the molecules detected are N-bearing species, in particular HCN, HNC, CN, NO, NS, PN, and N2H+. We used rotational diagrams to derive the density and rotational temperature of the different molecular species detected. We introduced an iterative method that allows us to take moderate line opacities into account.
Results. We have found that IRC +10420 presents high abundances of the N-bearing molecules compared with O-rich evolved stars. This result supports the presence of a N-rich chemistry, expected for massive stars. Our analysis also suggests a decrease of the 12C/13C ratio from to in the last 3800 years, which can be directly related to the nitrogen enrichment observed. In addition, we found that SiO emission presents a significant intensity decrease for high- lines when compared with older observations. Radiative transfer modeling shows that this variation can be explained by a decrease in the infrared (IR) flux of the dust. The origin of this decrease might be an expansion of the dust shell or a lower stellar temperature due to the pulsation of the star.
Key Words.:
molecular processes – stars: circumstellar matter – radio lines: stars – stars: individual: IRC +104201 Introduction
IRC +10420 is a yellow hypergiant (YHG) star. These objects are evolved massive stars, which present extreme initial mases and very high luminosities ( 5.6, ). In fact, this particular YHG has a luminosity of and has an estimated initial mass of (Tiffany et al. 2010; Nieuwenhuijzen & de Jager 2000).
Yellow hypergiants are post red-supergiant stars (RSGs) evolving toward higher temperatures in the HR diagram. In particular, the spectral type of IRC +10420 has changed from F8Ia to A5Ia in just 20 yr (Klochkova et al. 1997). These objects are thought to lose as much as one half of their initial masses during the RSG phase (e.g., Maeder & Meynet 1988). In addition, during their post-RSG evolution the YHGs encounter an instability region, called the yellow void (de Jager 1998), which results in a new episode of effective mass ejection. These outburst were recently detected for Cas (Lobel et al. 2003). As a result of these outbursts, the ionized wind of these stars becomes optically thick and the resultant stellar wind spectrum mimics that of a lower star (Humphreys et al. 2002). As the ejected material dilutes into the interstellar medium (ISM), the apparent increases again. These apparent oscillations are frequently called bouncing against the yellow void. Since the real continues increasing, at a certain moment, as the ejected material dilutes out, the YHG stars would eventually appear at the just beyond the high-temperature edge of the yellow void. However, Smith et al. (2004) found that the high-temperature edge of the yellow void is coincident with the S Doradus instability strip. These sources then form a pseudophotosphere that keeps the source in the low-temperature edge of the yellow void in the HR diagram. Therefore, these authors suggested that the evolution of the YHGs remain hidden until they become slash stars and finally enter in the Wolf-Rayet phase.
While these mass ejections are predicted to be very important for these objects, only three YHGs, IRC+ 10420 and AFGL 2343 (Castro-Carrizo et al. 2007), and recently IRAS 17163–3907 (Wallström et al. 2015), have shown molecular emission.
The kinematics and structure of the molecular envelopes around IRC+ 10420 and AFGL 2343 were studied in detail by Castro-Carrizo et al. (2007) thanks to high angular resolution interferometric maps of 12CO. They found that, while these objects showed slight departures from the spherical symmetry, the data could be reasonably modeled by adopting an isotropic mass loss with large variations with time. In particular, for the YHG IRC+ 10420 they found a detached circumstellar envelope (CSE) with an extent of cm expanding at velocities of 37 km/s. Two strong mass ejection episodes, which occurred within a lapse of 1200 years and reached a mass loss rate of 3 yr-1, are responsible for the formation of this CSE. The total mass derived for the CSE around this object is . Quintana-Lacaci (2008) showed that the ejection of this material could be explained in a similar way as the ejections presented by the low mass AGB stars (i.e., the mass ejection is driven by radiation pressure on the dust grains). Also, Quintana-Lacaci (2008) argued that all the molecular material observed by Castro-Carrizo et al. (2007) was only ejected during the YHG phase. Any gas ejected during the previous RGS phase should have been rapidly diluted in the ISM and photodissociated by ISM ultraviolet (UV) radiation field.
The chemistry of IRC +10420 is particularly rich (Quintana-Lacaci et al. 2007). The following species were detected in the CSE around this object: CO, 13CO, HCN, CN, H13CN, SiO, 29SiO, SO, SiS, HCO+, CN, HNC, HN13C, and CS. Surprisingly, some species, such as HCN and HNC, showed particularly high abundances compared with the O-rich AGB stars, which are the low mass counterpart of YHGs (see, e.g., Bujarrabal et al. 1994). This is explained by an enrichment in nitrogen due to the hot bottom burning process (Boothroyd et al. 1993), which is present for stars with masses above 3 . This process transforms 12C into nitrogen, which changes the composition of the material that is transported to the photosphere and later on expelled. The nitrogen enrichment is expected to lead to a N-rich chemistry for the most massive and evolved stars. This was recently confirmed by Quintana-Lacaci et al. (2013). These authors found an abnormally high abundance of NO in IRC +10420, directly related to an enhancement of the elemental abundance of nitrogen.
On the other hand, SiO emission was found to come from regions located at 1017 cm from the star, far from the radius where dust formation takes place and where the SiO is expected to be largely depleted in the gas (Castro-Carrizo et al. 2001). These authors suggested that this SiO emission is related to a spherical shock front that heats up the grains, releasing some amount of Si back to the gas phase.
Recently, Teyssier et al. (2012) observed selected transitions of NH3, OH, H2O, CO, and 13CO toward this object with HIFI. They also showed that the model derived by Castro-Carrizo et al. (2007) for low- CO transitions was applicable, with minor changes, to high excitation lines.
In this paper we present a full line survey of IRC +10420 obtained with the IRAM 30 m telescope in the atmospheric windows centered at wavelengths of 1 mm and 3 mm. The survey confirms that the chemistry of this object is particularly rich. We detected 22 molecular species for which we determined the column density and rotational temperature.
2 Observations
We used the IRAM 30 m radiotelescope to obtain a complete line survey at 3 mm and 1 mm for the YHG IRC +10420. We observed IRC +10420 at the position coordinates (J2000) 19h26m48.s10, +11o21′17.′′0 with an = 76 km/s. The observations were obtained during February 2012. We used the EMIR receiver, simultaneously using the receivers E090 and E230 with a bandwidth of 4 GHz at two polarizations. We used 16 different setups to cover the atmospheric windows at 3 mm and 1 mm. Each setup was observed for one hour. We used the wobbler switching mode to minimize the ripples in the baselines. The system temperatures during the observations were in the range 100–250 K for the E090 receiver and between 200 and 425 K for the E230 receiver. The weather conditions during the observations were good with an amount of precipitable water vapor ranging between 2 and 6 mm.
The backends used were WILMA (spectral resolution 2 MHz) and the 4 MHz filter bank. Owing to the large width of the line profiles observed in IRC +10420 (60 km/s), this resolution is enough to resolve the line profiles.
The pointing correction was checked frequently and, therefore, we expect pointing errors of 3”. The telescope beam size at 3 mm is 21–29′′ and 9–13′′ at 1 mm. The Atmospheric Transmission Model (ATM) is adopted at the IRAM 30 m (Cernicharo 1985; Pardo et al. 2001). The data presented is calibrated in antenna temperature (). The calibration error is expected to be 10% at 3 mm and 30% at 1 mm. The data were processed using the GILDAS package111See URL http://www.iram.fr/IRAMFR/GILDAS/. The baselines were subtracted using only first grade polynomials.
3 Line identification
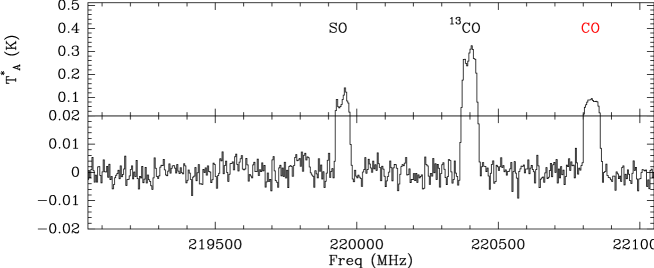
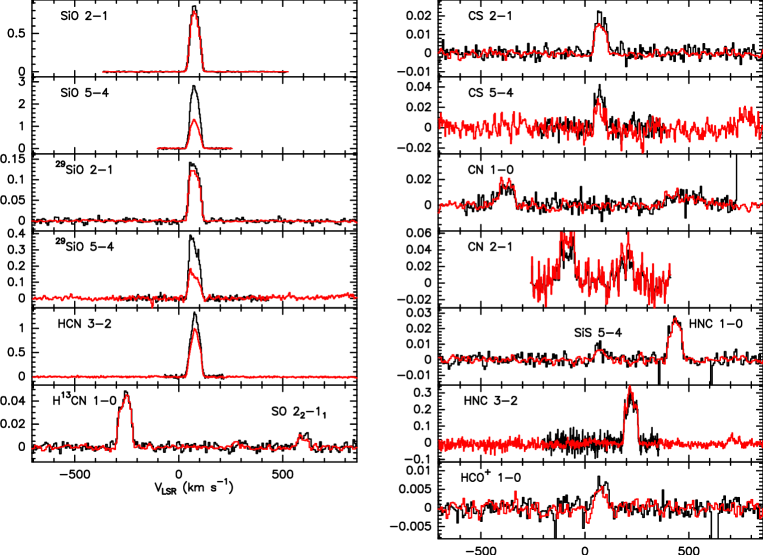
The full spectra obtained at 3 and 1 mm are presented in Figs.10&20. The sideband rejection of the EMIR receiver is higher than 10 db and therefore only the strongest lines present their counterparts in the image band. The spectral features whose origin is the image band are labeled in red characters in Figs. 10&20.
The line identification was performed using the online catalogs of CDMS222http://www.astro.uni-koeln.de/cdms/catalog (Müller et al. 2005), JPL333http://spec.jpl.nasa.gov/ (Pickett et al. 1998), Splatalogue444http://www.splatalogue.net/, and the catalog incorporated into the radiative transfer code MADEX (Cernicharo 2012).
In Tables A.1&A.2, we list all the lines detected in the line survey in the 3 mm and 1 mm bands, respectively. In these tables we also present the velocity-integrated intensity of the lines, the peak intensity and the rms of the noise level for a spectral resolution of 2 MHz. As a result of the large width of the lines of IRC +10420 , the hyperfine structure of the transitions of CN, NO, and NS cannot be resolved. For these transitions we present the global integrated intensity including all hyperfine components.
Thanks to the large frequency coverage of the spectral survey, we were able to confirm the presence of the species detected by inspecting their relative strengths expected for local thermodynamic equilibrium (LTE) conditions.
We detected a total of 106 spectral lines, which we identified as arising from 22 species including different isotopologues. The list of the species detected can be found in Table 1.
| Molecule | Isotopologues | Molecule | isotopologues |
|---|---|---|---|
| CO | 13CO | HCN | H13CN |
| SiO | 29SiO, 30SiO,Si18O | HNC | HN13C |
| SiS | CH3OH | ||
| SO | 34SO | CN | |
| SO2 | PN | ||
| CS | NO | ||
| HCO+ | NS | ||
| N2H+ |
4 LTE modeling of the line emission.
Once we successfully identified the emission lines observed, we aimed to estimate the physical conditions of the regions where these species are located.
In order to estimate the excitation temperatures and column densities of the different species observed we used a LTE approach as that described by Goldsmith & Langer (1999). These authors showed that the rotational diagram of a certain molecule follows the next relationship.
| (1) |
where and are the total column density and statistical weight of the upper level, respectively, is the total column density, is the rotational temperature, is the partition function, is the energy of the upper level, and is the term that takes the opacity effects into account, which corresponds to . The value of is directly proportional to the integrated intensity of the molecular line observed (Goldsmith & Langer 1999).
Here we use the opacity-corrected column density . Therefore, relation (1) can be rewritten as
| (2) |
This relationship allows us to estimate and of a molecule by fitting a straight line to the rotational diagram.
As an approximation for the opacity, we use that presented by Quintana-Lacaci et al. (2007),
| (3) |
where is the peak temperature in main beam temperature scale, is the source function, and is the geometrical dilution factor between source size and telescope main beam. We adopt the source size from Quintana-Lacaci et al. (2007), i.e., an angular radius of 11.′′0 for 12CO and 13CO, and 3.′′3 for the rest of the molecular species. We also took this beam dilution correction into account in the calculation of , in particular by correcting the integrated intensity of each molecular transition. The source function is calculated as follows:
| (4) |
where is the excitation temperature and is the temperature of the cosmic background.
The term is different for each rotational transition and depends on via the source function. As a result of this, cannot be directly obtained by fitting a straight line to equation (1). In order to solve this problem, we used an iterative procedure. We introduce an initial rotational temperature in the opacity term (1000 K) and fit to the expression in Eq. (1). The value of obtained is then introduced as the new temperature to compute the opacity corrections. This process was repeated until the difference between the temperature introduced in the opacity term and that derived was below a certain tolerance (0.1 K). At K, the opacity term is in general negligible at the frequencies covered by the surveys presented and . In that sense, assuming an initial rotational temperature of 1000 K for the calculation of the opacity is equal to assume . An example of the effect of the opacity correction on the rotational diagram is shown in Fig. 1.
The opacity correction applied can only account for moderate values of the optical depth. For high opacities the line emission we detect comes only from the outer layers of the circumstellar envelope. Because of this, we impose a higher limit to the opacity of .
Furthermore, in case the opacity is remarkably high, and if there is a large opacity variation for the different transitions, the method fails to obtain estimates of . As shown by Goldsmith & Langer (1999), when the opacity is high, the rotational diagram given by eq. (1) deviates from the straight line expected for low opacities.The optical depth of the transition does not vary proportionally to the energy of the transition. These authors showed that for linear molecules in LTE conditions the of the transition with the maximum opacity is at a frequency of . Therefore, depending on the of the gas and of the transitions observed, the opacity effects could lead to both higher or lower slopes for the fitting than that expected for low opacities. Only in those cases in which we can estimate the of the gas where a particular emission arises by any other method, as deriving it from fitting the rotational diagrams of low-abundance isotopologues, can we obtain a limit to the column density of a given molecule. This can be accomplished for instance by ignoring those lines available with frequencies closer to .
In case we only observe two transitions, we can obtain a realistic derivation of the value of if the opacity from both lines is relatively low. If the optical depth significantly affects the intensity of the lines, however, we could only obtain a first approximation to the value of assuming optically thin emission.
We use the molecular distribution of the two shells described by Castro-Carrizo et al. (2007). As mentioned, in a similar approach as Quintana-Lacaci et al. (2007), we assume that the molecular emission from all molecules but those of CO and 13CO come from the inner shell. In particular, the diameter of the emitting region would be 11′′ for CO and 13CO and 3.′′3 for the rest of the molecules.
4.1 Column density and rotational temperature determination
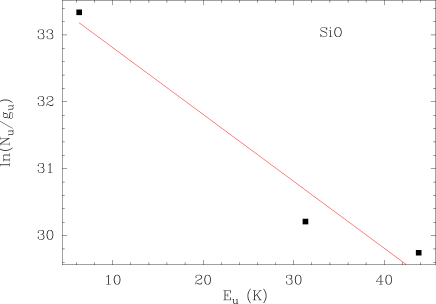
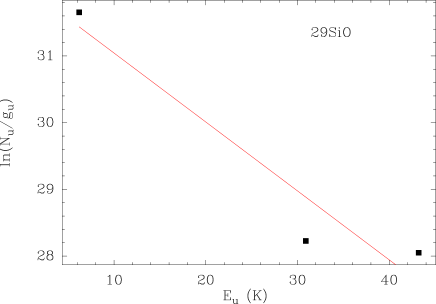
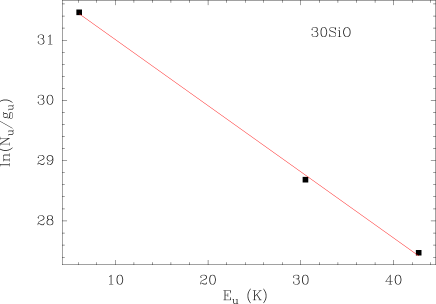
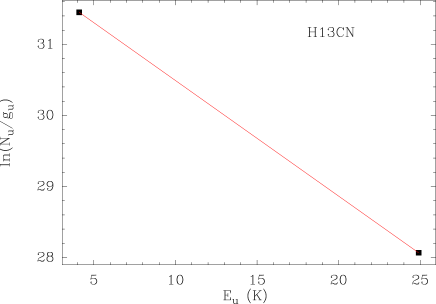
As expected, the method described above is not well suited for certain molecules because of the high opacity of some of their transitions. These molecules are HCN, H13CN, SiO, 29SiO, and 30SiO.
In the particular cases of SiO and their isotopologues, the origin of the emission of these molecules was claimed to be related to the presence of a shock front (Castro-Carrizo et al. 2001). However, recently Teyssier et al. (2012) were not able to detect high- lines with HIFI. In addition, no vibrationally excited lines were detected in the current survey. This shows that the excitation temperature of the SiO emission is not be particularly high. Since we cannot estimate the kinetic temperature of the gas where this emission arises, we cannot rely on the method proposed to derive the abundance and excitation temperature of this molecule, but just to constrain these values. We assumed that the emission is optically thin to obtain a lower limit to the abundance. Also, since only two lines were detected for the rest of the molecules, which presented opacity effects that avoided the convergence of the procedure described above (HCN, H13CN), we also assumed that their emission is optically thin.

For those molecules for which only a single line was observed, we had to impose a certain value of to estimate the column density. In case the molecule has an isotopologue for which we could determine the , we assumed the same value for both isotopologues. In the rest of the cases, the value of was imposed to be the mean value obtained for all the molecules located in the same region of the envelope, assuming the molecule distribution proposed by Quintana-Lacaci et al. (2007). As mentioned above, we assume that the emission from all molecules but 12CO and 13CO arises from the inner shell observed by Castro-Carrizo et al. (2007). We found that for this inner inner shell. The column density for these molecules was obtained by modeling the observed spectra assuming LTE conditions with the radiative transfer code MADEX.
In the case lines with hyperfine structures (CN, NO, and NS), we used the LTE approach instead of the rotational diagram analysis in MADEX to reproduce the observed profiles. Since MADEX computes the line opacity, we were able to estimate whether the column densities obtained are a lower limit to the value of .
We also confirmed that the results obtained for the column density and using the rotational diagrams were compatible with the results derived adopting the LTE approximation within the MADEX code. In the particular case of HCO+, although only one line was detected, we could estimate a lower limit to the column density and an upper limit to the rotational temperature thanks to an upper limit to the intensity of the transition, lying at 267.557 GHz.
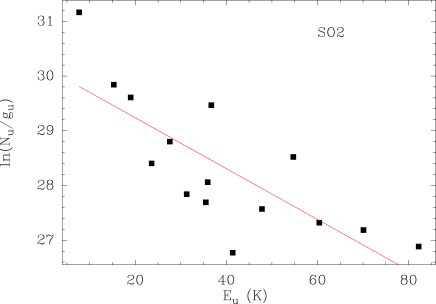
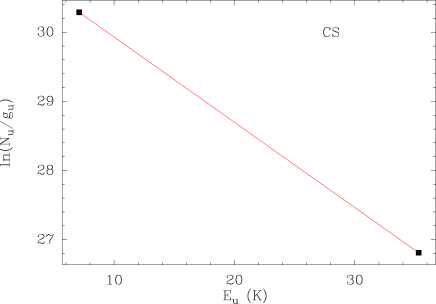
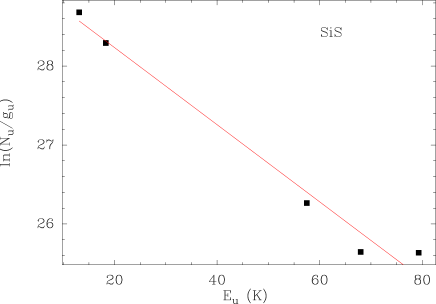
The rotational diagrams are presented in Fig. 21 for those species for which we estimated the opacity and in Fig. 22 for those molecules for which we assumed an optically thin regime. The and results obtained are presented in Table 2. In this table, the error of the column density is only presented for those species with more that two transitions detected and for which the opacity has not been imposed by a certain value. For the species with only two transitions detected, the error derived is unrealistically low, as the only source of error in the fitting of the two points by a line is the error in the intensity of the line, which in general was very low. The species, as SiS or SO, for which a larger number of species were observed, present more realistic errors and therefore they are prompted in the table. We used MADEX to generate synthetic spectra with the parameters presented in table 2 to produce a global estimate of the error in the abundance determination for the rest of the species. The uncertainty in the determination of the abundance was found to be on average 15%.
| Molecule | (cm-2) | (K) | N. Obs. Line | Comment | |
|---|---|---|---|---|---|
| CO | 2 | ||||
| 13CO | 2 | ||||
| SiO | 3 | ∗ | |||
| 29SiO | 3 | ∗ | |||
| 30SiO | 3 | ∗ | |||
| Si18O | 1 | ||||
| HCN | 2 | ∗ | |||
| H13CN | 2 | ∗ | |||
| HNC | 2 | ||||
| HN13C | 1 | ||||
| CN | 2 | ||||
| CS | 2 | ||||
| PN | 2 | ||||
| NO | 1 | ||||
| NS | 4 | ||||
| SiS | 5 | ||||
| SO | 9 | ||||
| 34SO | 1 | ||||
| SO2 | 14 | ||||
| HCO+ | 2 | ||||
| N2H+ | 1 | ||||
| CH3OH | 2 |
5 Results
The results obtained for the column density in the previous section allow us to understand the characteristics of the chemical processes occurring in the CSE around the massive evolved star IRC +10420 in greater detail. To obtain the fractional abundance of each molecule relative to H2, , we adopted the density profile presented by Castro-Carrizo et al. (2007). This density profile allows us to calculate the column density of H2 at each region of the shell and, therefore, to determine the fractional abundance of each molecule as . These fractional abundances are also shown in Table 2.
We discuss the results for the species detected separately.
5.1 12CO and 13CO
In their work, Castro-Carrizo et al. (2007) assumed that to derive the H2 density profile of the envelope around IRC +10420 , the fractional abundance of 12CO in IRC +10420 was the standard abundance found for AGB stars, i.e., . From this assumption, these authors derived the amount of mass ejected by the star. Since we used the density profiles obtained by these authors, we expected to find similar values for the fractional abundance of 12CO to those assumed by Castro-Carrizo et al. (2007). In fact, the ratio between both 12CO abundances is , which is higher than that derived in this work. The LVG modeling approach carried out by Castro-Carrizo et al. (2007) estimates the excitation more accurately than the LTE approach. This factor provides an estimate of the error expected by the method used in this work, compared with more accurate radiative transfer models.
The 12CO abundance derived here is similar to that obtained toward the RSG VY CMa by Ziurys et al. (2009) for the red flow, while those abundances obtained by these authors for the spherical flow and blue flow are lower.
Even though the 12CO abundance is somehow fixed, and since the opacity effects do not critically affect the density fitting of both 12CO and 13CO, we can estimate the 12C/13C ratio. It is found to be 7, which is slightly below the range found by Milam et al. (2009) for O-rich evolved stars (12C/13C ). This was expected in any case, as the hot bottom burning process transforms 12C in 14N in massive stars as IRC +10420 .
5.2 CN, HCN, and HNC
The fractional abundance obtained for CN in this object is . This abundance is high compared with O-rich evolved stars (), as already noticed by Bachiller et al. (1997). This value is 3.4 times higher than that derived in Quintana-Lacaci et al. (2007). In that work we used an approximation to simplify the hyperfine structure of CN to a simple structure of two Hund rotational levels without hyperfine structure. This approximation is only reasonable for optically thin emissions, however, the approach presented in the current work reveals that the hyperfine transitions present moderate opacities. Therefore, in this particular case, the most accurate approach to estimate the abundance and rotational temperature of CN is that presented in this work, i.e., generating a synthetic spectra to fit the different hyperfine lines.
Since the formation of CN is mainly produced by the photodissociation of HCN and HNC due to UV radiation, a high CN value is expected for those objects presenting a hot central star surrounded by very diluted material, as in the proto-PN phase. While this could be the case for the yellow hypergiant IRC +10420, the ratio , which traces the UV field, is remarkably low ( 0.12). In addition, Alcolea et al. (2013) found a weak emission of HCN = 13–12, which reveals that HCN is not highly excited in this CSE.
The photodissociation of HCN in IRC +10420 might not be very effective because of the high density of the ejected material ( cm-3, Castro-Carrizo et al. 2007). The reason for the high abundance of CN, as well as for that of HCN, is most probable an enhanced nitrogen abundance in the photosphere of the star (see below).
In contrast, the fractional abundance obtained for HNC is . The opacities obtained for the HNC lines are relatively low (0.2 for HNC and 0.5 for HNC ) and, therefore, the abundance obtained is probably a good approximation to reality. This value is slightly higher than the mean values obtained for the O-rich AGB stars (Bujarrabal et al. 1994, ).
The 12C/13C ratio derived from the abundances obtained for HNC and its 13C isotopologue is 3.6. As mentioned in Sect. 5.1., this ratio is remarkably low compared with the standard value found for the AGB stars, which is consistent with the low value deduced from CO (Sect. 5.1).
It is also particularly relevant to compare these abundances with those of the RSG VY CMa, as IRC +10420 is expected to be a post-RSG object. The lower limit for the HCN abundance found for IRC +10420 is similar to the lowest value found for VY CMa (Ziurys et al. 2009). Also, the HNC abundances found are similar for both objects. On the contrary, the abundance found for CN by these authors is 72 times lower in VY CMa than in IRC +10420. This is most probably a sign of the nitrogen enrichment of the photosphere of the star along its RSG – post-RSG evolution.
5.3 Si-bearing species
The presence of SiO in most of the evolved stars (AGBs, RSGs, and YHGs) is believed to be restricted to the inner layers of the circumstellar envelopes where the dust is being formed (see, e.g., Lucas et al. 1992). The refractory materials, such as silicon, are rapidly attached to the grains that are formed and removed from the gas.
Castro-Carrizo et al. (2007) showed that the amount of molecular gas in the inner regions of the circumstellar envelope around IRC +10420 , where the SiO emission would be expected to arise, is negligible. Because of this, in principle, the anticipated intensity of the Si-rich lines would be low. Despite this, theses species are particularly abundant in IRC +10420 .
In IRC +10420 the SiO emission was found to come from a shell located at cm (Castro-Carrizo et al. 2001). Because of the large distance from the star where SiO emission is located, these authors suggested that SiO emission is actually tracing a shocked region, where the dust grains have been heated, evaporating part of the silicon attached to them.
In their study of the molecular emission of IK Tau Gobrecht et al. (2016) found that while both SiS and SiO are destroyed by the shock, SiS molecules are reformed in the post-shocked regions with the same abundance as before it is destroyed. This might indicate that both Si-bearing species can be located in different regions of the ejecta of the evolved stars.
The lines observed of SiO and its isotopologues are optically thick, as shown by Quintana-Lacaci et al. (2007). Therefore, the values obtained for the column densities are lower limits. The LTE approximation is not an accurate option for SiO to determine the physical conditions of the region where this molecule is located. Solving the radiative transfer equations using an LVG approximation would be a better option (see Sect. 6.1). On the contrary, the SiS emission is only affected by small opacity effects.
While, as already mentioned, the origin of both SiO and SiS emission is different in the AGB stars and in IRC +10420 a comparison of the abundance ratio between both Si-bearing molecules from an O-rich evolved star and IRC +10420 gives a similar result of . At the distances from the star at which Castro-Carrizo et al. (2001) found the SiO shell, the reaccretion of the SiO in the grains would be extremely slow because of the dust dilution lasting hundreds of years. Therefore, once these molecules evaporated from the grains, the SiO/SiS abundance ratio would be expected to be similar to that found in the innermost layers of the star.
5.4 Cations: N2H+ and HCO+.
The formation of these two cations is strongly coupled to the cosmic-ray ionization rate of H2 () via the cation H. Chemical modeling calculations similar to those carried out by Quintana-Lacaci et al. (2013) and Sánchez Contreras et al. (2015) indicate that at the low edge of the range of values of in the Galaxy (10-17–10-15 s-1; Dalgarno 2006), the formation of HCO+ in O-rich envelopes is dominated by the reactions
| (5) |
| (6) |
where CO+ is formed by the reaction between C+ and OH. At high values of , HCO+ is mainly formed by the reaction
| (7) |
where H is formed in the reaction between H2 and H, where the latter is produced by the cosmic-ray ionization of H2. In contrast, the main formation route to N2H+, independent of the value of , is the reaction
| (8) |
These chemical calculations indicate that in IRC +10420, where there is an important nitrogen enhancement (Quintana-Lacaci et al. 2013), HCO+ should be much more abundant than N2H+ if is on the order of 10-17 s-1, while if it is approximately 10-15 s-1 both cations could reach comparable abundances. A high ionization rate could be driven by cosmic rays but also by soft X-rays emitted by the central stars. In fact, Zhang et al. (2008) found that the abundance of N2H+ in the planetary nebulae NGC 7027 was abnormally high compared with the rest of evolved stars, and this abundance was related to its particularly strong X-ray field. In addition to this, HCO+ can also be formed in the presence of an ionizing shock front by reactions (5) and (6), as found by Rawlings et al. (2004).
In the case of IRC +10420 we find a lower limit for the abundance of HCO+ of . This lower limit for the abundance corresponds to the upper limit obtained for the HCO+ transition. In contrast, the abundance derived for N2H+ is . The abundance ratio is . This value is very high compared with NGC 7027, where (Zhang et al. 2008). In fact, the N2H+ abundance derived in IRC +10420 is the second highest value found in an evolved star. The highest fractional abundance has been found for the extreme massive star Eta Carinae (; Loinard et al. 2012).
The high N2H+/HCO+ abundance ratio found in IRC +10420 points to a high ionization rate driven by cosmic rays or X-rays, although shocks could also be at the origin of these two molecules. In the first hypothesis, the formation of both cations would be chemically coupled, as H would participate in both cases, and we could expect a similar emission distribution for HCO+ and N2H+. Whether the main ionization mechanism is cosmic rays or X-rays is difficult to say. Recently, De Becker et al. (2014) did not detect X-rays in IRC +10420 using the XMM-Newton Space telescope. This does not necessarily imply that X-rays are not an important ionizing source in this object as they could be obscured to a large extent by the massive envelope. In the second hypothesis, the emission of these two cations would tend to follow that of other molecules such as SiO, whose emission in IRC +10420 probably related to a shock front (Castro-Carrizo et al. 2001). Additional single-dish observations of N2H+, in particular and , would allow us to determine the temperature of gas traced by N2H+ and, therefore,,accurately disentangle its origin. If the N2H+ emission is a consequence of the interaction of X-rays on the innermost regions of the ejected material the kinetic temperature of the gas traced by this molecule should be high, while the temperature should be low if its origin were the interaction of the cosmic rays with gas at the outer regions of the envelope .
In any case, the particularly high abundance of N2H+ found for IRC +10420 corresponds directly to a high abundance of N2.
5.5 CH3OH
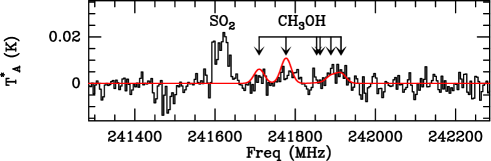
We have identified two lines of CH3OH. The number of molecular transitions of this molecule that fall within the observed ranges is relatively large (35 lines with excitation temperatures above 500 K in the 3 mm and 47 in the 1 mm band).
In order to confirm that the two lines actually correspond to CH3OH, we used the column density and rotational temperature derived from the rotational diagrams to produce a synthetic spectra with the MADEX code, assuming LTE conditions, to reproduce the intensity of the rest of the nondetected CH3OH lines from the column density and temperature obtained from the rotational diagram.
We found that all the remaining lines either present an intensity that prevented their detection or are blended with other more intense lines. Furthermore, the model fits a feature at 241.8 GHz, which was not identified and was found to be related to the presence of several CH3OH lines in these region of the spectra (see Fig. 2). The identification of these lines confirm the presence of CH3OH in this object and the abundance and temperature derived for this molecule.
It has been suggested that the formation of CH3OH might take place in warm environments (Hartquist et al. 1995), such as the environment found in the CSE around IRC +10420.
5.6 N-rich chemistry
The most remarkable result of this survey is the detection of a wide number of N-bearing molecules. These molecules are HCN, HNC, PN, NS, NO, CN, and N2H+ plus some isotopologues. In addition to these molecules, Menten & Alcolea (1995) detected NH3.
Our abundance estimates revealed high abundances found for CN, HCN, HNC, and N2H+ when compared with O-rich evolved stars (see, e.g., Bujarrabal et al. 1994). In particular, IRC +10420 presents one of the highest N2H+ abundance found for an evolved star.
These facts could be explained by an enrichment in nitrogen due to the hot bottom burning process (HBB; Boothroyd et al. 1993) which, as mentioned, is present for stars with masses above 3 . For the most massive and evolved stars, the nitrogen enrichment is expected to lead to a N-rich chemistry. In addition, the 12C/13C isotopic ratio is therefore expected to be low, as has been found for IRC +10420 (see Sect. 5.1&5.2).
Recently, Quintana-Lacaci et al. (2013) has shown that to reproduce the NO profiles, the initial abundance of nitrogen in the photosphere of the star has to be significantly enhanced with respect to the standard values expected for the O-rich evolved stars, i.e., the enhancement expected as a result of the HBB is confirmed.
We obtained a lower limit to the column density of P15N to compare the 14N/15N isotopic ratio with that found for N-rich Nova CK Vul by Kamiński et al. (2015). The lower limit of the integrated intensity was calculated following Quintana-Lacaci et al. (2007). We choose this molecule as it does not present hyperfine transitions and since the PN emissions detected are optically thin. We found an upper limit for the integrated intensity K km s-1, which results in a column density of cm-2. The upper limit of the isotopic ratio so derived is 14N/15N 3. This low value is similar to the range found by Kamiński et al. (2015) for CK Vul (). Deeper integrations toward selected 15N-bearing molecules would allow us to confirm this ratio.
A paper devoted to a detailed study of the N-rich chemistry in IRC +10420 is under preparation.
6 Time variations of the SiO lines
The abundances we found for SiO and 29SiO are 9 and 4 times lower that those found by Quintana-Lacaci et al. (2007), respectively.
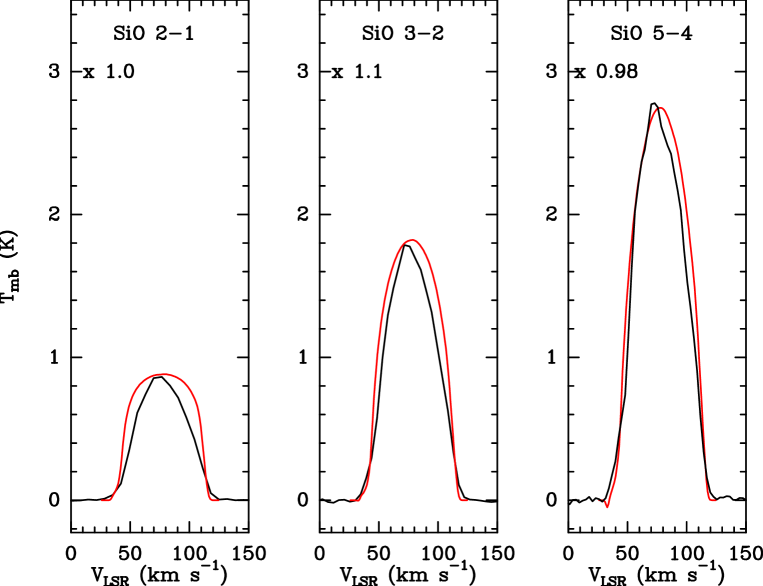
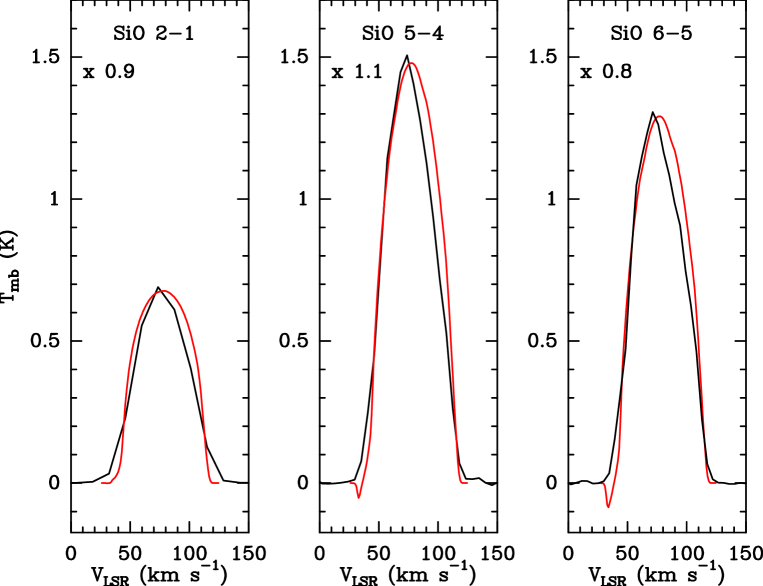
A careful comparison between the line profiles obtained by Quintana-Lacaci et al. (2007) and those presented here reveal that while the intensities of most of the molecular lines do not present significant changes, the =5–4 lines of SiO and 29SiO are much weaker (see Fig.3).
The yellow hypergiants are known to present large variations in their effective temperatures (Nieuwenhuijzen & de Jager 2000). These changes in their effective temperatures would result in a remarkable variations in the emission of certain lines due to the IR pumping. SiO lines are particularly affected by this effect. A decrease in the of IRC +10420 would result in a decrease of the SiO emission, especially for the high- lines.
A second possible explanation for the variation in the SiO line emission is that the silicon evaporated from the dust grains during the shock is reattached to the grains. However, as mentioned above, at the large distances where Castro-Carrizo et al. (2001) located the SiO emission, the re-absorption of SiO would last hundreds of years.
Nieuwenhuijzen & de Jager (2000) found that the of IRC +10420 showed an increase of 3000 K in the last 20 years, reaching a value of 8500 in 1997. These authors predicted the effective temperature of IRC +10420 to grow continuously in its evolution toward blue regions of the HR diagram. The decrease in the intensity of the high- lines can confirm this scenario, as the dust ejected during the last encounter with the yellow void dilutes into the ISM.
In order to obtain an accurate view of the properties of the SiO emission, we used an LVG approximation to model the lines observed. We adopted the extent of the SiO shell from Castro-Carrizo et al. (2001), the density profile from Castro-Carrizo et al. (2007), and the SED model from Dinh-V.-Trung et al. (2009). We found that we are unable to reproduce the SiO emission from IRC +10420 assuming the mass distribution derived by Castro-Carrizo et al. (2007).
Wong (2013) found a similar difficulty with the observed SiO = 1 – 0 VLA maps. This author suggested that the emission of SiO is located in clumps, which were ejected from localized regions of the photosphere of the star. Wong (2013) argue therefore that the properties of these clumps are not tied with the global mass ejection traced by CO. This author suggested a two-shell model to reproduce the SiO and emission maps. These maps consisted of a radial density law, cmcm)-0.7, and an abundance profile, which present two different regions with a constant SiO abundance: between cm and cm, and between cm and cm. As already mentioned, the IR emission from the star has an important impact on the intensities of the SiO lines via the infrared pumping. The emission from the star is obscured by the optically thick dust layers. To reproduce the infrared emission from the star, Wong (2013) assumed that the continuum source consisted in an optically thick shell of dust at 400 K and at a radius of 8 1015cm. This assumption was based on the flux observed at 8 by Jones et al. (1993) in March 1992. However, the IR flux from this object is known to vary and the low- SiO lines are less sensitive to this variation. Therefore, while Wong (2013) fitted the observations with a dust temperature of 400 K, a higher temperature could have also fitted the observations.
While the flux observed by Jones et al. (1993) at 8 is 1000 Jy, the flux observed with ISO in 2001 at this same wavelength is only Jy555Data obtained from the ISO data archive http://iso.esac.esa.int/ida/. In fact, Egan et al. (2003) showed that in 1997 the flux at 8.28 was 148.7 Jy. This confirms the large flux variations that this object has undergone. Therefore, Wong (2013) probably overestimated the 8 flux in their calculations of the abundance and temperature.
Taking into account these variations, we used the ISO observations from year 2001 to fit the SiO lines presented by Quintana-Lacaci et al. (2007) observed in year 2000. The flux of 350 Jy can be simulated, following Wong (2013), by a blackbody with a radius of 8 1015cm, and a temperature of 331 K. We also assumed the gas distribution of Wong (2013). Simultaneously we fitted the observations presented in the current work. We left as free parameter the IR flux from the star for the 2012 observations, and allowed minor modifications to the SiO fractional abundance of both regions suggested by Wong (2013).
We found that in order to fit the two sets of data, we needed to decrease the SiO fractional abundance in the inner region to 10-5. The temperature of the dust shell obtained for the new set of data is 200 K, which corresponds to a 8 flux of 8 Jy.
This reveals that an accurate knowledge on the variations of the IR flux of these objects is crucial to obtain realistic abundance estimates of species, such as SiO, whose emission is strongly correlated with the IR emission.
The YHGs are known to present two main pulsation periods (de Jager 1998). These consist of a short period of several hundred of days corresponding to a quiescent pulsation (Percy & Kim 2014; Le Coroller et al. 2003), and a larger period of tens of years in which these objects present a quasi-explosive mass ejection (de Jager 1998)
A detailed study on the flux variation of this object, as well as high angular resolution observations of the SiO distribution, are essential to understand the SiO emission observed in IRC +10420. Also, future SiO observations are fundamental to confirm whether the source of the IR variation is related to the expansion of the dust shell, which would result in a constant decrease of this flux, or to the quiescent pulsation or a new explosive mass ejection period, in case future observations present an increase of the SiO lines. The first scenario would support the idea that IRC +10420 is finally crossing the yellow void, while the latter would suggest that this object is undergoing a new encounter with the yellow void.
Future observations of the SiO emission lines, in addition to bolometric observations at 8 would allow us track this decrease in the IR flux from the dust and to better constrain the properties of the SiO emitting region. A new increase in the intensity of high- SiO emission lines could also be related to new mass ejections.
7 Conclusions
We have performed a full line survey in the atmospheric windows at 1 and 3 mm for the yellow hypergiant IRC +10420. We detected a total of 22 species. We have obtained LTE abundances for these species. These abundances showed a particularly high value of all N-bearing species compared with standard O-rich evolved stars. In particular, the abundance of N2H+ is found to be the second highest found for an evolved star. These results seem to confirm the nitrogen enrichment found by Quintana-Lacaci et al. (2013).
In addition to this, the isotopic 12C/13C ratio is particularly low (7–3.6, see Sects. 5.1&5.2). This difference cannot be explained by the errors in the fitting of the abundance (see Sect.4.1), therefore this variation in the isotopic ration seems to be genuine. Both effects are expected for massive stars in which hot bottom burning process takes place, transforming 12C into 14N.
Also, the nitrogen enrichment and the 13C/12C ratio increase with time as the hot bottom burning is active (Marigo 2007). The outer regions of the envelope, where only CO was detected, trace gas ejected between 1200 and 3000 years before the ejection of the innermost shell (Castro-Carrizo et al. 2007). Therefore we might expect a highest 12C/13C. The differences in the ratios derived from CO and HNC might be caused by opacity effects. However, for high opacities we might expect higher abundances of 12CO, and therefore a lower 12C/13C ratio. Most probably, the difference in the ratios found for both regions are due to the continuous effect of the HBB along the last 3800 years. High angular resolution maps of optically thin emission lines of 12C and 13C species could confirm this result.
High- SiO line intensities observed in this paper are remarkably low compared with the same transitions observed by Quintana-Lacaci et al. (2007), while the variation of the low- SiO lines observed is low. This variation was also observed in HCN and CS, while HNC, CN, SiS, and HCO+ line intensity have remained constant. The effective temperature of the star has a direct effect on the SiO emission via infrared pumping (see, e.g., Cernicharo et al. 2014). The SiO line intensity variation probably corresponds to a recent decrease in the IR flux emitted from the dust, which has a direct effect on the intensity of the SiO lines via infrared pumping. IRC +10420 has been claimed to be evolving blueward in the HR diagram crossing the yellow void, i.e., to present a constant increase in its . The changes in the intensity of the SiO lines revealed a decrease in IR flux from the dust around the star. Tracking the evolution of the IR flux of this object is important to determine its evolutionary status, i.e., if the source is actually crossing the yellow void or if it is undergoing a new mass ejection. Future SiO observations in combination with IR 8 observations would allow us to trace the temperature of the dust around evolved stars in particular around massive evolved stars, which will allow us to disentangle their evolutionary status and to constrain the properties of the SiO emitting region.
Acknowledgements.
The research leading to these results has received funding from the European Research Council under the European Union’s Seventh Framework Programme (FP/2007-2013) / ERC Grant Agreement n. 610256 (NANOCOSMOS). We would also like to thank the Spanish MINECO for funding support from grants CSD2009-00038, AYA2009-07304 & AYA2012-32032.References
- Alcolea et al. (2013) Alcolea, J., Bujarrabal, V., Planesas, P., et al. 2013, A&A, 559, A93
- Bachiller et al. (1997) Bachiller, R., Fuente, A., Bujarrabal, V., et al. 1997, A&A, 319, 235
- Boothroyd et al. (1993) Boothroyd, A. I., Sackmann, I.-J., & Ahern, S. C. 1993, ApJ, 416, 762
- Bujarrabal et al. (1994) Bujarrabal, V., Fuente, A., & Omont, A. 1994, A&A, 285, 247
- Castro-Carrizo et al. (2001) Castro-Carrizo, A., Lucas, R., Bujarrabal, V., Colomer, F., & Alcolea, J. 2001, A&A, 368, L34
- Castro-Carrizo et al. (2007) Castro-Carrizo, A., Quintana-Lacaci, G., Bujarrabal, V., Neri, R., & Alcolea, J. 2007, A&A, 465, 457
- Cernicharo (1985) Cernicharo, J. 1985, IRAM internal report No. 52
- Cernicharo (2012) Cernicharo, J. 2012, in ECLA-2011: Proceedings of the European Conference on Laboratory Astrophysics, European Astronomical Society Publications Series
- Cernicharo et al. (2014) Cernicharo, J., Teyssier, D., Quintana-Lacaci, G., et al. 2014, ApJ, 796, L21
- Dalgarno (2006) Dalgarno, A. 2006, Proceedings of the National Academy of Science, 103, 12269
- De Becker et al. (2014) De Becker, M., Hutsemékers, D., & Gosset, E. 2014, ArXiv e-prints
- de Jager (1998) de Jager, C. 1998, A&A Rev., 8, 145
- Dinh-V.-Trung et al. (2009) Dinh-V.-Trung, Muller, S., Lim, J., Kwok, S., & Muthu, C. 2009, ApJ, 697, 409
- Egan et al. (2003) Egan, M. P., Price, S. D., Kraemer, K. E., et al. 2003, VizieR Online Data Catalog, 5114, 0
- Gobrecht et al. (2016) Gobrecht, D., Cherchneff, I., Sarangi, A., Plane, J. M. C., & Bromley, S. T. 2016, A&A, 585, A6
- Goldsmith & Langer (1999) Goldsmith, P. F. & Langer, W. D. 1999, ApJ, 517, 209
- Hartquist et al. (1995) Hartquist, T. W., Menten, K. M., Lepp, S., & Dalgarno, A. 1995, MNRAS, 272, 184
- Humphreys et al. (2002) Humphreys, R. M., Davidson, K., & Smith, N. 2002, AJ, 124, 1026
- Jones et al. (1993) Jones, T. J., Humphreys, R. M., Gehrz, R. D., et al. 1993, ApJ, 411, 323
- Kamiński et al. (2015) Kamiński, T., Menten, K. M., Tylenda, R., et al. 2015, Nature, 520, 322
- Klochkova et al. (1997) Klochkova, V. G., Chentsov, E. L., & Panchuk, V. E. 1997, MNRAS, 292, 19
- Le Coroller et al. (2003) Le Coroller, H., Lèbre, A., Gillet, D., & Chapellier, E. 2003, A&A, 400, 613
- Lobel et al. (2003) Lobel, A., Dupree, A. K., Stefanik, R. P., et al. 2003, ApJ, 583, 923
- Loinard et al. (2012) Loinard, L., Menten, K. M., Güsten, R., Zapata, L. A., & Rodríguez, L. F. 2012, ApJ, 749, L4
- Lucas et al. (1992) Lucas, R., Bujarrabal, V., Guilloteau, S., et al. 1992, A&A, 262, 491
- Maeder & Meynet (1988) Maeder, A. & Meynet, G. 1988, A&AS, 76, 411
- Marigo (2007) Marigo, P. 2007, A&A, 467, 1139
- Menten & Alcolea (1995) Menten, K. M. & Alcolea, J. 1995, ApJ, 448, 416
- Milam et al. (2009) Milam, S. N., Woolf, N. J., & Ziurys, L. M. 2009, ApJ, 690, 837
- Müller et al. (2005) Müller, H. S. P., Schlöder, F., Stutzki, J., & Winnewisser, G. 2005, Journal of Molecular Structure, 742, 215
- Nieuwenhuijzen & de Jager (2000) Nieuwenhuijzen, H. & de Jager, C. 2000, A&A, 353, 163
- Pardo et al. (2001) Pardo, J. R., Cernicharo, J., & Serabyn, E. 2001, IEEE Trans. on Antennas and Propagation, 49/12, 1683
- Percy & Kim (2014) Percy, J. R. & Kim, R. Y. H. 2014, Journal of the American Association of Variable Star Observers (JAAVSO), 42, 267
- Pickett et al. (1998) Pickett, H. M., Poynter, R. L., Cohen, E. A., et al. 1998, J. Quant. Spec. Radiat. Transf., 60, 883
- Quintana-Lacaci (2008) Quintana-Lacaci, G. 2008, PhD thesis, Universidad Autónoma de Madrid.
- Quintana-Lacaci et al. (2013) Quintana-Lacaci, G., Agúndez, M., Cernicharo, J., et al. 2013, A&A, 560, L2
- Quintana-Lacaci et al. (2007) Quintana-Lacaci, G., Bujarrabal, V., Castro-Carrizo, A., & Alcolea, J. 2007, A&A, 471, 551
- Rawlings et al. (2004) Rawlings, J. M. C., Redman, M. P., Keto, E., & Williams, D. A. 2004, MNRAS, 351, 1054
- Sánchez Contreras et al. (2015) Sánchez Contreras, C., Velilla Prieto, L., Agúndez, M., et al. 2015, A&A, 577, A52
- Smith et al. (2004) Smith, N., Vink, J. S., & de Koter, A. 2004, ApJ, 615, 475
- Teyssier et al. (2012) Teyssier, D., Quintana-Lacaci, G., Marston, A. P., et al. 2012, A&A, 545, A99
- Tiffany et al. (2010) Tiffany, C., Humphreys, R. M., Jones, T. J., & Davidson, K. 2010, AJ, 140, 339
- Wallström et al. (2015) Wallström, S. H. J., Muller, S., Lagadec, E., et al. 2015, A&A, 574, A139
- Wong (2013) Wong, K.-T. 2013, PhD thesis, University of Hong Kong
- Zhang et al. (2008) Zhang, Y., Kwok, S., & Dinh-V-Trung. 2008, ApJ, 678, 328
- Ziurys et al. (2009) Ziurys, L. M., Tenenbaum, E. D., Pulliam, R. L., Woolf, N. J., & Milam, S. N. 2009, ApJ, 695, 1604
Appendix A Line properties
| (GHz) | Molecule | Transition | TA∗(mK) | Area (K km/s) | Notes |
|---|---|---|---|---|---|
| 83.688093 | SO2 | –80,8 | 12.5 1.2 | 0.55 | |
| 84.746170 | 30SiO | 2–1 | 84.0 1.3 | 4.89 | |
| 85.759199 | 29SiO | 2–1 | 103.0 0.8 | 6.13 | |
| 86.093950 | SO | 22–11 | 8.9 1.27 | 0.4 | |
| 86.339922 | H13CN | 1–0 | 37.4 1.2 | 2.4 | |
| 86.846960 | SiO | 2–1 | 666.2 0.9 | 34.32 | |
| 88.631602 | HCN | 1–0 | 234.2 0.9 | 14.6 | |
| 89.188525 | HCO+ | 1–0 | 3.9 1.3 | 0.24 | |
| 90.663568 | HNC | 1–0 | 21.9 0.9 | 1.29 | |
| 90.771564 | SiS | 5–4 | 4.4 0.8 | 0.287 | |
| 93.173392 | N2H+ | 1–0 | 5.9 0.3 | 0.42 | |
| 93.979770 | PN | 2–1 | 7.0 1.0 | 0.46 | |
| 96.741375 | CH3OH | 2–1 | 3.2 0.6 | 0.15 | |
| 97.715317 | 34SO | 23–12 | 5.1 0.5 | 0.27 | |
| 97.980953 | CS | 2–1 | 13.9 0.3 | 0.825 | |
| 99.299870 | SO | 23–12 | 89.2 0.6 | 3.84 | |
| 104.029418 | SO2 | 31,3–20,2 | 39.1 0.6 | 1.71 | |
| 104.239295 | SO2 | 101,9–100,10 | 8.6 0.3 | 0.43 | |
| 108.924301 | SiS | 6–5 | 9.2 0.7 | 0.392 | |
| 109.252220 | SO | 32– | 12.7 1.3 | 0.65 | |
| 110.201354 | 13CO | 57.1 1.4 | 3.42 | ||
| 113.123370 | CN | 11/2,1/2–01/2,1/2 | 16.5 1.9 | 3.48 | H |
| 113.144157 | CN | 11/2,1/2–01/2,3/2 | – | – | H |
| 113.170492 | CN | 11/2,3/2–01/2,1/2 | – | – | H |
| 113.191279 | CN | 11/2,3/2–01/2,3/2 | – | – | H |
| 113.488120 | CN | 13/2,3/2–01/2,1/2 | – | – | H |
| 113.490970 | CN | 13/2,5/2–01/2,3/2 | – | – | H |
| 113.499644 | CN | 13/2,1/2–01/2,1/2 | – | – | H |
| 113.508907 | CN | 13/2,3/2–01/2,3/2 | – | – | H |
| 113.520432 | CN | 13/2,1/2–01/2,3/2 | – | – | H |
| 115.153935 | NS | 5/27/2–3/25/2 | 30.6 2.7 | 2.09 | H |
| 115.156812 | NS | 5/25/2–3/23/2 | – | – | H |
| 115.162982 | NS | 5/23/2–3/21/2 | – | – | H |
| 115.185336 | NS | 5/23/2–3/23/2 | – | – | H |
| 115.191456 | NS | 5/25/2–3/25/2 | – | – | H |
| 115.271202 | CO | 1–0 | 657.5 0.9 | 42.8 | |
| 115.556253 | NS | 5/27/2–3/25/2 | 21.8 3.0 | 1.52 | H |
| 115.570763 | NS | 5/25/2–3/23/2 | – | – | H |
| 115.571954 | NS | 5/23/2–3/21/2 | – | – | H |
| (GHz) | Molecule | Transition | TA∗(mK) | Area (K km/s) | Notes |
|---|---|---|---|---|---|
| 199.672229 | SiS | 11–10 | 24 2 | 0.463 | |
| 201.751489 | Si18O | 5–4 | 10.6 2.5 | 0.40 | |
| 203.391550 | SO2 | 120,12–111,11 | 17.2 2.0 | 0.82 | |
| 206.176005 | SO | – | 40.3 2.17 | 1.8 | |
| 207.436051 | NS | 9/211/2–7/29/2 | 48.8 3.4 | 1.68 | H |
| 207.436636 | NS | 9/27/2–9/27/2 | – | – | H |
| 207.438692 | NS | 9/27/2–7/25/2 | – | – | H |
| 207.566407 | U | – | 12.0 3.7 | 0.50 | |
| 207.777535 | NS | 9/29/2–7/29/2 | 53.2 3.2 | 1.65 | H |
| 207.792951 | NS | 9/27/2–7/27/2 | – | – | H |
| 207.834866 | NS | 9/211/2–7/29/2 | – | – | H |
| 207.838365 | NS | 9/29/2–7/27/2 | – | – | H |
| 208.700336 | SO2 | 32,2–22,1 | 50.1 3.8 | 2.40 | |
| 211.853474 | 30SiO | 5–4 | 169.7 4.1 | 8.71 | |
| 214.385758 | 29SiO | 5–4 | 118.7 4.7 | 5.67 | |
| 215.220653 | SO | – | 21.9 4.9 | 1.28 | |
| 217.104980 | SiO | 5–4 | 865.8 4.2 | 42.37 | |
| 217.817663 | SiS | 12–11 | 10 2 | 0.334 | |
| 218.440050 | CH3OH | 4–3 | 9.2 2.0 | 0.20 | |
| 219.949442 | SO | – | 138.6 3.1 | 5.70 | |
| 220.398684 | 13CO | 2–1 | 315 3 | 19.4 | |
| 221.965220 | SO2 | 111,11–100,10 | 22.6 2.8 | 1.05 | |
| 226.616571 | CN | 23/2,1/2–11/2,3/2 | 37.2 2.8 | 3.29 | H |
| 226.632190 | CN | 23/2,3/2–11/2,3/2 | – | – | H |
| 226.659558 | CN | 23/2,5/2–11/2,3/2 | – | – | H |
| 226.663693 | CN | 23/2,1/2–11/2,1/2 | – | – | H |
| 226.679311 | CN | 23/2,3/2–11/2,1/2 | – | – | H |
| 226.874191 | CN | 25/2,5/2–13/2,3/2 | – | – | H |
| 226.874781 | CN | 25/2,7/2–13/2,5/2 | – | – | H |
| 226.887420 | CN | 25/2,3/2–13/2,3/2 | – | – | H |
| 226.892128 | CN | 25/2,5/2–13/2,5/2 | – | – | H |
| 226.905357 | CN | 25/2,3/2–13/2,5/2 | – | – | H |
| 230.538000 | CO | 2–1 | 2.511 103 3.2 | 159 | |
| 234.935695 | PN | 6–5 | 13.6 2.9 | 0.45 | |
| 235.151720 | SO2 | 42,2–31,3 | 59.1 2.1 | 2.58 | |
| 235.961363 | SiS | 13–12 | 13.5 3.5 | 0.43 | |
| 241.615797 | SO2 | 52,4–41,3 | 20.3 1.9 | 1.04 | |
| 244.365156 | U | – | 9.2 2.9 | 0.61 | 8MHz |
| 244.935557 | CS | 5–4 | 13.5 3.5 | 0.72 | |
| 250.436848 | NO | 5/27/2–3/25/2 | 22.8 2.4 | 1.49 | H |
| 250.440659 | NO | 5/25/2–3/23/2 | – | – | H |
| 250.448530 | NO | 5/23/2–3/21/2 | – | – | H |
| 250.475414 | NO | 5/23/2–3/23/2 | – | – | H |
| 250.482939 | NO | 5/25/2–3/25/2 | – | – | H |
| 250.796436 | NO | 5/27/2–3/25/2 | 19.0 2.3 | 1.51 | H |
| 250.815594 | NO | 5/25/2–3/23/2 | – | – | H |
| 250.816954 | NO | 5/23/2–3/21/2 | – | – | H |
| 251.199675 | SO2 | 131,13–120,12 | 24.0 2.5 | 1.12 | |
| 251.826156 | SO | – | 35.9 3.0 | 1.06 | |
| 251.912005 | U | 3–2 | 7.0 2.2 | 0.09 | |
| 253.968393 | NS | 11/213/2–9/211/2 | 38.3 2.7 | 1.39 | H |
| 253.970581 | NS | 11/211/2–9/29/2 | – | – | H |
| 254.216656 | 30SiO | 6–5 | 115.3 3.7 | 4.70 | |
| 254.280536 | SO2 | 63,3–62,4 | 14.4 3.6 | 0.31 | |
| 255.553302 | SO2 | 43,1–42,2 | 14.1 2.9 | 0.51 | |
| 255.958044 | SO2 | 33,1–32,2 | 10.3 2.6 | 0.74 | |
| 256.246945 | SO2 | 53,3–52,4 | 26.03.7 | 0.89 | |
| 257.099966 | SO2 | 73,5–72,6 | 12.9 2.4 | 0.85 | |
| 257.255216 | 29SiO | 6–5 | 179.4 2.6 | 8.59 | |
| 258.255826 | SO | 66–55 | 2.7 3.3 | 1.62 | |
| 259.011821 | H13CN | 3–2 | 80.0 3.3 | 4.11 | |
| 260.518020 | SiO | 6–5 | 959 2.2 | 47.9 | |
| 261.259318 | HN13C | 3–2 | 15.7 4.8 | 0.78 | |
| 261.843721 | SO | 67 – 56 | 77.5 6.0 | 2.58 | |
| 265.886180 | HCN | 3–2 | 529.3 4.1 | 24.1 | |
| 271.529014 | SO2 | 72,6–61,5 | 19.9 3.8 | 0.823 | |
| 271.981142 | HNC | 3–2 | 167.6 4.6 | 8.24 |