Bulk Fermi-surface of the Weyl type-II semi-metal candidate -MoTe2
Abstract
The electronic structure of semi-metallic transition-metal dichalcogenides, such as WTe2 and orthorhombic MoTe2, are claimed to contain pairs of Weyl points or linearly touching electron and hole pockets associated with a non-trivial Chern number. For this reason, these compounds were recently claimed to conform to a new class, deemed type-II, of Weyl semi-metallic systems. A series of angle resolved photoemission experiments (ARPES) claim a broad agreement with these predictions detecting, for example, topological Fermi arcs at the surface of these crystals. We synthesized single-crystals of semi-metallic MoTe2 through a Te flux method to validate these predictions through measurements of its bulk Fermi surface (FS) via quantum oscillatory phenomena. We find that the superconducting transition temperature of MoTe2 depends on disorder as quantified by the ratio between the room- and low-temperature resistivities, suggesting the possibility of an unconventional superconducting pairing symmetry. Similarly to WTe2, the magnetoresistivity of MoTe2 does not saturate at high magnetic fields and can easily surpass %. Remarkably, the analysis of the de Haas-van Alphen (dHvA) signal superimposed onto the magnetic torque, indicates that the geometry of its FS is markedly distinct from the calculated one. The dHvA signal also reveals that the FS is affected by the Zeeman-effect precluding the extraction of the Berry-phase. A direct comparison between the previous ARPES studies and density-functional-theory (DFT) calculations reveals a disagreement in the position of the valence bands relative to the Fermi level . Here, we show that a shift of the DFT valence bands relative to , in order to match the ARPES observations, and of the DFT electron bands to explain some of the observed dHvA frequencies, leads to a good agreement between the calculations and the angular dependence of the FS cross-sectional areas observed experimentally. However, this relative displacement between electron- and hole-bands eliminates their crossings and, therefore, the Weyl type-II points predicted for MoTe2.
I Introduction
The electronic structure of the transition-metal dichalcogenides (TMDs) belonging to the orthorhombic and non-centrosymmetric space group, e.g. WTe2, were recently recognized as candidates for possible topologically non-trivial electronic states. For instance, their monolayer electronic bands were proposed to be characterized by a non-trivial topological invariant based on the parity of their valence bands, making their monolayers good candidates for a quantum spin Hall insulating ground-state TP_transition . This state is characterized by helical edge states that are protected by time-reversal symmetry from both localization and elastic backscattering. Hence, these compounds could provide a platform for realizing low dissipation quantum electronics and spintronics TP_transition ; MacDonald .
However, the majority of gapped TMDs, such as semiconducting MoS2 or WSe2, crystallize either in a trigonal prismatic coordination or in a triclinic structure with octahedral coordination review1 ; review2 as is the case of ReS2. Those crystallizing in the aforementioned orthorhombic phase, e.g. WTe2, are semi-metals albeit displaying remarkable transport properties such as an enormous, non-saturating magnetoresistivity cava . Strain is predicted to open a band gap TP_transition in WTe2, which might make it suitable for device development. In fact, simple exfoliation of its isostructural MoTe2 compound (where refers to the orthorhombic semi-metallic phase) into thin atomic layers was claimed to induce a band gap MoTe2_MI_transition in the absence of strain. Such a transition would contrast with band structure calculations finding that WTe2 should remain semi-metallic when exfoliated down to a single atomic layer Lv . The insulating behavior reported for a few atomic layers of WTe2 was ascribed to an increase in disorder due to its chemical instability in the presence of humidity which would induce Anderson localization Morpurgo , although more recently it was claimed to be intrinsic from transport measurements on encapsulated few-layered samples Cobden .
Orthorhombic MoTe2 and its isostructural compound WTe2 were also claimed, based on density functional theory calculations, to belong to a new class of Weyl semi-metals, called type-II, which is characterized by a linear touching between hole and electron Fermi surface pockets bernevig ; felser ; bernevig2 ; Hasan . As for conventional Weyl points Weyl1 ; Weyl2 , these Weyl type-II points would also act as topological charges associated with singularities, i.e., sources and sinks, of Berry-phase pseudospin bernevig ; felser ; bernevig2 ; Hasan which could lead to anomalous transport properties. A series of recent angle-resolved photoemission spectroscopy (ARPES) measurements ARPES_Huang ; ARPES_Deng ; ARPES_Jiang ; ARPES_Liang ; ARPES_Xu ; ARPES_Tamai ; ARPES_Belopolski ; thirupathaiah claim to observe a good overall agreement with these predictions. These studies observe the band crossings predicted to produce the Weyl type-II points, which would be located slightly above the Fermi-level, as well as the Fermi arcs projected on the surface of this compound ARPES_Huang ; ARPES_Deng ; ARPES_Jiang ; ARPES_Liang ; ARPES_Xu ; ARPES_Tamai ; ARPES_Belopolski ; thirupathaiah .
Here, motivated by the scientific relevance and the possible technological implications of the aforementioned theoretical predictions bernevig ; felser ; bernevig2 ; Hasan ; TP_transition , we evaluate, through electrical transport and torque magnetometry in bulk single-crystals, the electronic structure at the Fermi level and the topological character of orthorhombic MoTe2. Our goal is to contrast our experimental observations with the theoretical predictions and the reported ARPES results in order to validate their findings. This information could, for example, help us predict the electronic properties of heterostructures fabricated from single- or a few atomic layers of this compound. An agreement between the calculated geometry of the FS of MoTe2 with the one extracted from quantum oscillatory phenomena, would unambiguously support the existence of Weyl nodes in the bulk Weyl1 ; Weyl2 and, therefore, the existence of related non-trivial topological surface states or Fermi arcs Weyl2 ; Hasan ; bernevig ; felser ; bernevig2 ; Hasan . However, quantum oscillatory phenomena from MoTe2 single-crystals reveals a Fermi surface whose geometry is quite distinct from the one predicted by the DFT calculations based on its low temperature crystallographic structure. The extracted Berry-phase is found to be field-dependent. Still one does not obtain evidence for the topological character predicted for this compound when the Berry-phase is evaluated at low fields. Here, we show that shifts in the relative position of the electron and hole bands, implied by previous ARPES studies ARPES_Huang ; ARPES_Deng ; ARPES_Jiang ; ARPES_Liang ; ARPES_Xu ; ARPES_Tamai ; ARPES_Belopolski ; thirupathaiah , can replicate the angular dependence of the observed Fermi surface cross-sectional areas. However, these band shifts imply that the valence and electron bands would no longer cross and, therefore, that MoTe2 would not display the predicted Weyl type-II semi-metallic state.
II Methods and Experimental Results
Very high quality single crystals of monoclinic MoTe2 were synthesized through a Te flux method: Mo, 99.9999%, and Te 99.9999 % powders were placed in a quartz ampoule in a ratio of 1:25 heated up to 1050 ∘C and held for 1 day. Then, the ampoule was slowly cooled down to 900 ∘C and centrifuged. The “as harvested” single-crystals were subsequently annealed for a few days at a temperature gradient to remove the excess Te. Magneto-transport measurements as a function of temperature were performed in a Physical Property Measurement System using a standard four-terminal configuration. Measurements of the Shubnikov-de Haas (SdH) and the de Haas-van Alphen (dHvA) effects were performed in dilution refrigerator coupled to a resistive Bitter magnet, with the samples immersed in the 3He-4He mixture. Measurements of the dHvA-effect were performed via a torque magnetometry technique, i.e. by measuring the deflection of a Cu-Be cantilever capacitively. Electrical transport measurements in pulsed magnetic fields were performed at the Dresden High Magnetic Field Laboratory using a 62 T magnet with a pulse duration of 150 ms. The sample temperature was controlled using a 4He bath cryostat (sample in He atmosphere) with an additional local heater for temperatures above 4.2 K. Synchrotron based X-ray measurements were performed in three single-crystals at the CHESS-A2 beam line using a combination of photon energies and cryogenic set-ups. The crystallographic data was reduced with XDS XDS . The structures were solved with direct methods using SHELXS shelx . Outlier rejection and absorption correction was done with SADABS. Least squares refinement on the intensities were performed with SHELXL shelx . For additional detailed information on the experimental set-ups used, see Supplemental Information file supplemental .
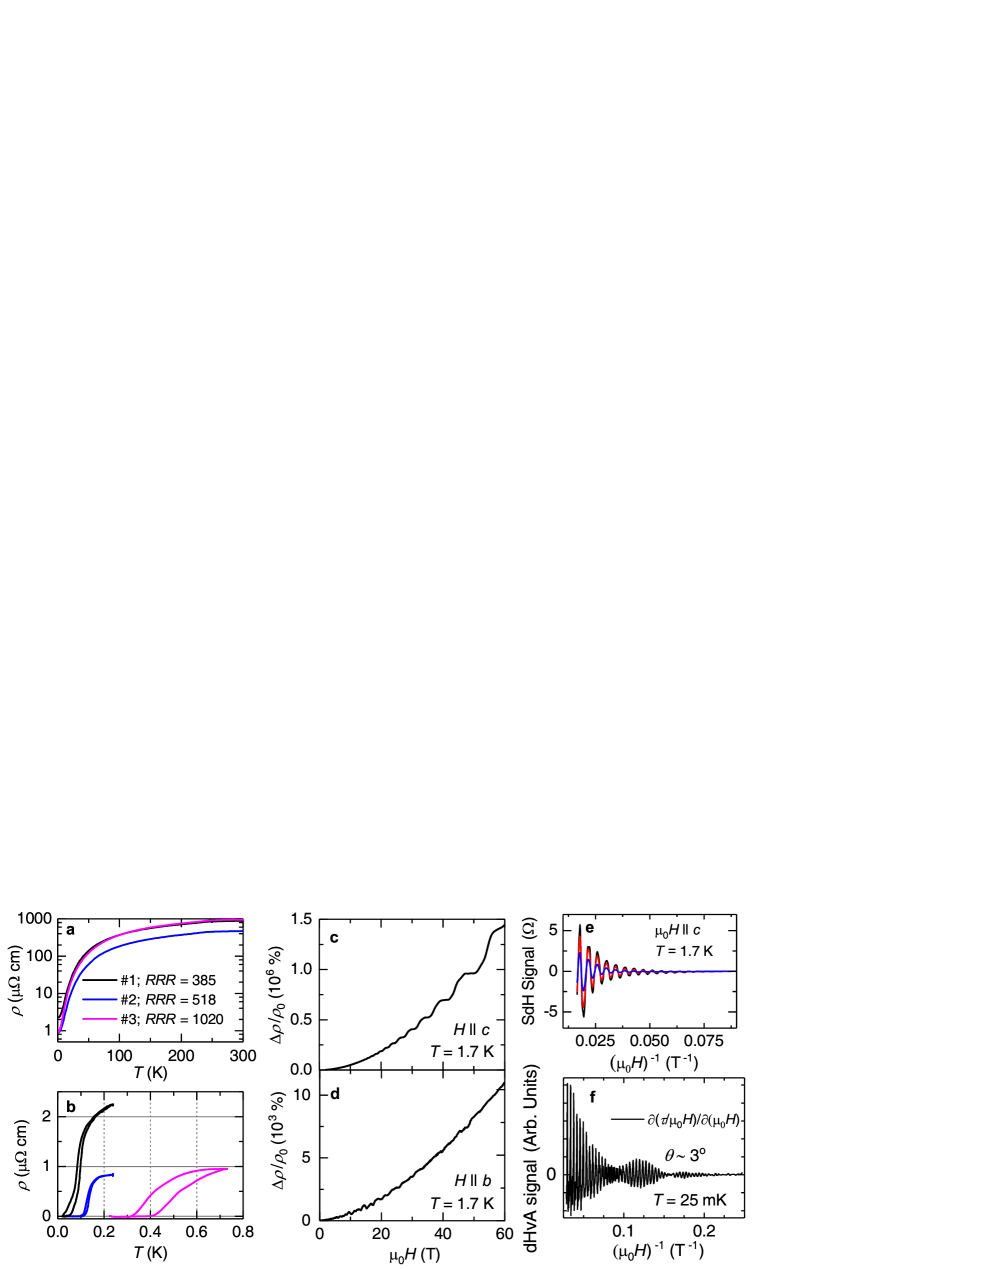
As illustrated by Fig. 1(a), the as synthesized single-crystals display resistivity ratios RRR = ranging from to which is one to two orders of magnitude higher than the values currently in the literature (see, for example, Ref. MoTe2_SC, ). Although not clearly visible in Fig. 1(a) due to its logarithmic scale, a hysteretic anomaly is observed in the resistivity around K corresponding to the monoclinic to orthorhombic structural transition which stabilizes what we denominate as the orthorhombic MoTe2 phase. For a clearer exposure of this transition and related hysteresis, see Ref. qiong, . These single-crystals were subsequently measured at much lower temperatures allowing us to determine their superconducting transition temperature . Remarkably, and as seen in Fig. 1(b), we find that depends on sample quality, increasing considerably as the increases, suggesting that structural disorder suppresses . For these measurements, particular care was taken to suppress the remnant field of the superconducting magnet since the upper critical fields are rather small (see Supplemental Fig. S1 supplemental ). The sample displaying the highest and concomitant was measured in absence of a remnant field. To verify that these differences in are not due to a poor thermal coupling between the sample and the thermometers, was measured twice by increasing and decreasing very slowly. The observed hysteresis is small relative to indicating that the measured s are not an artifact. The values of the residual resistivities depend on a careful determination of the geometrical factors such as the size of the electrical contacts. Therefore, the provides a more accurate determination of the single-crystalline quality. In the past, the suppression of by impurities and structural defects was systematically taken as evidence for unconventional superconductivity andy ; satoru1 ; satoru2 , e.g. triplet superconductivity Maeno in Sr2RuO4. Nevertheless, the fittings of the upper-critical fields to a conventional Ginzburg-Landau expression, shown in Fig. S1 supplemental , points towards singlet pairing.
We have also evaluated the quality of our single crystals through Hall-effect qiong and heat capacity measurements (see, Supplemental Fig. S2 supplemental ). Hall-effect reveals a sudden increase in the density of holes below K, suggesting a possible temperature-induced Lifshitz-transition. While the heat capacity reveals a broad anomaly around K, well-below its Debye temperature ( K), that would suggest that the structural degrees of freedom continue to evolve upon cooling below K. Given that such structural evolution could affect the electronic band structure predicted for MoTe2 felser ; bernevig2 ; Hasan , we performed synchrotron X-ray scattering down to K (see, Supplemental Fig. S3 supplemental ). We observe some variability in the lattice constants extracted among several single-crystals and a sizeable hysteresis in the range associated with the structural transition observed at K, but no significant evolution in the crystallographic structure below 100 K. As we discuss below, there are negligible differences between the electronic bands calculated with the crystal structures collected at 100 K and at 12 K, respectively.
Figures 1(c) and 1(d) display the change in magnetoresistivity as a function of the field for a crystal characterized by when the electrical current flows along the crystalline a-axis and the field is applied either along the c- or the b-axes, respectively. Similarly to WTe2, for both orientations shows no sign of saturation under fields all the way up to 60 T while surpassing % for -axis cava . For WTe2 such anomalous magnetoresistivity was attributed to compensation between the density of electrons and holes cava ; pletikosic ; pippard . Nevertheless, there are a number of subsequent observations Daniel contradicting this simple scenario, such as i) a non-linear Hall response Joe , ii) the suppression of the magnetoresistivity at a pressure where the Hall response vanishes WTe2_SC_1 (i.e. at perfect compensation), and iii) the observation of a pronounced magnetoresistivity in electrolyte gated samples with a considerably higher density of electrons with respect to that of holes Fuhrer . It remains unclear if the proposed unconventional electronic structure bernevig ; felser ; bernevig2 would play a role on the giant magnetoresistivity of WTe2, while its measured FS differs from the calculated one Daniel ; behnia . In contrast, we have previously shown that -MoTe2 indeed is a well compensated semi-metal qiong . The slightly smaller magnetoresistivity of MoTe2 relative to WTe2 is attributable to heavier effective effective masses, according to de Haas-van Alphen-effect discussed below, or concomitantly lower mobilities.
The best MoTe2 samples, i.e. those with , display even more pronounced under just T. The oscillatory component superimposed on the magnetoresistivity corresponds to the Shubnikov-de Haas (SdH) effect resulting from the Landau quantization of the electronic orbits. Figure 1(e) shows the oscillatory, or the SdH signal as a function of inverse field for three temperatures. The SdH signal was obtained by fitting the background signal to a polynomial and subtracting it. Notice how for this sample and for c-axis, the SdH signal is dominated by a single frequency. However for all subsequent measurements performed under continuous fields (discussed below) one observes the presence of two main frequencies very close in value, each associated to an extremal cross-sectional area of the FS through the Onsager relation where is the Planck constant and is the electron charge. To illustrate this point, we show in Fig. 1(f) the oscillatory signal extracted from the magnetic torque, i.e. , or the de Haas-van Alphen effect (dHvA) collected from a MoTe2 single-crystal for fields aligned nearly along its c-axis. Here is the magnetization and is its magnetic susceptibility. Figure 1(f) shows the oscillatory component of the magnetic susceptibility . The envelope of the oscillatory signal displays the characteristic “beating” pattern between two close frequencies. This becomes clearer in the fast Fourier transform of the oscillatory signal shown below. According to the Lifshitz-Onsager quantization condition kim ; nagaosa , the oscillatory component superimposed onto the susceptibility is given by:
| (1) |
where is the dHvA frequency, is the harmonic index, the cyclotron frequency, the Landé g-factor, the effective mass in units of the free electron mass , and is a constant. is a phase shift determined by the dimensionality of the FS which acquires a value of either or for two- and three-dimensional FSs kim ; nagaosa ; kopelevich , respectively. is the Berry phase which, for Dirac and Weyl systems, is predicted to acquire a value kim ; nagaosa ; kopelevich . Finally, ) is the so-called Dingle temperature from which one extracts or the characteristic quasiparticle scattering time.
In Supplementary Figs. S4 and S5 supplemental , we discuss the extraction of the Berry-phase of MoTe2 via fits to Eq. (1) of the oscillatory signal shown in Fig. 1(f). However, the geometry of the FS of MoTe2 evolves slightly as the field increases due to the Zeeman-effect, which precludes the extraction of its Berry phase. More importantly, one cannot consistently extract a value when one limits the range in magnetic fields to smaller values in order to minimize the role of the Zeeman-effect. In other words, the dHvA-effect does not provide evidence for the topological character of MoTe2. Nevertheless, it does indicate that the Dingle temperature decreases as the field increases implying a field-induced increase in the quasiparticle lifetime. This effect should contribute to its large and non-saturating magnetoresistivity. We reported a similar effect for WTe2 Daniel .
Since the Berry-phase extracted from the dHvA-effect does not provide support for a topological semi-metallic state in MoTe2, it is pertinent to ask if the DFT calculations predict the correct electronic band-structure and related FS geometry for this compound, since both are the departing point for the predictions of Refs. bernevig, ; felser, ; bernevig2, . To address this issue, we studied the dHvA-effect as a function of the orientation of the field with respect to the main crystallographic axes. Here, our goal is to compare the angular dependence of the cross-sectional areas determined experimentally, with those predicted by DFT.
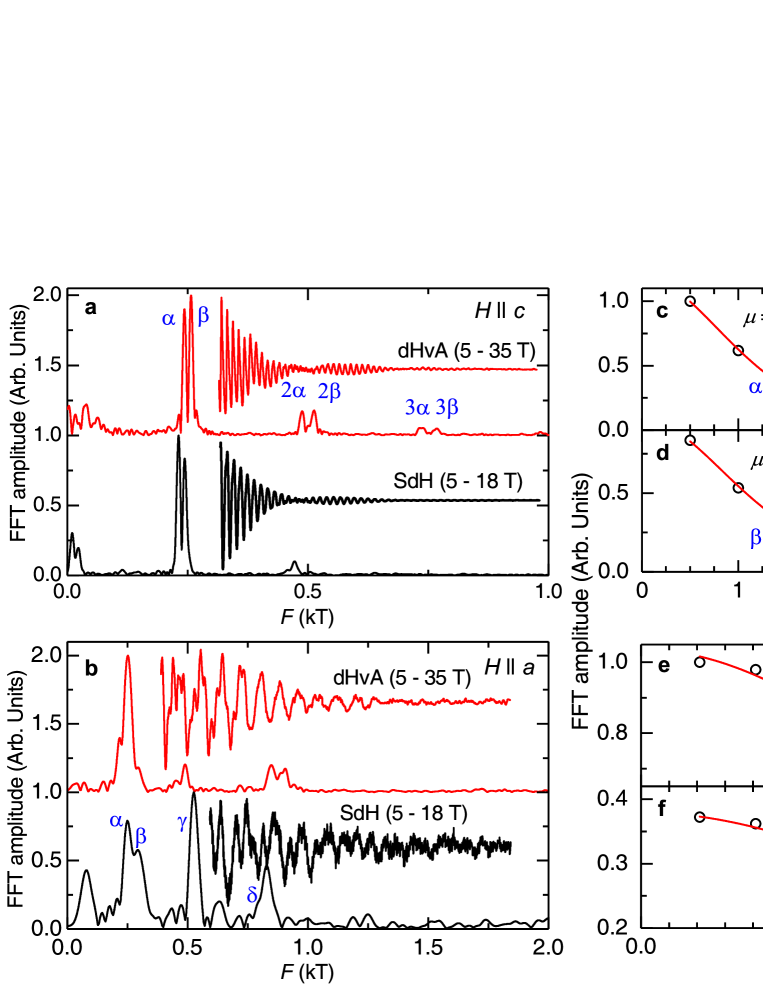
Figures 2(a) and 2(b) display both the dHvA (red traces) and the SdH signals (black traces) measured in two distinct single crystals and for two field orientations, respectively along the and the axes. As previously indicated, the dHvA and SdH signals were obtained after fitting a polynomial and subtracting it from the background magnetic torque and magnetoresistivity traces, respectively. The SdH signal was collected from a crystal displaying a at mK under fields up to 18 T, while the dHvA one was obtained from a crystal displaying at mK under fields up to 35 T. Both panels also display the Fast Fourier transform (FFT) of the oscillatory signal. For fields along the axis, one observes two main peaks at T and at T, as well as their first- and second harmonics and perhaps some rather small frequencies which could result from imperfect background subtraction. We obtain the same two dominant frequencies regardless of the interval in used to extract the FFTs. Supplemental Fig. S6 supplemental displays the dHvA signal for aligned nearly along the axis along with the corresponding FFT spectra which are again dominated by two prominent peaks. The observation of just two main frequencies for axis is rather surprising since, as we show below, DFT calculations, including the effect of the spin-orbit interaction, predict several pairs of electron-like corrugated cylindrical FSs along with pairs of smaller three-dimensional electron-like sheets in the First-Brillouin zone. Around the point, DFT predicts at least a pair of four-fold symmetric helix-like large hole sheets. This complex FS should lead to a rich oscillatory signal, contrary to what is observed. One might argue that the non-observation of all of the predicted FS sheets would be attributable to an experimental lack of sensitivity or to poor sample quality which would lead to low carrier mobility. Nevertheless, our analysis of the Hall-effect within a two-carrier model qiong , yields electron- and hole-mobilities ranging between and cm2/Vs at low s which is consistent with both the small residual resistivities and the large resistivity ratios of our measured crystals. Given that the magnetic torque is particularly sensitive to the anisotropy of the FS, such high mobilities should have allowed us to detect most of the predicted FSs, particularly at the very low s and very high fields used for our measurements. Hence, we conclude that the geometry of the FS ought to differ considerably from the one predicted by DFT.
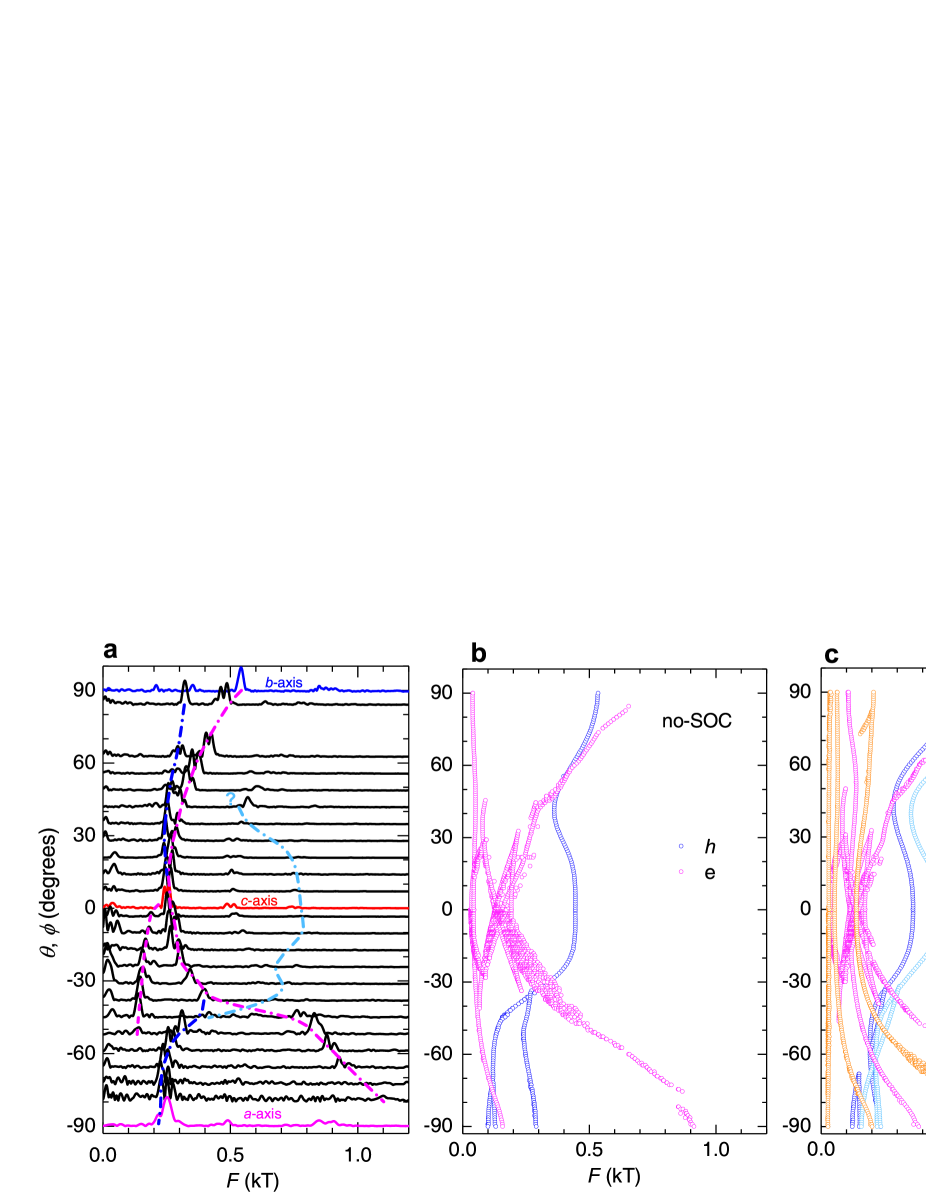
In Figs. 2(c) and 2(d) we plot the amplitude of the main peaks observed in the FFT spectra for fields along the axis as a function of the temperature. Red lines are fits to the Lifshitz-Kosevich (LK) temperature damping factor, i.e. with and with being the effective mass in units of the free electron mass, from which we extract the masses associated with each frequency. As seen, for axis one obtains and , which contrasts with the respective values obtained for axis, namely , see Figs. 2(e) and 2(f). As previously mentioned for axis, we observe two main frequencies, but by reducing the window to focus on the higher field region, we detect additional frequencies (See, Fig. S6 supplemental ) which are characterized by heavier effective masses, i.e. in the order of . This indicates that MoTe2 displays a higher anisotropy in effective masses when compared to WTe2 Daniel , although these masses are consistent with its sizeable coefficient. Supplemental Fig. S7 supplemental displays several traces of the dHvA signal as functions of the inverse field for several angles between all three main crystallographic axes. These traces are used to plot the angular dependence of the FS cross-sectional areas in order to compare these with the DFT calculated ones.
III Comparison between experiments and the DFT calculations
Several recent angle-resolved photoemission spectroscopy (ARPES) studies ARPES_Huang ; ARPES_Deng ; ARPES_Jiang ; ARPES_Liang ; ARPES_Xu ; ARPES_Tamai ; ARPES_Belopolski ; thirupathaiah claim to find a broad agreement between the band structure calculations, the predicted geometry of the Fermi surface, the concomitant existence of Weyl type-II points bernevig ; felser ; bernevig2 , and the related Fermi arcs on the surface states of MoTe2. Several of these experimental and theoretical studies claim that the electronic structure of this compound is particularly sensitive to its precise crystallographic structure. Inter-growth of the phase or the temperature used to collect to X-ray diffraction data, typically around 100 to 230 K, are claimed to have a considerable effect on the calculations bernevig2 ; ARPES_Tamai . Given the few frequencies observed by us, it is pertinent to ask if the mild evolution of the crystallographic structure as a function of the temperature shown in Fig. S3 supplemental would affect the geometry of the FS of MoTe2. To address this question we performed a detailed angular-dependent study of the frequencies extracted from both the SdH and the dHvA effects in MoTe2 in order to compare these with the angular dependence of the FS cross-sectional areas predicted by the calculations.
In the subsequent discussion we compare the angular dependence of our dHvA frequencies with calculations performed with the Quantum Espresso QE implementation of the density functional theory in the GGA framework including spin-orbit coupling (SOC). The Perdew-Burke-Ernzerhof (PBE) exchange correlation functional PBE was used with fully relativistic norm-conserving pseudopotentials generated using the optimized norm-conserving Vanderbilt pseudopotentials as described in Ref. ONCVPP, . The 4s, 4p, 4d and 5s electrons of Mo and the 4d, 5s and 5p electrons of Te were treated as valence electrons. After careful convergence tests, the plane-wave energy cutoff was taken to be 50 Ry and a point mesh of was used to sample the reducible Brillouin Zone (BZ) used for the self-consistent calculation. The Fermi surfaces were generated using a more refined point mesh of . FS sheets were visualized using the XCrysden software xcrysden . The related angular dependence of the quantum oscillation frequencies was calculated using the skeaf code skeaf . As shown in Fig. 3 the results are very close to those obtained by using the VASP and the Wien2K implementations of DFT (see, Fig. S8 in SI supplemental ), and also to those reported by Refs. felser, ; bernevig2, ; ARPES_Huang, ; thirupathaiah, .
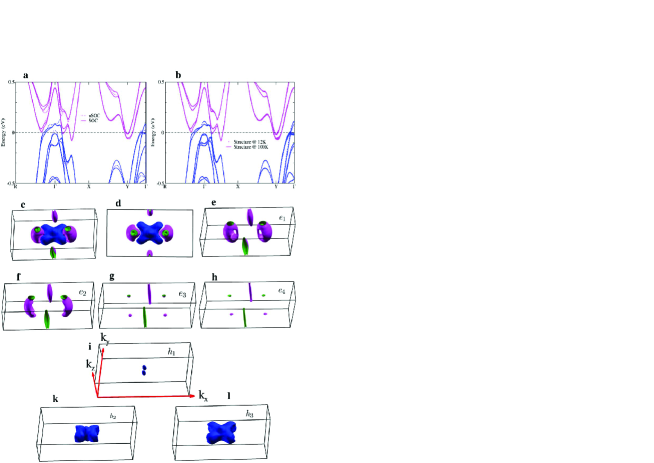
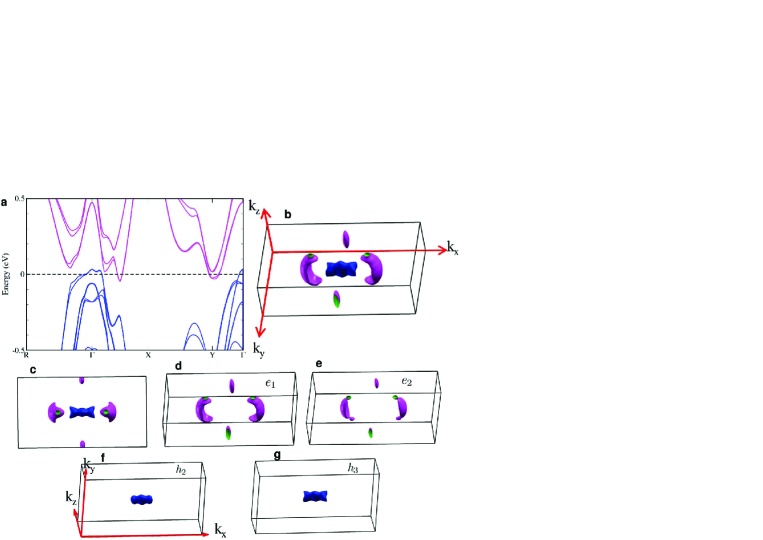
Figure 3(a) displays the electronic band structure of MoTe2, based on its structure determined at K, with and without the inclusion of SOC. As previously reported felser ; bernevig2 , electron- and hole-bands intersect along the direction at energies slightly above creating a pair of Weyl type-II points. Figure 3(b) shows a comparison between band structures based on the crystallographic lattices determined at 12 K and at 100 K, respectively. Both sets of electronic bands are nearly identical and display the aforementioned crossings between hole- and electron-bands thus indicating that the electronic structure remains nearly constant below 100 K. Figures 3(c) and 3(d) provide a side perspective and a top view of the overall resulting FS within BZ, respectively. The main features of the DFT calculations are the presence of two-dimensional electron pockets, labeled and in Figs. 3(e) and 3(f) and of large “star-shaped” hole-pockets near the point, labeled as the and the sheets in Figs. 3(k) and 3(l). These electron and hole pockets nearly “touch”. Due to the broken inversion symmetry, these bands are not Kramer’s degenerate, and hence the spin-orbit split partners of the corresponding electron and hole pockets are located inside the corresponding bigger sheets. The hole pocket and the and electron pockets are very sensitive to the position of disappearing when is moved by only meV.
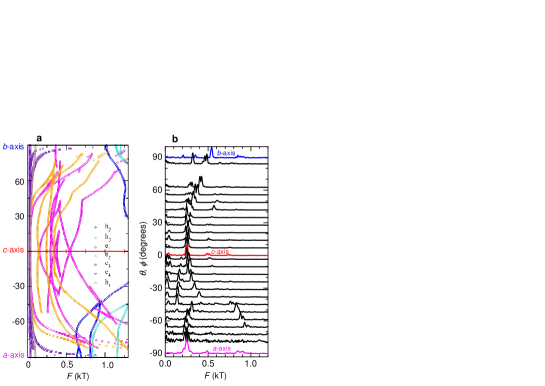
Figures 4(a) and 4(b) present the angular dependence of the calculated and of the measured FFT spectra of the oscillatory signal (raw data in Fig. S7 supplemental ), respectively. In this plot the Onsager relation was used to convert the theoretical FS cross-sectional areas into oscillatory frequencies. In Fig. 4(b) refers to angles between the and the axis, where corresponds to axis, while corresponds to angles between the and the axis, again relative to the axis. As seen, there are striking differences between both data sets with the calculations predicting far more frequencies than the measured ones. More importantly, for fields oriented from the c-axis towards either the or the axis, one observes the complete absence of experimental frequencies around kT which, according to the calculations, would correspond to the cross-sectional areas of the hole-pockets and . In addition, while many of the predicted electron orbits show a marked two-dimensional character, diverging as the field is oriented towards the or the axis, the experimentally observed frequencies show finite values for fields along either axis. This indicates that these orbits are three-dimensional in character, despite displaying frequencies close to those predicted for the and the pockets for fields along the axis. These observations, coupled to the non-detection of all of the predicted orbits, in particular the large hole and Fermi surfaces, indicate unambiguously that the actual geometry of the FS of MoTe2 is different from the calculated one. Notice that frequencies inferior to T, which correspond to the smaller electron- and hole-pockets and which are particularly sensitive to the position of as previously mentioned, were not included in Fig. 4(a) for the sake of clarity.
The calculation shows a significant difference between the SOC-split theoretical bands, which is highlighted by the absence of a frequency around 0.5 kT associated with pocket, along with its presence in association with the pocket. This contrast between both orbits is due to the presence of a “handle-like” structure (see Fig. 3(e)) in which gives a maximum cross-section close to the BZ edge. However, at this position there is no maximum cross-section within the BZ for the pocket since its “handle” is missing (see Fig. 3(f)). This marked difference in topology between the FSs of both spin-orbit split partners indicates that the strength of the SOC provided by the DFT calculations tends to be considerably larger than the one implied by our experiments. In fact, from the twin peaks observed in the experimental FFT spectra having frequencies around 250 T for fields along the c-axis, which are likely to correspond to SOC-split bands due to their similar angular dependence, we can infer that the actual SO-splitting is far less significant than the value predicted by the calculations. We have investigated the possibility of an overestimation of the strength of the SOC within our calculations which is the mechanism driving the DFT prediction of a large number of dHvA frequencies displaying remarkably different angular dependencies. For instance, we calculated the angular dependence of the FSs without the inclusion of SOC. This leads to just one, instead of a pair of distinct SOC-split bands, which in fact display angular dependencies very similar to those of orbits , and in Fig. 4(a). Notice that part of the discrepancy is attributable to the inter-planar coupling which is not well captured by the DFT calculations Son . DFT suggests that this compound is van der Waals like by predicting several two-dimensional (i.e. cylindrical like) FS sheets, when the experiments indicate that the overall FS displays a marked three-dimensional character. This indicates that the inter-planar coupling is stronger than implied by DFT. In any case, from Figs. 4(a) and 4(b) and the above discussion, it is clear that there are significant discrepancies between the calculated and the measured FSs. Given that the proposed Weyl type-II scenario bernevig ; felser ; bernevig2 hinges on a possible touching between electron- and hole-pockets, it is critical to understand their exact geometry, or the reason for the disagreement between predictions and experiments, before one can make any assertion on the existence of the Weyl type-II points in MoTe2.
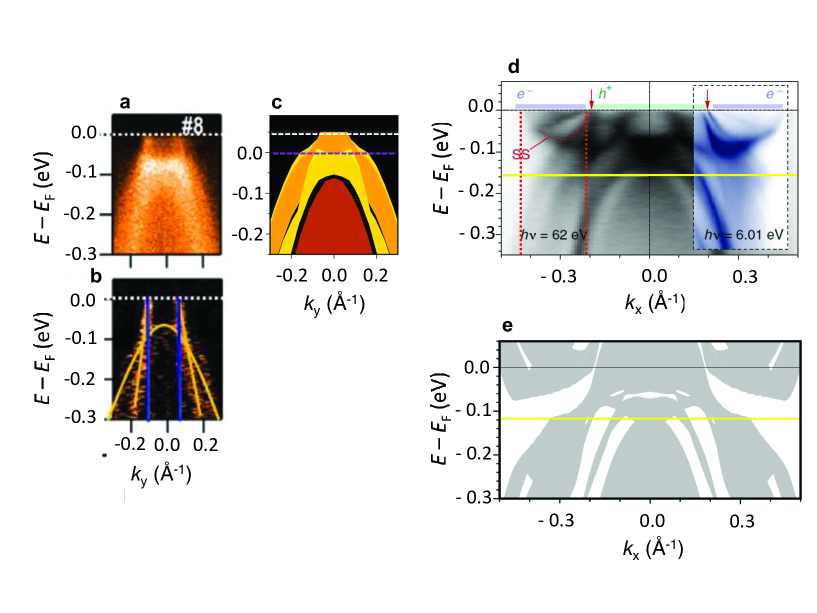
To understand the source of the disagreement between calculations and our measurements, we now focus on a detailed comparison between our DFT calculations and a selection of ARPES studies. Figure 5(a) corresponds to data from Ref. thirupathaiah, depicting an ARPES energy distribution map (EDM) along while keeping . Figure 5(b) plots its derivative. In both figures the point corresponds to . According to the calculations, this EDM should reveal two valence bands intersecting around the point; the first leading to two small hole-pockets, or the sheets at either side of , with the second SOC-split band producing the larger and sheets. Instead, ARPES observes just one band intersecting which leads to a single FS sheet of cross-sectional area as indicated by the vertical blue lines in Fig. 5(b). This observation by ARPES questions the existence of the band (or of its intersection with ) responsible for the large and hole-pockets with this band being the one previously reported to touch the electron band that produces the pocket and creating in this way the Weyl type-II points ARPES_Huang ; ARPES_Deng ; ARPES_Jiang ; ARPES_Tamai ; ARPES_Belopolski . Notice that our dHvA measurements do not reveal any evidence for the original and sheets, thus, being in agreement with this ARPES observation. Furthermore, the Onsager relation yields a frequency of T for which, in contrast, is close to the frequencies observed by us for axis. Figure 5(c) displays the band structure calculated “ribbons” obtained by projecting the dependence of the bands onto the plane. This representation of the band-structure provides a better comparison with the ARPES EDMs. As seen, there is a good overall agreement between the ARPES and the DFT bands, as previously claimed ARPES_Huang ; ARPES_Deng ; ARPES_Jiang ; ARPES_Tamai ; ARPES_Belopolski , except for the exact position of . The purple line depicts the position of according to the DFT calculations while the white line depicts the position of according to ARPES. A nearly perfect agreement between DFT and ARPES is achievable by shifting the DFT valence bands by meV, which is what ends suppressing the and FS hole sheets from the measured ARPES EDMs. As shown through Figs. 5(d) and 5(e), this disagreement between the ARPES and the DFT bands is observed in the different ARPES studiesARPES_Tamai . Figure 5(d) corresponds to an EDM along the direction of the BZ. As shown in Fig. 5(e), DFT reproduces this EDM quite well. Nevertheless, as indicated by the yellow lines in both figures, which are positioned at the top of the deepest valence band observed by ARPES, the ARPES bands are displaced by meV with respect to the DFT ones. Red dotted lines in Fig. 5(d) indicate the cross-sections of the observed electron pockets or . Therefore, to match our main dHvA frequencies, the electron bands would have to be independently and slightly displaced towards higher energies to decrease their cross-sectional area. To summarize, DFT and ARPES agree well on the overall dispersion of the bands of MoTe2, but not on their relative position with respect to .
Therefore, guided by ARPES, we shifted the overall valence bands of MoTe2, shown in Figs. 3(a) and 3(b), by -50 meV and the electron ones by +35 meV to recalculate the FS cross-sectional areas as a function of field orientation relative to the main crystallographic axes. The comparison between the measured dHvA cross-sectional areas and those resulting from the shifted DFT bands are shown in Fig. 6. Figure 6(a) displays the Fourier spectra, previously shown in Fig. 4(b), with superimposed colored lines identifying shifted electron (magenta) and hole (blue) orbits according to Fig. 6(b) which displays these frequencies as a function of field orientation for shifted non-SOC-split DFT bands. As seen, the qualitative and quantitative agreement is good, but not perfect. In contrast, Fig. 6(c) displays these orbits/frequencies as a function of field orientation for SOC-split DFT bands. Clearly, and as previously discussed, the approach used to evaluate the effect of the SOC in MoTe2 seems to overestimate it for reasons that remain to be clarified. Concerning the Weyl physics in MoTe2, the displacement of the bands, introduced here to explain our observations based on the guidance provided by previous ARPES studies, would eliminate the crossings between the electron- and the hole-bands as shown in Fig. 7(a). Finally, Figs. 7(b) to 7(g) display the geometry of the Fermi surface resulting from the shifted bands. Overall, the FS displays a distinctly more marked three-dimensional character, with the electrons and the-hole pockets remaining well-separated in k-space. This three-dimensionality is consistent with the observations of Ref. ARPES_Jiang, which finds that the electronic bands do disperse along the direction implying that MoTe2 cannot be considered a van der Waals coupled solid. Notice that DFT tends to underestimate the inter-planar coupling in weakly coupled compounds which is at the heart of the disagreement between the calculations and our observations.
IV Conclusions
In conclusion, quantum oscillatory phenomena reveal that the geometry of the Fermi surface of MoTe2 is quite distinct from the one predicted by previous electronic band-structure calculations. Our low-temperature structural analysis via synchrotron X-ray diffraction measurements indicates the absence of an additional structural transition below the monoclinic to orthorhombic one that would explain this disagreement, while heat-capacity measurements provide no evidence for an electronic phase-transition upon cooling. In contrast, a direct comparison between DFT calculations and the band-structure reported by angle resolved photoemission spectroscopy reveals a disagreement on the position of the valence bands relative to the Fermi-level, with the experimental valence bands shifted by meV relative to the DFT ones. Therefore, one should be careful concerning the claims of a broad agreement between the calculations and the electronic bands revealed by ARPES measurements ARPES_Huang ; ARPES_Deng ; ARPES_Jiang ; ARPES_Liang ; ARPES_Xu ; ARPES_Tamai .
Here, we show that it is possible to describe the angular-dependence of the observed de Haas-van Alphen Fermi surface cross-sectional areas by shifting the position of the DFT bands relative to the Fermi level as indicated by ARPES. However, with this adjustment, the Weyl points, which result from band-crossings that are particularly sensitive to small changes in the lattice constants, are no longer present in the band-structure of MoTe2. Although our approach of modifying the band structure in order to obtain an agreement with both ARPES and de Haas-van Alphen experiments has only a phenomenological basis, our findings do shed a significant doubt on the existence of the Weyl points in the electronic band structure of MoTe2.
Finally, this study combined with the ARPES results in Ref. daniel2, , indicate that there ought to be a Lifshitz-transition wu upon W doping in the Mo1-xWxTe2 series, leading to the disappearance of the central hole pockets in MoTe2 in favor of the emergence of hole-pockets at either side of the point in Mo1-xWxTe2.
Acknowledgements.
We acknowledge helpful discussions with R. M. Osgood and A. N. Pasupathy. J.Y.C. is supported by NSF-DMR-1360863. L. B. is supported by DOE-BES through award DE-SC0002613 for experiments under high magnetic fields and at very low temperatures, and by the U.S. Army Research Office MURI Grant W911NF-11-1-0362 for the synthesis and physical characterization of two-dimensional materials and their heterostructures. We acknowledge the support of the HLD-HZDR, member of the European Magnetic Field Laboratory (EMFL). Research conducted at the Cornell High Energy Synchrotron Source (CHESS) is supported by the NSF & NIH/NIGMS via NSF award DMR-1332208. The NHMFL is supported by NSF through NSF-DMR-1157490 and the State of Florida.References
- (1) X. F. Qian, J. W. Liu , L. Fu, and J. Li, Quantum spin Hall effect in two-dimensional transition metal dichalcogenides, Science 346, 1344 (2014).
- (2) D. Pesin, and A. H. MacDonald, Spintronics and pseudospintronics in graphene and topological insulators, Nat. Mater. 11, 409-416 (2012).
- (3) M. Chhowalla, H. S. Shin, G. Eda, L. -J. Li, K. P. Loh, and H. Zhang, The chemistry of two-dimensional layered transition metal dichalcogenide nanosheets, Nat. Chem. 5, 263-275 (2013).
- (4) S. Z. Butler, S. M. Hollen, L. Cao, Y. Cui, J. A. Gupta, H. R. Gutiérrez, T. F. Heinz, S. S. Hong, J. Huang, A. F. Ismach, E. Johnston-Halperin, M. Kuno, V. V. Plashnitsa, R. D. Robinson, R. S. Ruoff, S. Salahuddin, J. Shan, L. Shi, M. G. Spencer, M. Terrones, W. Windl and J. E. Goldberger, Progress, Challenges, and Opportunities in Two-Dimensional Materials Beyond Graphene, ACS Nano 7, 2898-2926 (2013).
- (5) M. N. Ali, J. Xiong, S. Flynn, J. Tao, Q. D. Gibson, L. M. Schoop, T. Liang, N. Haldolaarachchige, M. Hirschberger, N. P. Ong and R. J. Cava, Large, non-saturating magnetoresistance in WTe2, Nature 514, 205-208 (2014).
- (6) D. H. Keum, S. Cho, J. H. Kim, D. -H. Choe, H. -J. Sung, M. Kan, H. Kang, J. -Y. Hwang, S. W. Kim, H. Yang, K. J. Chang and Y. H. Lee, Bandgap opening in few-layered monoclinic MoTe2, Nat. Phys. 11, 482-486 (2015).
- (7) H. Y. Lv, W. J. Lu, D. F. Shao, Y. Liu, S. G. Tan, and Y. P. Sun, Perfect charge compensation in WTe2 for the extraordinary magnetoresistance: From bulk to monolayer, EPL 110, 37004 (2015).
- (8) L. Wang, I. Gutiérrez-Lezama, C. Barreteau, N. Ubrig, E. Giannini, and A. F. Morpurgo, Tuning magnetotransport in a compensated semimetal at the atomic scale, Nat. Commun. 6, 8892 (2015).
- (9) Z. Fei, T. Palomaki, S. Wu, W. Zhao, X. Cai, B. Sun, P. Nguyen, J. Finney, X. Xu, and D. H. Cobden, Edge conduction in monolayer WTe2, Nat. Phys. 13, 677 (2017).
- (10) A. A. Soluyanov, D. Gresch, Z. Wang, Q. Wu, M. Troyer, X. Dai and B. A. Bernevig, A New Type of Weyl Semimetals, Nature 527, 495-498 (2015).
- (11) Y. Sun, S.C. Wu, M. N. Ali, C. Felser, and B. Yan, Prediction of the Weyl semimetal in the orthorhombic MoTe2, Phys. Rev. B 92, 161107 (2015).
- (12) Z. Wang, D. Gresch, A. A. Soluyanov, W. Xie, S. Kushwaha, X. Dai, M. Troyer, R. J. Cava, and B. A. Bernevig, MoTe2: A Type-II Weyl Topological Metal, Phys. Rev. Lett. 117, 056805 (2016).
- (13) T. R. Chang, S. -Y. Xu, G. Chang, C. -C. Lee, S. -M. Huang, B. Wang, G. Bian, H. Zheng, D. S. Sanchez, I. Belopolski, N. Alidoust, M. Neupane, A. Bansil, H. -T. Jeng, H. Lin, and M. Z. Hasan, Prediction of an arc-tunable Weyl Fermion metallic state in MoxW1-xTe2, Nat. Commun. 7, 10639 (2016).
- (14) H. M. Weng, C. Fang, Z. Fang, B. A. Bernevig, and X. Dai, Weyl Semimetal Phase in Noncentrosymmetric Transition-Metal Monophosphides, Phys. Rev. X 5, 011029 (2015).
- (15) S. Y. Xu, I. Belopolski, N. Alidoust, M. Neupane, G. Bian, C. Zhang, R. Sankar, G. Chang, Z. Yuan, C. -C. Lee, S. -M. Huang, H. Zheng, J. Ma, D. S. Sanchez, B. Wang, A. Bansil, F. Chou, P. P. Shibayev, H. Lin, S. Jia, M. Z. Hasan, Discovery of a Weyl fermion semimetal and topological Fermi arcs, Science 349, 613-617 (2015).
- (16) L. Huang, T. M. McCormick, M. Ochi, Z. Zhao, M. -T. Suzuki, R. Arita, Y. Wu, D. Mou, H. Cao, J. Yan, N. Trivedi, and A. Kaminski, Spectroscopic evidence for type II Weyl semimetal state in MoTe2, Nat. Mater. 15, 1155-1160 (2016).
- (17) K. Deng, G. Wan, P. Deng, K. Zhang, S. Ding, E. Wang, M. Yan, H. Huang, H. Zhang, Z. Xu, J. Denlinger, A. Fedorov, H. Yang, W. Duan, H. Yao, Y. Wu, S. Fan, H. Zhang, X. Chen and S. Zhou, Experimental observation of topological Fermi arcs in type-II Weyl semimetal MoTe2, Nat. Phys. 12, 1105 (2016).
- (18) J. Jiang, Z. K. Liu, Y. Sun, H. F. Yang, R. Rajamathi, Y. P. Qi, L. X. Yang, C. Chen, H. Peng, C. -C. Hwang, S. Z. Sun, S. -K. Mo, I. Vobornik, J. Fujii, S. S. P. Parkin, C. Felser, B. H. Yan, Y. L. Chen, Observation of the Type-II Weyl Semimetal Phase in MoTe2, Nat. Commun. 8, 13973 (2017).
- (19) A. Liang, J. Huang, S. Nie, Y. Ding, Q. Gao, C. Hu, S. He, Y. Zhang, C. Wang, B. Shen, J. Liu, P. Ai, L. Yu, X. Sun, W. Zhao, S. Lv, D. Liu, C. Li, Y. Zhang, Y. Hu, Y. Xu, L. Zhao, G. Liu, Z. Mao, X. Jia, F. Zhang, S. Zhang, F. Yang, Z. Wang, Q. Peng, H. Weng, X. Dai, Z. Fang, Z. Xu, C. Chen, X. J. Zhou, Electronic Evidence for Type II Weyl Semimetal State in MoTe2, arXiv:1604.01706 (2016).
- (20) N. Xu, Z. J. Wang, A. P. Weber, A. Magrez, P. Bugnon, H. Berger, C. E. Matt, J. Z. Ma, B. B. Fu, B. Q. Lv, N. C. Plumb, M. Radovic, E. Pomjakushina, K. Conder, T. Qian, J. H. Dil, J. Mesot, H. Ding, M. Shi, Discovery of Weyl semimetal state violating Lorentz invariance in MoTe2, arXiv:1604.02116 (2016).
- (21) A. Tamai, Q. S. Wu, I. Cucchi, F. Y. Bruno, S. Ricco, T. K. Kim, M. Hoesch, C. Barreteau, E. Giannini, C. Bernard, A. A. Soluyanov, F. Baumberger, Fermi arcs and their topological character in the candidate type-II Weyl semimetal MoTe2, Phys. Rev. X 6, 031021 (2016), and references therein.
- (22) I. Belopolski, D. S. Sanchez, Y. Ishida, X. C. Pan, P. Yu, S. Y. Xu, G. Q. Chang, T. R. Chang, H. Zheng, N. Alidoust, G. Bian, M. Neupane, S. M. Huang, C. C. Lee, Y. Song, H. Bu, G. Wang, S. Li, G. Eda, H.-T. Jeng, T. Kondo, H. Lin, Z. Liu, F. Song, S. Shin and M. Z. Hasan, Discovery of a new type of topological Weyl fermion semimetal state in MoxW1-xTe2, Nat. Commun. 7, 13643 (2016).
- (23) S. Thirupathaiah, R. Jha, B. Pal, J. S. Matias, P. K. Das, P. K. Sivakumar, I. Vobornik, N. C. Plumb, M. Shi, R. A. Ribeiro, and D. D. Sarma, MoTe2: An uncompensated semimetal with extremely large magnetoresistance, Phys. Rev. B 95, 241105(R) (2017).
- (24) W. Kabsch, XDS, Acta Cryst. D66, 125 (2010).
- (25) G. M. Sheldrick, A short history of SHELX, Acta Cryst. A 64, 112 (2008).
- (26) See supplemental material at http://link.aps.org/
- (27) Y. Qi, P. G. Naumov, M. N. Ali, C. R. Rajamathi, W. Schnelle, O. Barkalov, M. Hanfland, S. -C. Wu, C. Shekhar, Y. Sun, V. Süß, M. Schmidt, U. Schwarz, E. Pippel, P. Werner, R. Hillebrand, T. Förster, E. Kampert, S. Parkin, R. J. Cava, C. Felser, B. Yan and S. A. Medvedev, Superconductivity in Weyl semimetal candidate MoTe2, Nat. Commun. 7, 11038 (2016).
- (28) Q. Zhou, D. Rhodes, Q. R. Zhang, S. Tang, R. Schönemann, and L. Balicas, Hall effect within the colossal magnetoresistive semimetallic state of MoTe2, Phys. Rev. B 94, 121101(R) (2016).
- (29) A. P. Mackenzie, R. K. W. Haselwimmer, A. W. Tyler, G. G. Lonzarich, Y. Mori, S. Nishizaki, and Y. Maeno, Extremely strong dependence of superconductivity on disorder in Sr2RuO4, Phys. Rev. Lett. 80, 161-164 (1998).
- (30) S. Nakatsuji, K. Kuga, Y. Machida, T. Tayama, T. Sakakibara, Y. Karaki, H. Ishimoto, S. Yonezawa, Y. Maeno, E. Pearson, G. G. Lonzarich, L. Balicas, H. Lee and Z. Fisk, Superconductivity and quantum criticality in the heavy-fermion system beta-YbAlB4, Nat. Phys. 4, 603-607 (2008).
- (31) M. Tsujimoto, Y. Matsumoto, T. Tomita, A. Sakai, S. Nakatsuji, Heavy-Fermion Superconductivity in the Quadrupole Ordered State of PrV2Al20, Phys. Rev. Lett. 113, 267001 (2014).
- (32) A. P. Mackenzie, and Y. Maeno, The superconductivity of Sr2RuO4 and the physics of spin-triplet pairing, Rev. Mod. Phys. 75, 657-712 (2003).
- (33) I. Pletikosić, M. N. Ali, A. V. Fedorov, R. J. Cava, and T. Valla, Electronic Structure Basis for the Extraordinary Magnetoresistance in WTe2, Phys. Rev. Lett. 113, 216601 (2014).
- (34) A. B. Pippard, Magnetoresistance in Metals (Cambridge University, Cambridge, 1989).
- (35) D. Rhodes, S. Das, Q. R. Zhang, B. Zeng, N. R. Pradhan, N. Kikugawa, E. Manousakis, and L. Balicas, Role of spin-orbit coupling and evolution of the electronic structure of WTe2 under an external magnetic field, Phys. Rev. B 92, 125152 (2015).
- (36) Y. Luo, H. Li, Y. M. Dai, H. Miao, Y. G. Shi, H. Ding, A. J. Taylor, D. A. Yarotski, R. P. Prasankumar, and J. D. Thompson, Hall effect in the extremely large magnetoresistance semimetal WTe2, Appl. Phys. Lett. 107, 182411 (2015).
- (37) D. Kang, Y. Zhou, W. Yi, C. Yang, J. Guo, Y. Shi, S. Zhang, Z. Wang, C. Zhang, S. Jiang, A. Li, K. Yang, Q. Wu, G. Zhang, L. Sun and Z. Zhao Superconductivity emerging from a suppressed large magnetoresistant state in tungsten ditelluride, Nat. Commun. 6, 7804 (2015).
- (38) Y. L. Wang, K. F. Wang, J. Reutt-Robey, J. Paglione, and M. S. Fuhrer, Breakdown of compensation and persistence of nonsaturating magnetoresistance in gated WTe2 thin flakes, Phys. Rev. B 93, 121108 (2016).
- (39) Z. Zhu, X. Lin, J. Liu, B. Fauqué, Q. Tao, C. Yang, Y. Shi, and K. Behnia, Quantum Oscillations, Thermoelectric Coefficients, and the Fermi Surface of Semimetallic WTe2, Phys. Rev. Lett. 114, 176601 (2015).
- (40) Y. B. Zhang, Y. W. Tan, H. L. Stormer, P. Kim, Experimental observation of the quantum Hall effect and Berry’s phase in graphene, Nature 438, 201-204 (2005).
- (41) H. Murakawa, M. S. Bahramy, M. Tokunaga, Y. Kohama, C. Bell, Y. Kaneko, N. Nagaosa, H. Y. Hwang, Y. Tokura, Detection of Berry’s Phase in a Bulk Rashba Semiconductor, Science 342, 1490-1493 (2013).
- (42) I. A. Luk’yanchuk, and Y. Kopelevich, Phase Analysis of Quantum Oscillations in Graphite, Phys. Rev. Lett. 93, 166402 (2004).
- (43) P. Giannozzi, S. Baroni, N. Bonini, M. Calandra, R. Car, C. Cavazzoni, D. Ceresoli, G. L. Chiarotti, M. Cococcioni, I. Dabo, A. Dal Corso, S. de Gironcoli, S. Fabris, G. Fratesi, R. Gebauer, U. Gerstmann, C. Gougoussis, A. Kokalj, M. Lazzeri, L. Martin-Samos, N. Marzari, F. Mauri, R. Mazzarello, S. Paolini, A. Pasquarello, L. Paulatto, C. Sbraccia, S. Scandolo, G. Sclauzero, A. P. Seitsonen, A. Smogunov, P. Umari and R. M. Wentzcovitch, QUANTUM ESPRESSO: a modular and open-source software project for quantum simulations of materials, J. Phys.: Condens. Matter 21, 395502 (2009).
- (44) J. P. Perdew, K. Burke, M. Ernzerhof, Generalized Gradient Approximation Made Simple, Phys. Rev. Lett. 77, 3865-3868 (1996).
- (45) D. R. Hamann, Optimized norm-conserving Vanderbilt pseudopotentials, Phys. Rev. B 88, 085117 (2013).
- (46) A. Kokalj, Computer graphics and graphical user interfaces as tools in simulations of matter at the atomic scale, Comp. Mater. Sci. 28, 155-168 (2003). Code available at http://www.xcrysden.org/.
- (47) P. M. C. Rourke, and S. R. Julian, Numerical extraction of de Haas-van Alphen frequencies from calculated band energies, Comp. Phys. Commun. 183, 324 (2012).
- (48) H. -J. Kim, S. -H. Kang, I. Hamada, and Y. -W. Son, Origins of the structural phase transitions in MoTe2 and WTe2, Phys. Rev. B 95, 180101(R) (2017).
- (49) D. Rhodes, D. A. Chenet, B. E. Janicek, C. Nyby, Y. Lin, W. Jin, D. Edelberg, E. Mannebach, N. Finney, A. Antony, T. Schiros, T. Klarr, A. Mazzoni, M. Chin, Y. -c. Chiu, W. Zheng, Q. R. Zhang, F. Ernst, J. I. Dadap, X. Tong, J. Ma, R. Lou, S. Wang, T. Qian, H. Ding, R. M. Osgood, Jr, D. W. Paley, A. M. Lindenberg, P. Y. Huang, A. N. Pasupathy, M. Dubey, J. Hone, and L. Balicas, Engineering the structural and electronic phases of MoTe2 through W substitution, Nano Lett. 17, 1616 (2017).
- (50) Y. Wu, N. H. Jo, M. Ochi, L. Huang, D. Mou, S. L. Bud’ko, P. C. Canfield, N. Trivedi, R. Arita, and A. Kaminski, Temperature induced Lifshitz transition in WTe2, Phys. Rev. Lett. 115, 166602 (2015).