Protoplanetary disks in the hostile environment of Carina
Abstract
We report the first direct imaging of protoplanetary disks in the star-forming region of Carina, the most distant, massive cluster in which disks have been imaged. Using the Atacama Large Millimeter/sub-millimeter Array (ALMA), disks are observed around two young stellar objects (YSOs) that are embedded inside evaporating gaseous globules and exhibit jet activity. The disks have an average size of 120 AU and total masses of 30 and 50 . Given the measured masses, the minimum timescale required for planet formation ( Myr) and the average age of the Carina population ( Myr), it is plausible that young planets are present or their formation is currently ongoing in these disks. The non-detection of millimeter emission above the 4 threshold () in the core of the massive cluster Trumpler 14, an area containing previously identified proplyd candidates, suggest evidence for rapid photo-evaporative disk destruction in the cluster’s harsh radiation field. This would prevent the formation of giant gas planets in disks located in the cores of Carina’s dense sub-clusters, whereas the majority of YSO disks in the wider Carina region remain unaffected by external photo-evaporation.
Subject headings:
stars: formation – stars: protostars – protoplanetary disks – techniques: interferometric – techniques: high angular resolution1. Introduction
It is generally accepted that most stars are born in dense clusters (Blaauw, 1964; Lada & Lada, 2003), where massive and low-mass stars co-exist and evolve. In these regions, the far ultraviolet (FUV) and extreme ultraviolet (EUV) radiation from the most massive stars can curtail disk lifetimes of the low-mass protostars via external photo-evaporation, caused by the heating and dissociating effects of ionizing radiation (e.g. Johnstone et al., 1998; Adams et al., 2004; Clarke, 2007; Gorti et al., 2015). Depending on the intensity and the duration of the exposure, photo-evaporation by external irradiation can potentially lead to disk dispersal on timescales shorter than the minimum Myr required for planet formation (Hubickyj et al., 2005; Lissauer et al., 2009; Najita & Kenyon, 2014; ALMA Partnership et al., 2015). Although internal photo-evaporation due to FUV and x-ray radiation from the protostar itself may be important, this effect generally acts on longer timescales of about Myr (e.g. Owen et al., 2012; Gorti et al., 2015). Understanding the impact of external photo-evaporation on disks within massive clusters is key to assessing their chances for survival and their planet-formation capacity.
Richert et al. (2015) found no evidence for significant disk dispersal by analyzing YSOs in a large sample of stellar associations. Due to stellar crowding and/or PAH contamination, their analysis is inconclusive for the cores of the massive clusters in Orion, M 17, and Carina, exactly where external photo-evaporation could be important. A clear example is Orion’s rich population of proplyds (O’Dell et al., 1993), where millimeter observations show that disks have been eroded down to within 0.03 pc from the Trapezium cluster (e.g. Eisner et al., 2008; Mann & Williams, 2010; Mann et al., 2014).
Whereas the Orion nebula is dominated by a single O7V-type star ( Ori C; Simón-Díaz et al., 2006), the Carina nebula, at a distance of kpc (Smith & Brooks, 2008, hereinafter SB08), hosts nearly one hundred O-type stars and tens of thousands of lower-mass young stars (Povich et al., 2011a, b; Preibisch et al., 2011a, b). The clusters Trumpler (Tr) 14 and 16 have ultraviolet (UV) luminosities about 20 and 60 times higher than Ori C, and they are home of the most massive and luminous stars in the Galaxy (see review by SB08). As a prototype of massive star-forming regions in our Galaxy, Carina is ideally suited to an investigation of disk evaporation: its older age ( Myr; SB08) could allow enough time for a deeper action of the external photo-evaporation process, especially in the core of the massive clusters.
In this Letter, we present novel observations with the Atacama Large Millimeter/sub-millimeter Array (ALMA) of YSO disks in Carina and investigate the implications for disk survival in the face of external photo-evaporation.
2. Observations and data reduction
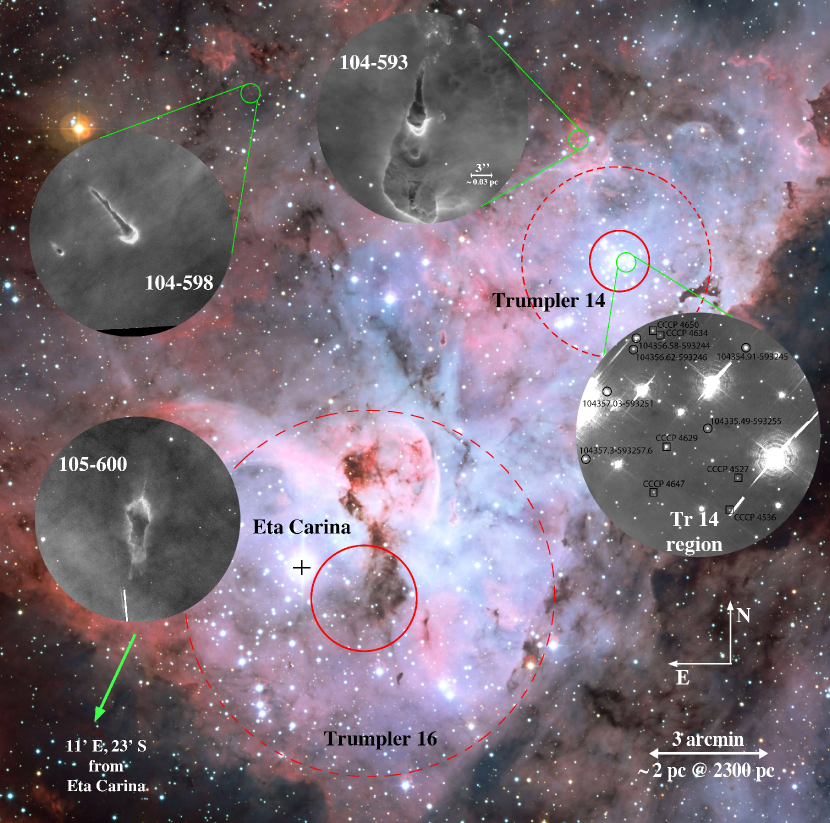
We observed four regions covering a range of separations from Tr 16 and Tr 14, centered on sources identified by Smith et al. (2003) as potential protoplanetary disks (see Fig. 1). We focused on the evaporating gas globules (EGGs) named as 104-593, 105-600 (frEGG-1; Sahai et al., 2012), and 104-598, as well as a section of the Tr 14 core that contains the best candidates for bona fide proplyds in Carina (Smith et al., 2010).
| Positiona | Flux Densityb | Spectralc | De-convolved Sized | Disk Masse | |||||
|---|---|---|---|---|---|---|---|---|---|
| 229 GHz | Index | Major | Minor | P.A. | 40 K | 20 K | |||
| Source | (h m s) | (∘ ′ ′′) | (mJy) | (milli-arcsecond) | ( ∘) | ( | |||
| 104-593 | 10 44 05.360 | 59 29 40.77 | 2.9 | ||||||
| 105-600 | 10 46 32.905 | 60 03 53.67 | 2.5 | 62 | |||||
| 104-598 | 10 45 14.200 | 59 28 25.00 | – | – | – | – | |||
| Tr 14 region | 10 43 55.490 | 59 32 55.00 | – | – | – | – | |||
The observations were performed on 2015 October 27 as part of the Cycle 3 program 2015.1.01323.S. We used 45 of the 12-m antennas, yielding baselines with projected lengths from 21 to m. The positions of the phase centers of each pointing are given in Table 1. Continuum images were obtained in Band 6, with integration times of 160 s and a frequency coverage of GHz within a primary beam with a full width half maximum of about . The digital correlator was configured to four wide spectral windows in dual polarization mode centered at GHz, GHz, GHz, and GHz (average frequency of GHz, corresponding to mm). The effective bandwidth for the 223 and 234 GHz spectral windows was 2000 MHz, and 938 MHz for the 220 and 237 GHz windows. The weather conditions were very good and stable, with an average precipitable water vapor of 1.06 mm and system temperature of 60 to 200 K. The ALMA calibration included simultaneous observations of the 183 GHz water line with water vapor radiometers, used to reduce the atmospheric phase noise. Quasars J11074449 and J10496003 were used to calibrate the bandpass and the gain fluctuations, respectively.
Data reduction was performed using the Common Astronomy Software Applications package (CASA 4.2.2; McMullin et al., 2007). Imaging of the calibrated visibilities was done using the task clean. The resulting root-mean-square noise for the continuum emission () was about 6 Jy at an angular resolution of with a position angle (P.A.) of . We thus resolve structures with physical sizes larger than 70 AU 45 AU, or roughly the size of the Solar System. In deriving the integrated fluxes, we used a Briggs robustness parameter of 0.5 in the clean task to obtain a better signal-to-noise ratio at the cost of losing some spatial resolution. We averaged all line-free channels in the four spectral windows for the construction of the 1.3 mm continuum images.
3. Disks within Carina’s EGGs
In 104-593 and 105-600 we detect disks embedded within the core of the optically opaque EGGs (Fig. 2). Table 1 gives the sizes and integrated fluxes of the disks determined with the gaussfit task of CASA from a natural-weighted image and within a box centered on the detection. The disks have peak signals about and , and both are marginally resolved with an average de-convolved size of AU 70 AU. Assuming a geometrically thin, circular disk, a radius of AU is implied in both cases, inclined at to the line of sight.
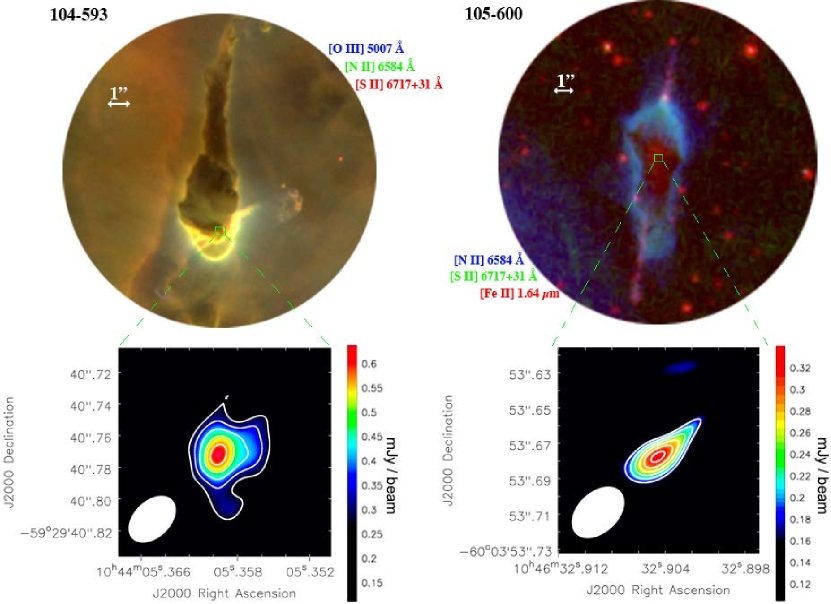
The disk nature of these ALMA detections is further supported by association with mid-infrared sources (Povich et al., 2011a). Our positions match the YSOs PCYC 429 for 104-593 and PCYC 1173 for 105-600 within the errors; these are Herbig AeBe stars with masses of and , respectively. The mid-infrared spectra of both targets imply that they are Class 0/I sources, indicating that they still retain a massive envelope (Povich et al., 2011a; Reiter & Smith, 2013). Evidence for ongoing accretion onto the protostars is provided by the collimated outflows emerging from both systems in the form of Herbig-Haro objects (Smith et al., 2010; Reiter & Smith, 2013). The spatial distribution of the bipolar outflows also corroborates the disk nature of the sources since the disks are located at the origin of each outflow, and their major axes are aligned almost perpendicular to them (Fig. 2). In the case of 105-600, the presence of an hourglass-shaped near-infrared reflection nebula is additional evidence for a rotationally flattened envelope or disk (Sahai et al., 2012).
By comparing the density fluxes between the spectral windows at 220 GHz and 237 GHz, spectral indices higher than 2 are determined for the two sources, implying that the observed emission is most likely produced by dust grains (see Table 1). Assuming that the dust is optically thin and isothermal (Hildebrand, 1983), these indices suggest that the grains have grown to larger sizes than are seen in interstellar medium dust (Ossenkopf & Henning, 1994), consistent with expectations for grain evolution in the mid-plane of evolved, settled disks (Acke et al., 2004).
The total disk mass () can be derived under the same assumptions, being proportional to the mm flux density :
| (1) |
where is the distance to Carina, is the Planck function at the dust temperature , and is the absorption coefficient per unit of total (gas dust) mass density. The estimated values for the total masses associated with the dust continuum emission are presented in Table 1. We have used a dust mass opacity cm2 g-1 (Ossenkopf & Henning, 1994, assuming a 100:1 gas-to-dust mass ratio) and K, as appropriate for disks around intermediate mass stars (e.g. Natta et al., 2000). For the brighter of the two sources, 104-593, the peak observed flux density of approximately 0.6 mJy/beam is roughly equal to the 230 GHz Planck function at 40 K, implying that the central parts of the disk may be optically thick, leading to the true masses being underestimated. The mass estimates are uncertain within a factor of a few due to potential deviations of the dust opacity from our adopted value, depending on the degree of grain growth within the disk, plus uncertainties in the dust temperature (see Table 1).
We derive masses of about 50 and 30 for 104-593 and 105-600, respectively. These masses are on the upper end of the typical Mdisk distribution found in Class I sources in less hostile environments as Taurus, Ophiuchus, and Orion (e.g. Andrews & Williams, 2007; Eisner & Carpenter, 2006; Williams et al., 2013; Andrews et al., 2013; Carpenter et al., 2014; Mann et al., 2014; Cieza et al., 2015). The disks can be considered protoplanetary because the measured masses are well above the minimum of about required for a pre-solar nebula to develop a planetary system (Weidenschilling, 1977). Additionally, the average age of the Carina population ( Myr; SB08) perfectly fits the required minimum timescale to form planets ( Myr; see §1). Planet formation may also occur on shorter scales in Herbig systems (Mendigutía et al., 2012) so it is plausible that young planets are forming or already present within these EGGs.
No millimeter emission was detected above the threshold within either the 104-598 or the Tr 14 fields, yielding an upper limit of to the mass of any disk that might be present (see Table 1). In the case of 104-598, no infrared source is detected (Povich et al., 2011a; Preibisch et al., 2011a), implying that the EGG does not (yet) contain a YSO. Similar starless EGGs are seen in the Cygnus OB2 (Wright et al., 2012) and are especially common in M 16 (Hester et al., 1996; McCaughrean & Andersen, 2002).
In the Tr 14 region, a total of 12 YSOs are found among candidate proplyds (Ascenso et al., 2007; Smith et al., 2010) and sources with near-infrared excess (Preibisch et al., 2011a). Unfortunately, half of them are located near the field edge where the sensitivity is lower (Fig. 1). These YSO disks must be much less massive than those detected in 104-593 and 105-600. If the disks were warmer than 40 K (which may well be the case due to external heating from the nearby massive stars), then the limit would be even lower than , being roughly similar to the median mass of for Class II disks (e.g. Andrews & Williams, 2005; Eisner, 2012). According to the Mdisk distribution in low-mass star-forming regions (e.g. Williams & Cieza, 2011), we expected to detect about half of the YSOs above the threshold. The high flux of ionizing and dissociating radiation produced by the massive members of Tr 14 might explain why we have not detected massive disks in this field.
4. Photo-evaporation of Disks and EGGs
Theoretical values of the disk mass photo-evaporation rate can depend on the strength of the illuminating radiation field, the disk size and YSO mass, whether it is non-ionizing FUV or ionizing EUV radiation that controls the evaporation (e.g. Johnstone et al., 1998). In the simple case of EUV radiation (), the incident photon flux balances the recombination rate per unit area in the evaporation flow plus the hydrogen ion flux through the ionization front, allowing us to estimate:
| (2) |
A sufficient flux of FUV radiation (from to ) can increase the global via a warm atomic disk wind, which inflates the ionization front to several times (e.g. Johnstone et al., 1998). The physics of FUV evaporation is less well understood and can depend on the rate of viscous spreading of the disk (Anderson et al., 2013). It is most efficient in the supercritical case (see Adams et al., 2004) when the sound speed in the neutral wind exceeds the gravitational escape speed from the disk, requiring or if , where is the mean FUV field in the solar neighborhood.
For the Tr 14 region, where we do not detect any disks, the conditions are certainly extreme. The cluster has an UV luminosity of (SB08), implying and . The alone then gives for , and FUV radiation would likely increase this by factors of 2–4. The corresponding evaporation timescale is then as short as years for an initial disk mass of . Photo-evaporation becomes inefficient once the disk shrinks to a radius , where the escape velocity is of the order of the ionized sound speed. If (corresponding to a surface density profile ) then the disk mass in this phase will be . Thus, centrally condensed disks may persist in the core of Tr 14 with compact sizes (AU) and low masses ().
Similar timescales are found by simply scaling results from the Orion proplyds, where empirical estimates of have a median value year (Henney & O’Dell, 1999; Tsamis et al., 2013). From equation (2), the for Tr 14 and Tr 16 would predict for a AU within radii of pc and pc, respectively. These EUV-irradiation zones are shown in Fig. 1 (solid red circles), although for Tr 16 the picture is more complex than indicated because the high-mass stars are spread over (Povich et al., 2011b). Adding the FUV contribution, the irradiation zones become larger (dashed-red circles in Fig. 1 from the condition ). Any disk remaining in these areas for 1 Myr will have lost approximately . For disks with initial masses and sizes similar to our detected sources, this would be more than sufficient to shrink them below our detection limit.
Analogous physics operates in the evaporation of EGGs. The EUV controls in this case, since the FUV-heated layer is thin compared with the EGG radius. Assuming a roughly spherical shape, 105-600 has a radius of and is located at a projected distance of 17 pc from Tr 16, which has a of (SB08). If the true distance is not much greater than the projected one, then the incident flux is , implying . Within a factor of two, the same result is derived from the H surface brightness of the globule’s bright rim (measured on the images from the Advanced Camera for Surveys; Smith et al., 2010), which gives a model-independent estimate of , albeit subject to uncertainties in the foreground dust extinction. The EGG mass is estimated as – (Sahai et al., 2012), leading to a timescale of approximately 1 Myr. For 104-593, the EGG has a similar size, but is found at a projected distance of 3.3 pc from Tr 14, resulting in a larger ionizing flux . No mass estimate is available for this EGG, but if it were similar to 105-600, then it would be evaporated in about years.
Once the EGGs have been dispersed, then the disks themselves will be subject to external photo-evaporation. Taking our observed parameters of and , we find of to , corresponding to timescales of 5 to 50 Myr for the two disks. The FUV fluxes at the detected disk positions are weak: for 104-593 and for 105-600, resulting in a relatively cool neutral wind () that would have difficulty escaping the stellar gravitational potential. Thus, the EUV-derived timescales are accurate if the systems do not move significantly from their current position.
5. Conclusions
High spatial resolution observations at millimeter wavelengths with ALMA allow us to overcome the problem of stellar crowding in the densely-populated centre of Tr 14. Therefore, given the number of YSO sources within our observed field (Fig. 1), the non-detection of any disks in the exposed core of the cluster is evidence for accelerated disk dispersal. This is consistent with the disk fraction, as measured by the near-infrared excess emission among x-ray selected YSOs in Carina, being significantly smaller than in lower mass clusters of a similar age (Preibisch et al., 2011a).
Roughly 50% of the YSO population in Carina is found in sparse small groups that are widely distributed over an area of several square parsecs (Preibisch et al., 2011b; Zeidler et al., 2016). The newly detected Carina disks belong to this distributed population, and are both located at larger distances from the ionizing sources, where external evaporation will not threaten their survival over the next 10 million years. Disk formation and evolution in most of these YSOs will probably proceed similarly to those in less massive clusters, and planetary formation should occur without being severely affected by the cluster environment (Richert et al., 2015). Only the more clustered YSOs will experience significant external photo-evaporation. The lack of disks more massive than about in this sub-population will potentially affect the formation of planetary systems similar to the Solar system, mostly preventing the building-up of gas giant planets.
References
- Acke et al. (2004) Acke, B., van den Ancker, M. E., Dullemond, C. P., van Boekel, R., & Waters, L. B. F. M. 2004, A&A, 422, 621
- Adams et al. (2004) Adams, F. C., Hollenbach, D., Laughlin, G., & Gorti, U. 2004, ApJ, 611, 360
- ALMA Partnership et al. (2015) ALMA Partnership, Brogan, C. L., Pérez, L. M., Hunter, T. R., Dent, W. R. F., et al. 2015, ApJ, 808, L3
- Anderson et al. (2013) Anderson, K. R., Adams, F. C., & Calvet, N. 2013, ApJ, 774, 9
- Andrews et al. (2013) Andrews, S. M., Rosenfeld, K. A., Kraus, A. L., & Wilner, D. J. 2013, ApJ, 771, 129
- Andrews & Williams (2005) Andrews, S. M. & Williams, J. P. 2005, ApJ, 631, 1134
- Andrews & Williams (2007) —. 2007, ApJ, 671, 1800
- Ascenso et al. (2007) Ascenso, J., Alves, J., Vicente, S., & Lago, M. T. V. T. 2007, A&A, 476, 199
- Blaauw (1964) Blaauw, A. 1964, ARA&A, 2, 213
- Carpenter et al. (2014) Carpenter, J. M., Ricci, L., & Isella, A. 2014, ApJ, 787, 42
- Cieza et al. (2015) Cieza, L., Williams, J., Kourkchi, E., Andrews, S., Casassus, S., Graves, S., & Schreiber, M. R. 2015, MNRAS, 454, 1909
- Clarke (2007) Clarke, C. J. 2007, MNRAS, 376, 1350
- Eisner (2012) Eisner, J. A. 2012, ApJ, 755, 23
- Eisner & Carpenter (2006) Eisner, J. A. & Carpenter, J. M. 2006, ApJ, 641, 1162
- Eisner et al. (2008) Eisner, J. A., Plambeck, R. L., Carpenter, J. M., Corder, S. A., Qi, C., & Wilner, D. 2008, ApJ, 683, 304
- Gorti et al. (2015) Gorti, U., Liseau, R., Sandor, Z., & clarke, C. 2015, ArXiv e-prints
- Henney & O’Dell (1999) Henney, W. J. & O’Dell, C. R. 1999, AJ, 118, 2350
- Hester et al. (1996) Hester, J. J., Scowen, P. A., Sankrit, R., Lauer, T. R., Ajhar, E. A., et al. 1996, AJ, 111, 2349
- Hildebrand (1983) Hildebrand, R. H. 1983, QJRAS, 24, 267
- Hubickyj et al. (2005) Hubickyj, O., Bodenheimer, P., & Lissauer, J. J. 2005, Icarus, 179, 415
- Johnstone et al. (1998) Johnstone, D., Hollenbach, D., & Bally, J. 1998, ApJ, 499, 758
- Lada & Lada (2003) Lada, C. J. & Lada, E. A. 2003, ARA&A, 41, 57
- Lissauer et al. (2009) Lissauer, J. J., Hubickyj, O., D’Angelo, G., & Bodenheimer, P. 2009, Icarus, 199, 338
- Mann et al. (2014) Mann, R. K., Di Francesco, J., Johnstone, D., Andrews, S. M., Williams, J. P., Bally, J., Ricci, L., Hughes, A. M., & Matthews, B. C. 2014, ApJ, 784, 82
- Mann & Williams (2010) Mann, R. K. & Williams, J. P. 2010, ApJ, 725, 430
- McCaughrean & Andersen (2002) McCaughrean, M. J. & Andersen, M. 2002, A&A, 389, 513
- McMullin et al. (2007) McMullin, J. P., Waters, B., Schiebel, D., Young, W., & Golap, K. 2007, in Astronomical Society of the Pacific Conference Series, Vol. 376, Astronomical Data Analysis Software and Systems XVI, ed. R. A. Shaw, F. Hill, & D. J. Bell, 127
- Mendigutía et al. (2012) Mendigutía, I., Mora, A., Montesinos, B., Eiroa, C., Meeus, G., Merín, B., & Oudmaijer, R. D. 2012, A&A, 543, A59
- Najita & Kenyon (2014) Najita, J. R. & Kenyon, S. J. 2014, MNRAS, 445, 3315
- Natta et al. (2000) Natta, A., Grinin, V., & Mannings, V. 2000, Protostars and Planets IV, 559
- O’Dell et al. (1993) O’Dell, C. R., Wen, Z., & Hu, X. 1993, ApJ, 410, 696
- Ossenkopf & Henning (1994) Ossenkopf, V. & Henning, T. 1994, A&A, 291, 943
- Owen et al. (2012) Owen, J. E., Clarke, C. J., & Ercolano, B. 2012, MNRAS, 422, 1880
- Povich et al. (2011a) Povich, M. S., Smith, N., Majewski, S. R., Getman, K. V., Townsley, L. K., Babler, B. L., Broos, P. S., Indebetouw, R., Meade, M. R., Robitaille, T. P., Stassun, K. G., Whitney, B. A., Yonekura, Y., & Fukui, Y. 2011a, ApJS, 194, 14
- Povich et al. (2011b) Povich, M. S., Townsley, L. K., Broos, P. S., Gagné, M., Babler, B. L., Indebetouw, R., Majewski, S. R., Meade, M. R., Getman, K. V., Robitaille, T. P., & Townsend, R. H. D. 2011b, ApJS, 194, 6
- Preibisch et al. (2011a) Preibisch, T., Hodgkin, S., Irwin, M., Lewis, J. R., King, R. R., McCaughrean, M. J., Zinnecker, H., Townsley, L., & Broos, P. 2011a, ApJS, 194, 10
- Preibisch et al. (2011b) Preibisch, T., Ratzka, T., Kuderna, B., Ohlendorf, H., King, R. R., Hodgkin, S., Irwin, M., Lewis, J. R., McCaughrean, M. J., & Zinnecker, H. 2011b, A&A, 530, A34
- Reiter & Smith (2013) Reiter, M. & Smith, N. 2013, MNRAS, 433, 2226
- Richert et al. (2015) Richert, A. J. W., Feigelson, E. D., Getman, K. V., & Kuhn, M. A. 2015, ApJ, 811, 10
- Sahai et al. (2012) Sahai, R., Güsten, R., & Morris, M. R. 2012, ApJ, 761, L21
- Simón-Díaz et al. (2006) Simón-Díaz, S., Herrero, A., Esteban, C., & Najarro, F. 2006, A&A, 448, 351
- Smith et al. (2003) Smith, N., Bally, J., & Morse, J. A. 2003, ApJ, 587, L105
- Smith et al. (2010) Smith, N., Bally, J., & Walborn, N. R. 2010, MNRAS, 405, 1153
- Smith & Brooks (2008) Smith, N. & Brooks, K. J. 2008, Handbook of Star Forming Regions, Volume II, 138
- Tsamis et al. (2013) Tsamis, Y. G., Flores-Fajardo, N., Henney, W. J., Walsh, J. R., & Mesa-Delgado, A. 2013, MNRAS, 430, 3406
- Weidenschilling (1977) Weidenschilling, S. J. 1977, Ap&SS, 51, 153
- Williams & Cieza (2011) Williams, J. P. & Cieza, L. A. 2011, ARA&A, 49, 67
- Williams et al. (2013) Williams, J. P., Cieza, L. A., Andrews, S. M., Coulson, I. M., Barger, A. J., Casey, C. M., Chen, C.-C., Cowie, L. L., Koss, M., Lee, N., & Sanders, D. B. 2013, MNRAS, 435, 1671
- Wright et al. (2012) Wright, N. J., Drake, J. J., Drew, J. E., Guarcello, M. G., Gutermuth, R. A., Hora, J. L., & Kraemer, K. E. 2012, ApJ, 746, L21
- Zeidler et al. (2016) Zeidler, P., Preibisch, T., Ratzka, T., Roccatagliata, V., & Petr-Gotzens, M. G. 2016, A&A, 585, A49