Estimation of cis-eQTL Effect Sizes Using a Log of Linear Model–LABEL:lastpage \artmonth–
Estimation of cis-eQTL Effect Sizes Using a Log of Linear Model
Abstract
The study of expression Quantitative Trait Loci (eQTL) is an important problem in genomics and biomedicine. While detection (testing) of eQTL associations has been widely studied, less work has been devoted to the estimation of eQTL effect size. To reduce false positives, detection methods frequently rely on linear modeling of rank-based normalized or log-transformed gene expression data. Unfortunately, these approaches do not correspond to the simplest model of eQTL action, and thus yield estimates of eQTL association that can be uninterpretable and inaccurate. In this paper we propose a new, log-of-linear model for eQTL action, termed ACME, that captures allelic contributions to cis-acting eQTLs in an additive fashion, yielding effect size estimates that correspond to a biologically coherent model of cis-eQTLs. We describe a non-linear least-squares algorithm to fit the model by maximum likelihood, and obtain corresponding -values. We perform careful investigation of the model using a combination of simulated data and data from the Genotype Tissue Expression (GTEx) project. Our results reveal little evidence for dominance effects, a parsimonious result that accords with a simple biological model for allele-specific expression and supports use of the ACME model. We show that Type-I error is well-controlled under our approach in a realistic setting, so that rank-based normalizations are unnecessary. Furthermore, we show that such normalizations can be detrimental to power and estimation accuracy under the proposed model. We then provide summaries of ACME effect sizes for whole-genome cis-eQTLs in the GTEx data.
keywords:
eQTL analyses; eQTL effect size, nonlinear regression; multiple testing.1 Introduction
An expression Quantitative Trait Locus (eQTL) is a genetic polymorphism (typically a single-nucleotide polymorphism, abbreviated by SNP) that is associated with transcriptional expression levels in a particular tissue. The statistical analysis of eQTLs has become increasingly important in understanding molecular mechanisms connecting genetic variation to complex traits and disease (Morley et al. (2004); Gilad et al. (2008); Grundberg et al. (2012); Westra et al. (2013)). For example, eQTL studies can be used to plausibly link disease phenotypes analyzed in Genome-Wide Association Studies (GWAS) to gene expression, with recent work focusing on variation across tissues (Gamazon et al., 2015; Ardlie et al., 2015). Although the underlying biology is complex, a fundamental step in many analyses is to compare the genotypes of a large number of SNPs to the expression levels of all genes, which presents challenges in computation and multiple testing (Wright et al., 2012).
Statistical analyses of eQTLs have often been based on standard linear regression (Shabalin, 2012), with a focus on testing and detection. A key step, commonly considered necessary to avoid false positives, has been to normalize and transform the expression data prior to analysis (Beasley et al., 2009). Often normalization removes the scale of the expression data, and with it, a natural measure of effect size due to genotype. As a consequence, eQTL effect size has often been described in terms of regression partial between genotype and transformed expression (see for example Stranger et al. (2007)). However, the statistic can be highly sensitive to transformations of the response, and is difficult to interpret biologically. An appropriate eQTL model should reflect a coherent model of allelic contributions to expression, and provide a null hypothesis to test for dominance (Powell et al., 2013). Furthermore, a biologically appropriate effect-size model will improve the accuracy of hypothesis tests (as we show in this paper), and provide reliable rankings of eQTLs in terms of effect sizes instead of -values alone.
In this paper we propose ACME, a model for the effect size of cis-acting eQTLs, in which the effects of genotype alleles on expression are Additive Contributions on the original expression scale, with Multiplicative Error. In the ACME model the log of expression is equal to the log of a linear systematic term (“log-of-linear”) plus noise and covariate effects: this seemingly subtle difference from standard log-linear modeling is of key importance in estimating and interpreting effect sizes. The ACME model reflects a marked departure from standard practice in eQTL analyses and has important implications for downstream inferences on effect sizes and dominance. Standard normalizations meant to control false positives run against, as we will argue, the most coherent conception of eQTL action: namely that gene expression is additive in allele count. A primary contribution of this paper is to assess the validity of this conception against the alternatives suggested by standard practices. Additionally, we provide (i) a fast, custom fitting algorithm and corresponding software package, (ii) a robustness analysis of our method, and (iii) diverse results and comparisons from a full cis-eQTL analysis using both ACME and existing models.
The organization of the paper is as follows. In the remainder of this section, we discuss standard eQTL models. In Section 2, we lay out the ACME model and conduct statistical tests on real data to show its conformity to cis-eQTL action. In Section 3 we analyze robustness of ACME p-values to violations of model assumptions in real data. Section 4 describes a simulation study to assess consequences of using standard normalizations when ACME is the true model. In Section 5 we discuss results from analyses of all cis-eQTLs in nine tissues (data from the GTEx project, Lonsdale et al. 2013) using both ACME and existing methods. In Section 6, we summarize our contributions and discuss future research.
1.1 Existing approaches to gene expression modeling
Gene expression data are rarely analyzed on the original scale, due to heteroskedasticity and heavy-tailed errors (Rantalainen et al., 2015). Instead, logarithmic transformation of expression is a standard pre-processing step for many microarray platforms (e.g. Morley et al., 2004; Irizarry et al., 2003) and often plays an important role in downstream analyses such as differential expression (e.g. Network et al., 2013; Li et al., 2014). RNA-Seq data are inherently count-based, and statistical analyses of such data often make use of binomial, negative-binomial, or Poisson generalized linear models (McCarthy et al., 2012; Zhou et al., 2011; Zwiener et al., 2014), which use logarithmic or near-logarithmic link functions. However, count-based modeling is rarely used in eQTL analysis, due to computational requirements, and the fact that several stages of read-count normalization are usually applied to expression data. Furthermore, count-based modeling may not be necessary in studies with large sample sizes (Zhou et al., 2011), and eQTL analyses are often performed using linear regression of log-transformed expression, assuming additive allelic effects on the log scale (e.g. Myers et al., 2007).
Another common transformation of expression is inverse quantile-normalization (e.g. Dixon et al., 2007), used to ensure normality of residuals under the null (Beasley et al., 2009; Szymczak et al., 2013). Given a vector of length , the quantile-normalization (QN) transformation is the function , mapping each value to a normal quantile corresponding to its rank. Henceforth, eQTL analysis involving linear regression of quantile-normalized gene expression will be referred to as “QN-linear”. For eQTL analyses, the QN-linear model yields -values that are approximately uniform under the null of no association between expression and genotype. However, the quantile-normalization mapping inherent to this approach erases all connection between the linear model parameters and the original gene expression. Hence, estimated coefficients from QN-linear regression do not reflect the scale of the original data, and contain almost no information about the true allelic effect. As a result, QN-linear model effect-size estimates from eQTLs with clearly diverse signal-to-noise ratios can yield nearly identical -values (see Web Appendix LABEL:qn-vs-ACME).
1.2 Notation and data
eQTL data from samples will be written as follows. The SNP genotype is the number of minor alleles 0, 1, or 2, rounded if using imputed data. Genotype is contained in an matrix where is the number of SNP markers; we denote a (length ) row of the genotype matrix by . Expression is measured by the number of mapped reads relative to the library size (see Web Appendix LABEL:data_prep). Read counts for expression are contained in a matrix where is the number of genes or transcripts; the length row of expression matrix is denoted . Finally, the covariates (e.g. sex or batch) are stored in a matrix.
The GTEx pilot data set (Ardlie et al., 2015) is used for all analyses and investigations. Given the purported scope of the ACME model, the analysis focus is on “cis” gene-SNP pairs, for which the SNPs are within 1 megabase upstream or downstream of the transcription start or stop sites. The GTEx pilot data contains a SNP database and expression data from nine tissues, each having sample sizes between and . Each tissue-specific data set had covariates: sex and 3 genotype principal components, which were shared across all tissues; and 15 PEER (Probabalistic Estimation of Expression Residuals) factors computed from expression data (Stegle et al., 2012).
2 The ACME model and diagnostics
This section provides a ground-up introduction of the ACME model. The first consideration is the appropriate scale of expression data for error control. As discussed in Section 1.1, errors from linear models of raw gene expression data are known to be heteroskedastic and non-normal. In Web Appendix LABEL:raw-expr-resids, we show that the non-normality observed in real-data residuals after linear regression with raw expression causes severe Type-I error discrepancies. Though the QN-linear model avoids this problem, it is unsuitable for effect-size estimation (as discussed in Section 1.1). Thus we assess the commonly-used log transformation, in two ways. First, we display tests of normality and heteroskedasticity of residuals after fitting QN-linear, standard linear, and various log-linear models (see Web Appendix LABEL:normality) to GTEx data. We see that models using log-transformed expression perform much better than those based on raw expression. Comparison to the QN-linear model results indicate that the log-transformation is still somewhat subject to noise and outliers. However, we consider the resulting violations of normality and homoskedasticity to be acceptably modest, when balanced against the ability to assess effect size with a model that respects the scale of expression data. (Section 3 provides a deeper look into Type-I errors from log-based methods.) Second, we assess residual normality under the box-cox transformation (Box and Cox, 1964), defined for as
| (1) |
We perform Shapiro-Wilk tests on box-cox transformed expression data from null eQTLs (as judged by QN-linear p-values) subsampled from real data. We find that the log transformation () consistently results in the fewest instances of significantly non-normal residuals. These results are displayed in Web Figure LABEL:fig:box-cox.
The analyses described above suggest that the log transformation puts gene expression on a natural scale for error control in eQTL effect-size analysis. We now discuss systematic components of various log-scale effect size models, including ACME (to be introduced). Henceforth, let denote the log-transformed normalized gene read count from sample , where the addition of 1 avoids taking the logarithm of zero. The value is the result of taking the original raw count for the gene in sample , library-normalizing and then scaling up to the magnitude of the original mean count (see Web Appendix LABEL:data_prep). Let denote the minor allele count for the SNP in sample (). Let denote the vector of covariates for sample , and let be an unknown covariate coefficient vector. Finally, let be independent errors with positive variance . Note that the quantities and may differ across gene-SNP pairs. It is common in eQTL studies to assume that the covariate effect contributes to expression on the same scale as the noise (e.g. Shabalin, 2012). We follow this practice for all models considered in this paper (including linear regressions with both raw and quantile-normalized gene expression). Additional support for this convention can be seen from the fact that the covariates were computed from normalized data to reduce the influence of outliers (Ardlie et al., 2015), so it is natural for them to be residualized on the log-scale.
2.1 Log-ANCOVA and log-linear models
We now describe two log-scale linear eQTL models. If one assumes each genotype is associated with a distinct level of average log-expression, the associated linear model effectively includes a dominance term for the homozygous genotype for the reference allele, and yields what we call the “log-ANCOVA” model:
| (2) |
Here the parameters are unknown log-expression means corresponding to the genotypes, and if , and zero otherwise. Another (simpler) log-scale model includes just one parameter for allele count:
| (3) |
Above, is baseline log-expression, and is the contribution to log-expression of each reference allele. This model includes one fewer degree of freedom than log-ANCOVA, due to the loss of the dominance term . Linear regression on allele count has been heavily used in eQTL analysis (Ardlie et al., 2015), perhaps partly because evidence of eQTL dominance effects are scant, even in trans-analyses (Wright et al., 2014). Furthermore, simpler models like (3) are useful in that they can be used to test for dominance and, in case of allelic independence, provide appropriate estimates of eQTL action.
2.2 The ACME Model
Despite the prevalence of the log-linear model (3) in eQTL analysis, it has not been subjected to careful scrutiny. The current understanding of cis-eQTL variation in humans is that it is largely allele-specific (Castel et al., 2015), i.e., the transcription of a gene in a particular chromosome is influenced primarily by one or more SNP alleles on the same chromosome. Thus, in the absence of feedback mechanisms, the effect of each SNP allele should be additive on the original expression scale. To incorporate this understanding while respecting the heavy-tailed nature of gene expression data, we propose the following log-scale non-linear regression (ACME):
| (4) |
Here is the baseline mean expression, and the additive contribution of each allele. Exponentiating each side of equation 4, on the expression scale we have:
| (5) |
It is clear from this equation that the effect of genotype is linear in raw expression, as desired. We fit the ACME model to data via maximum likelihood, using a Gauss-Newton algorithm, which is derived in Web Appendix LABEL:Fitting.
2.2.1 The effect size
The coefficients and from the ACME model operate on the original expression scale, so they lend themselves naturally to a “fold-change” interpretation. In particular, the ratio represents the fraction of mean increase due to a single referent allele compared to the baseline genotype 0. We note that Equation (4) may be written
| (6) |
which separates the role of in determining baseline expression and the role of in determining the effect of genotype. Equation 6 also plays a role in the fitting algorithm. In what follows we use “effect size” to refer to the ratio . In Web Appendix LABEL:SE we obtain a formula for the standard error of , using a reduced Hessian matrix derived from the model. We note that other notions of effect size may be of interest to biologists. For example, an alternative effect size model, studied simultaneously and independently, incorporates allele additivity through an explicit focus on a fold-change parameter (Mohammadi et al., 2016).
2.2.2 Fitting algorithm and software
Though the ACME model can in principle be fit by brute-force likelihood maximization, we found stock implementations of this approach to be slow and unreliable in practice. We have crafted a custom fitting algorithm for ACME, provided in Web Appendix E. We have implemented the fitting algorithm, and a parallelized wrapper for full cis-genome analysis, in a free and open-source software package called . The package is written in the statistical computing language, and is available on the CRAN repository. In Section 4.1, we benchmark the computation time of our software.
2.3 Goodness-of-fit tests
In the previous section, we pointed out that the log-linear model assumes allelic effect additivity on the log-expression scale, whereas ACME assumes additivity on the raw-expression scale. These assumptions can be treated as competing hypotheses, evaluations of which may be performed with goodness-of-fit tests. In this section, we carry out such tests using data from the GTEx project. To derive the test, note that the log-linear and ACME models are each nested within the log-ANCOVA model. For instance, the log-ANCOVA model reduces to the ACME model via the parameterization
Thus, if either model is sufficient to explain variation in gene expression, any further improvements in the log-ANCOVA fit should be small and consistent with the extra degree of freedom in that model. Conversely, if the fit of log-ANCOVA is (significantly) better than a smaller model, it suggests the smaller model is insufficient. In testing sets of coefficients in nonlinear regression models with normal errors, -tests are widely used (Smyth, 2002), and generally better handle the degree of freedom issues posed by numerous covariates than do likelihood ratio tests. Define as the sum of squared residuals from the fit of log-ANCOVA, and as the sum of squared residuals from the fit of any nested model with 2 degrees of freedom (e.g. LL and ACME). Then the goodness-of-fit test statistic is which is approximately -distributed with and degrees of freedom. A -value for the goodness-of-fit test is then obtained from the upper-tail of .
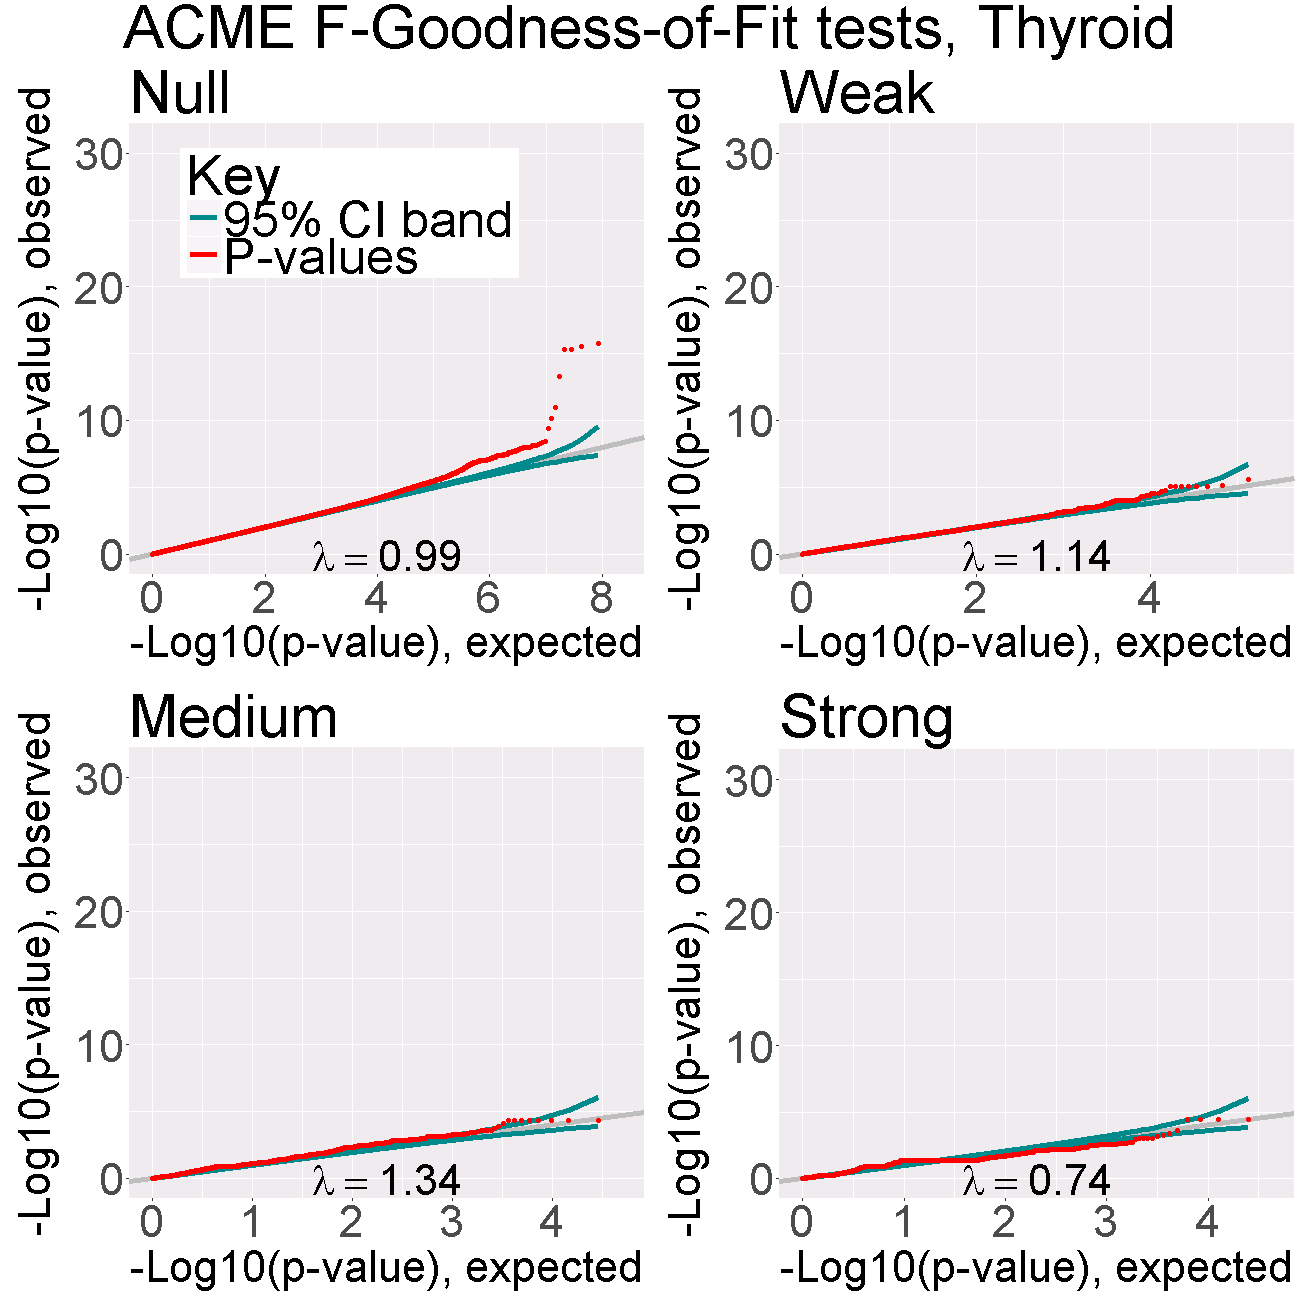
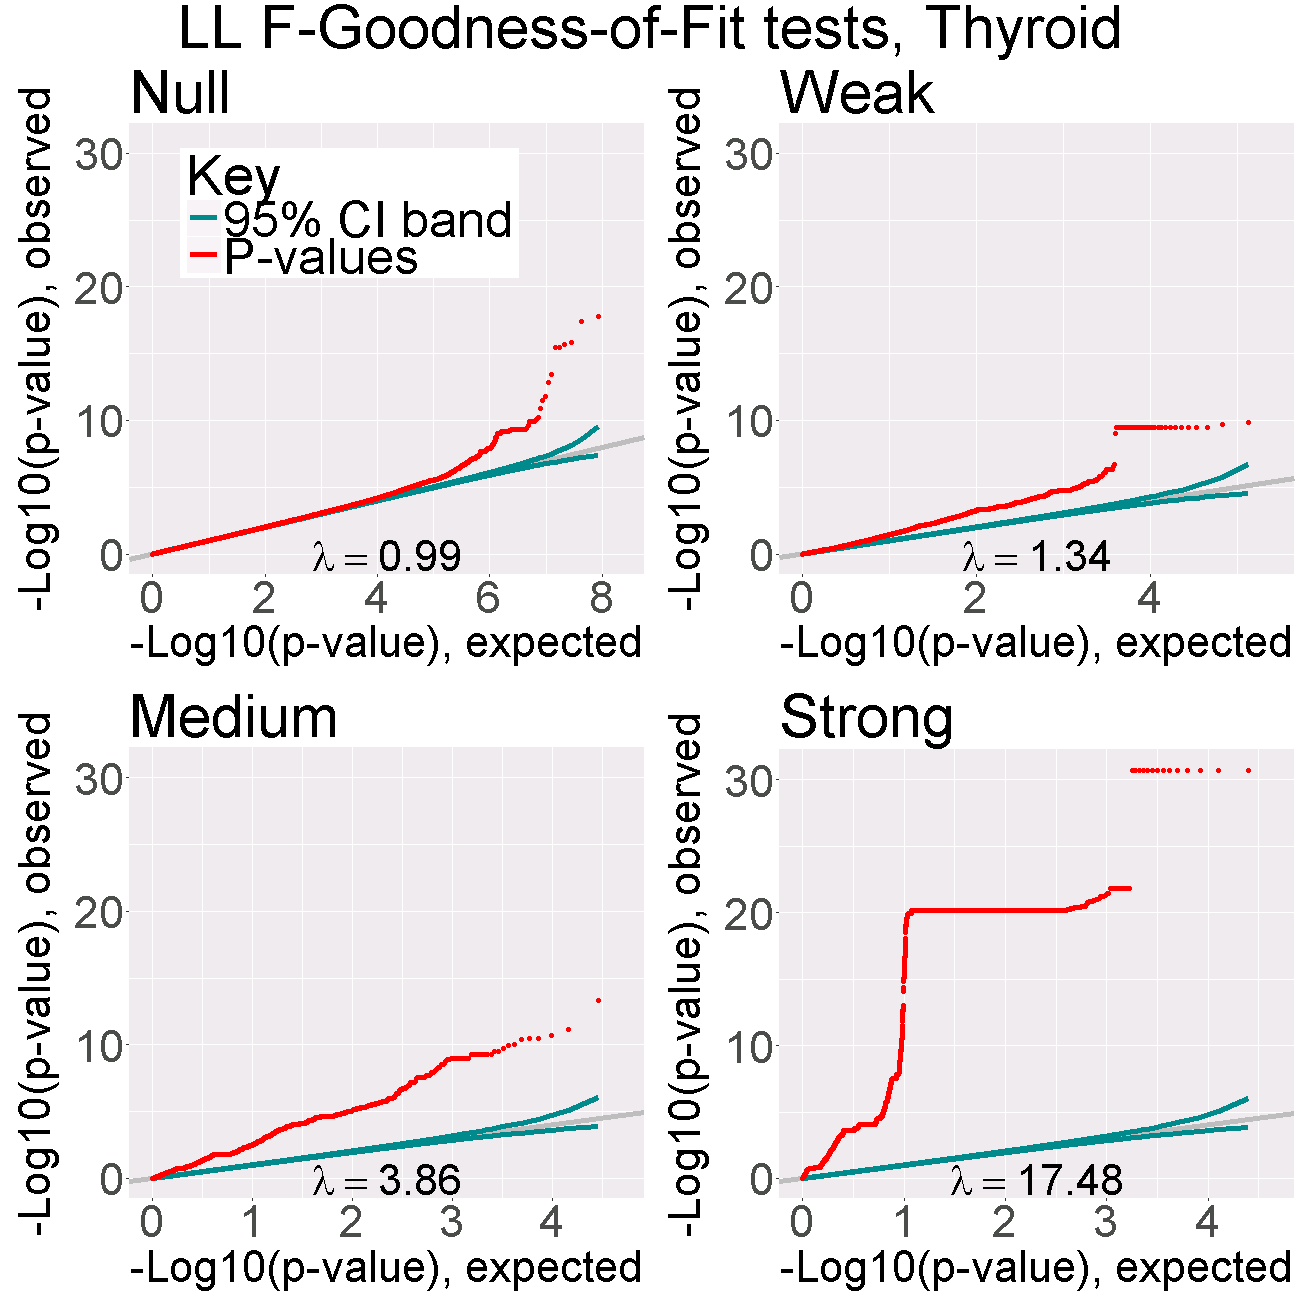
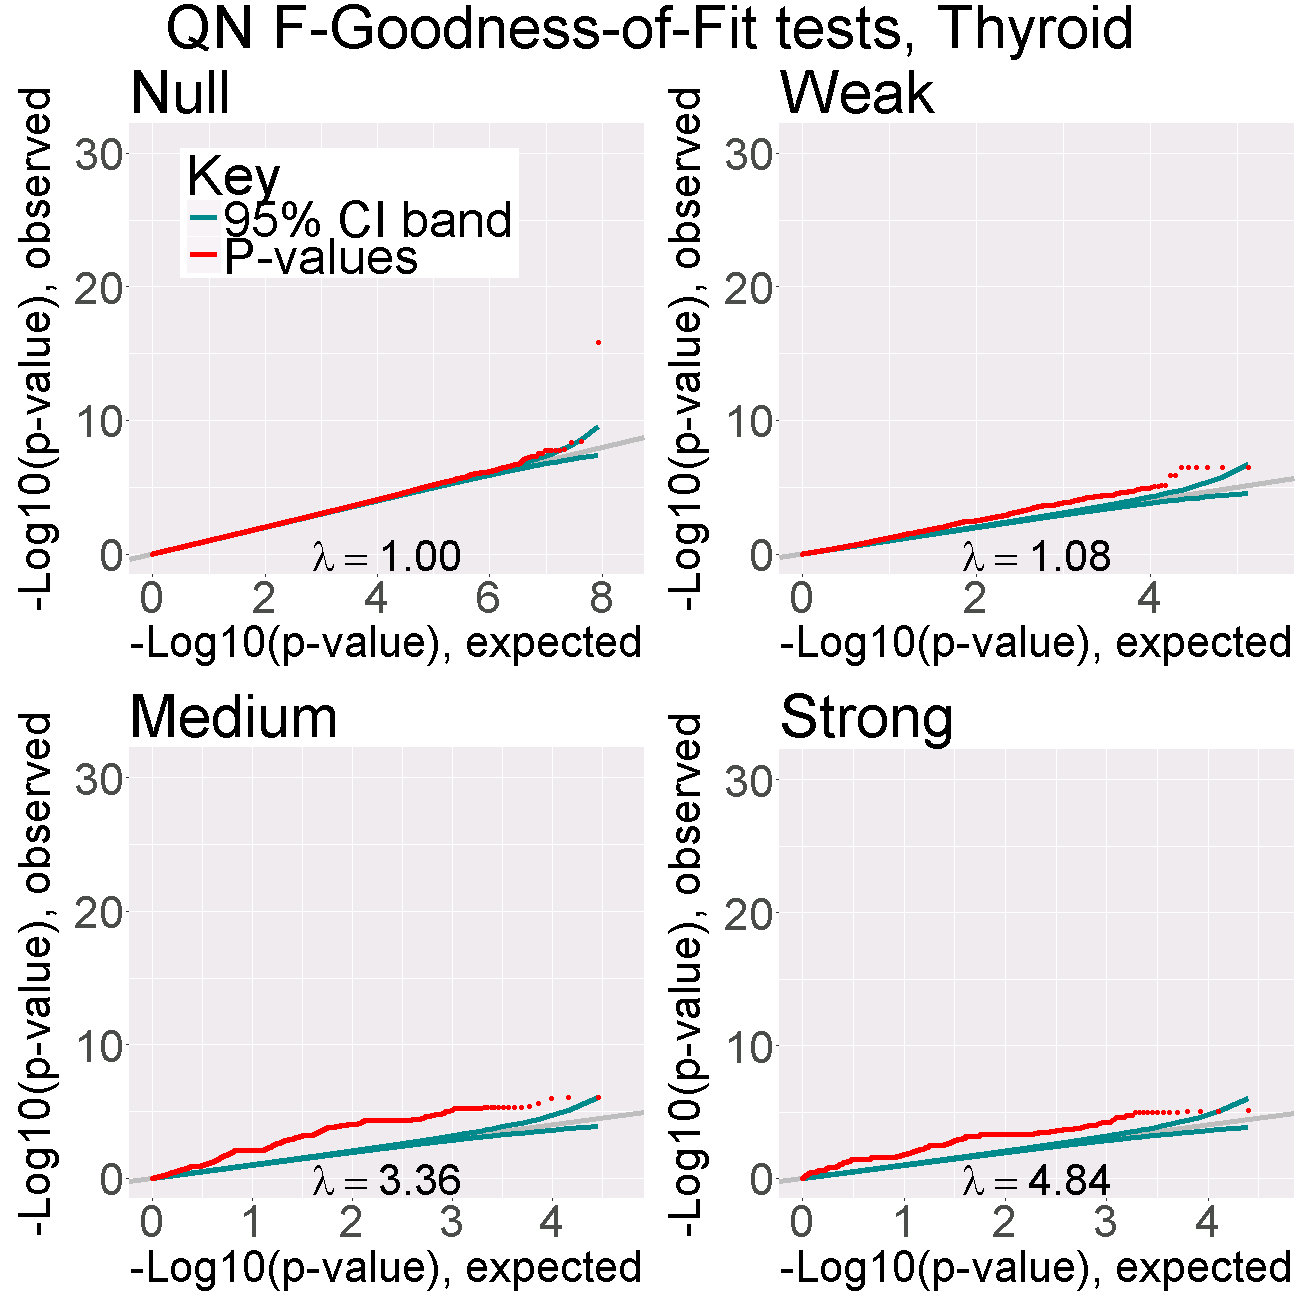
For both the log-linear and ACME models, we applied the goodness-of-fit test to every cis-acting gene-SNP pair in Thyroid tissue (with tissue samples) from GTEx pilot data. As the log-linear and ACME models are indistinguishable under the null model (), we examined the distribution of goodness-of-fit p-values on four bins of cis-eQTL strength (“Null”, “Weak”, “Medium”, and “Strong”), as judged by QN-linear model regression p-values (described fully in Web Appendix LABEL:sampling-scheme). To judge the distribution of the -test p-values from each model, we plotted Q-Q plots on the scale (see Figure 1). On each plot, we also supplied the genomic inflation factor . The genomic inflation factor is defined by , where is the 1 d.f. chi-squared test statistic corresponding to the -value for the -th test, following the original reasoning for genomic control (Devlin and Roeder, 1999). Figure 1 shows that the distribution of -statistic -values from the log-linear model grow increasingly non-uniform as eQTLs become more significant, suggesting that the log-linear model is mis-specified. In contrast, -statistic -values for the ACME model are approximately uniform for eQTLs of all strengths. In other words, the fit of the ACME model is largely indistinguishable from that of log-ANCOVA, whereas the fit of the log-linear model is largely insufficient to explain non-null eQTLs. Overall, these results provide strong empirical support for the raw-expression allelic additivity assumption of the ACME model, and against the log-expression additivity of the log-linear model. We conclude that, among models nested within log-ANCOVA (which are all models based solely on allelic effect), ACME best conforms to the underlying eQTL signal. Similar results were observed after applying the same sub-sampling and testing pipeline to data from four other GTEx pilot tissues (see Web Figures LABEL:fig:more-gof-acme and LABEL:fig:more-gof-ll). For completeness, we also applied the above goodness-of-fit pipeline to the QN-linear model, using the corresponding ANCOVA with quantile-normalized expression. We find the same upward trend of poor fits with stronger effect size observed in the LL model. Along with the discussion in Section 1.1, this further illustrates the inadequacy of quantile-normalized linear models to capture eQTL action.
3 Model -values and Type I error
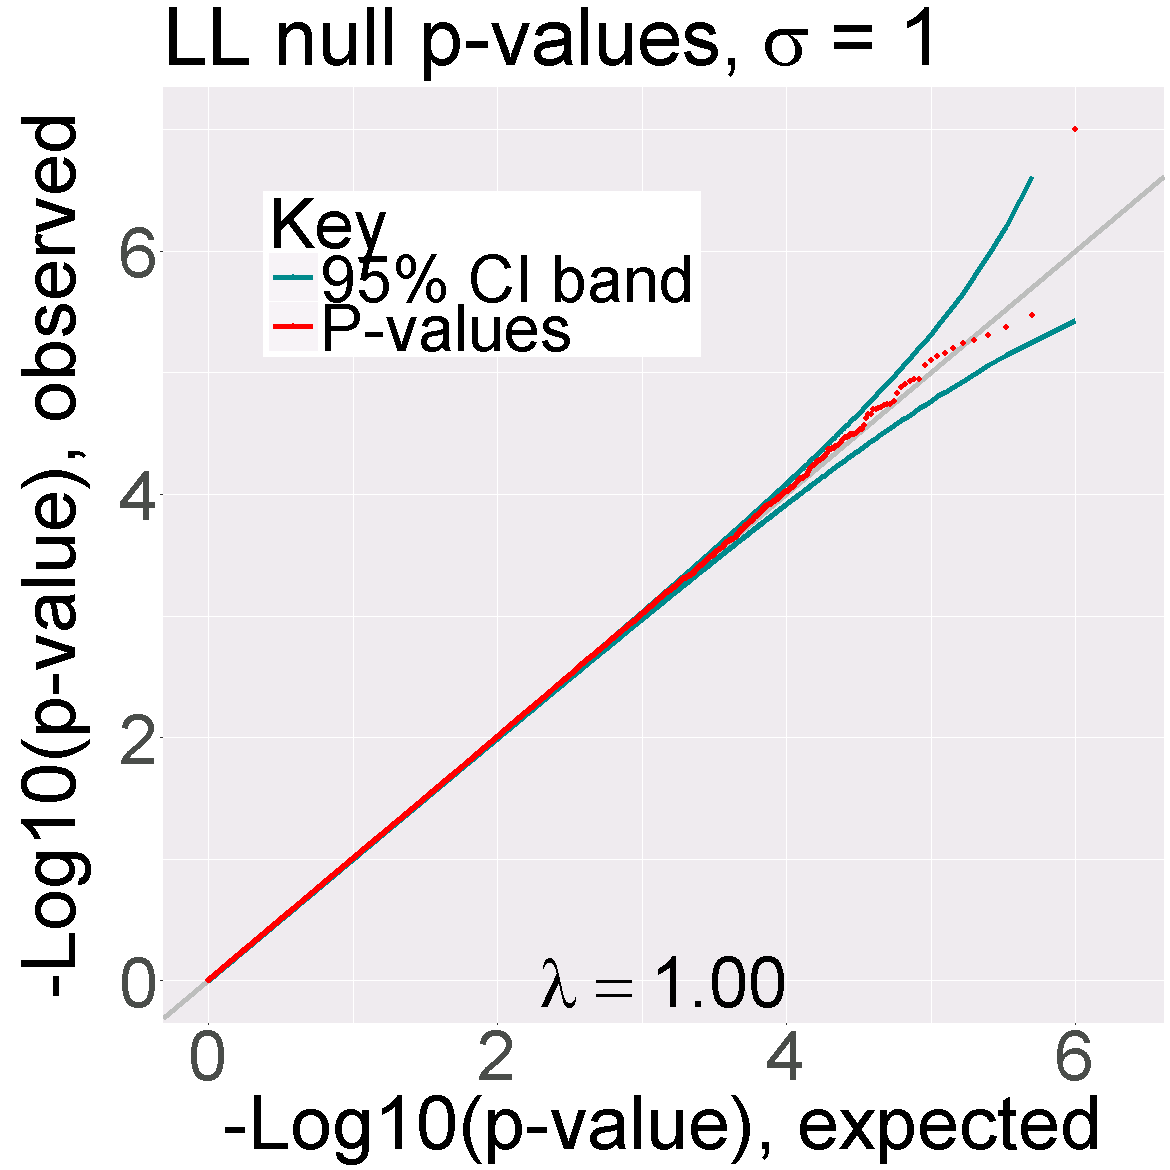
In this section we address violations of residual normality, which can affect Type I error. The large number of tests performed in eQTL analyses presents a special challenge for false positive control. For cis-analysis, the number of tests is typically on the order of (Lonsdale et al., 2013). Thus, using a Bonferroni bound to control family-wise error at 0.05 requires -values to be accurate at values of . In order to perform a test of no effect, i.e., for a given gene-SNP pair, we fit the ACME model and the reduced mean-model with , and then derive a p-value by comparing the resulting -statistic with the distribution. Non-normality in errors can potentially result in non-uniform -statistic -values under the null. To assess this, we examined the performance of ACME on simulated null data with realistic errors. In addition, we examined the effect of skew in errors for the extremal -values resulting from large numbers of tests.
3.1 Empirical performance of the test
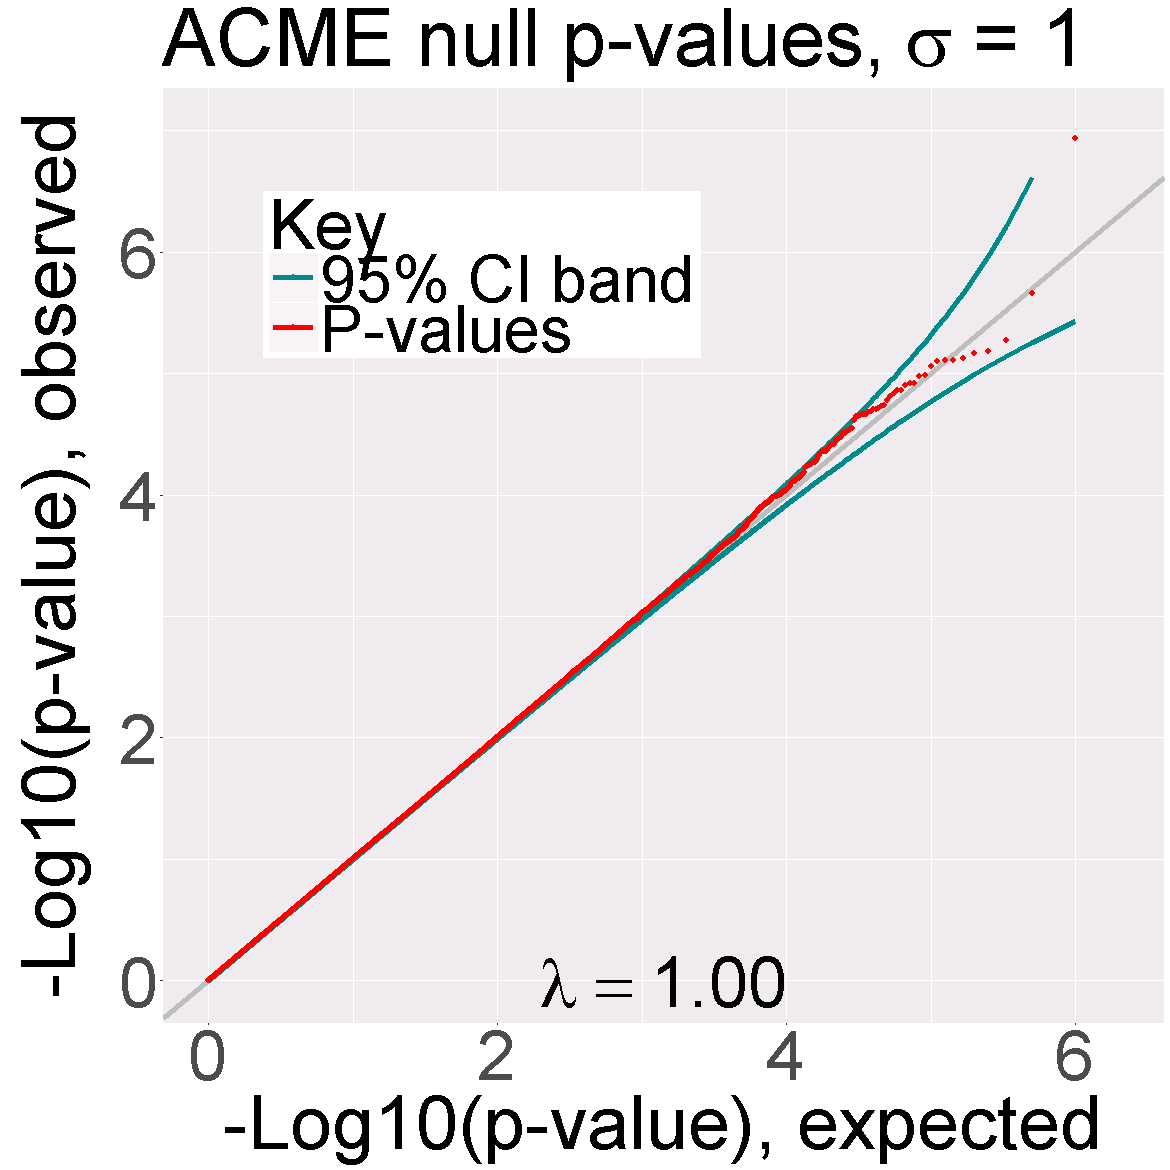
We began our investigation of the empirical performance of the test by fitting the ACME model to null data simulated with realistic residuals. The residuals for each simulated gene-SNP pair were obtained by re-sampling estimated residuals from ACME fits to real GTEx data (full details in Web Appendix LABEL:sec5app). Both the ACME and log-linear models were fit to 1 million null eQTLs generated in this manner, and -values were obtained from each method using the -test. The results are shown in Figure 2. The -test -values appear nearly uniform for both models, as the inflation factors were in the range 0.995-1.005 ( corresponds to no inflation). We emphasize that these conclusions address the behavior of the ACME fit under a realistic null the earlier analyses established that ACME offers superior fit for real data when evidence of the alternative is strong. Similar results for different settings of the variance of the simulated error are shown in Web Figure LABEL:fig:null_pvals-extra.
3.2 Importance sampling estimates of Type I error under skew in residuals
While the results above are encouraging, consideration of 1 million null pairs is not sufficient to assess the quality of very small -values under realistic errors. We are unaware of any attempts via direct data simulation to quantify robustness in eQTL studies to the stringent multiple testing thresholds necessary for eQTL studies (as low as for cis-testing). We note that the robustness investigations of Rantalainen et al. (2015) used only simulations for each investigated condition.
A computationally efficient way to assess Type-I error rates for extreme nominal -values is to perform importance sampling (Tokdar and Kass, 2010), in which samples are drawn from an appropriate alternative distribution (with ), then re-weighted to provide an estimated probability of rejection under the null. For regression models, skewness in the error distribution has a major impact on false positive control, and can cause both conservative or anti-conservative behavior (Zhou and Wright, 2015). Accordingly, we carried out importance sampling using the skew-normal model (Azzalini and Dalla Valle, 1996) for the distribution of , with skewness determined by a parameter , with corresponding to the assumed normal error model. Simulations were performed with modest average expression , error variance , minor allele frequencies 0.025, 0.05, and 0.1, and for sample sizes 100, 250, and 500. Among the GTEx datasets used in this paper, most showed skewness in ACME residuals between -0.5 and 0.5 (see Web Figure LABEL:fig:skew-results for an example using Adipose GTEx pilot data). We chose the skew-normal parameter to correspond to skewness in this range (details in Web Appendix LABEL:sec5app2). Target type I error values ranged from to .
The results for the ACME -test -values are shown in Web Figures LABEL:fig:investigate-skew1-LABEL:fig:investigate-skew3, using the importance sampling approach detailed in Web Appendix LABEL:sec5app2. Some general conclusions can be drawn. For and negative skewness in (with ), the ACME -values are noticeably conservative for . For positive skewness, the -values are slightly anti-conservative, but more accurate than for negative skewness due to asymmetry in the behavior of the systematic component of the ACME model. For larger , the conservativeness under negative skewness is less extreme, and the -values reasonably accurate to for the skewness range shown. This suggests that p-values for the ACME model should produce acceptable Type-I error rates for most gene-SNP pairs, even for those with relatively small sample sizes. Even pairs with higher skew show acceptable type I error for sample sizes of 250 or greater, and any deviations from ideal behavior tend to be conservative. These trends hold across the tested values of the MAF, though the p-value skew becomes more severe for lower MAF. For trans-analysis, larger sample sizes may be required due to the more stringent testing thresholds. However, Wright et al. (2014) suggested that sample sizes are necessary to reliably detect trans-eQTLs, and for such large studies we would expect robust ACME -values, a separate issue from whether ACME is appropriate for trans-analysis. For small sample sizes and to serve as an ancillary approach, we describe the MCC method (Zhou and Wright, 2015) as a fast method to obtain robust -values in Web Appendix LABEL:mccapp.
4 Power, estimation accuracy, and computation speed
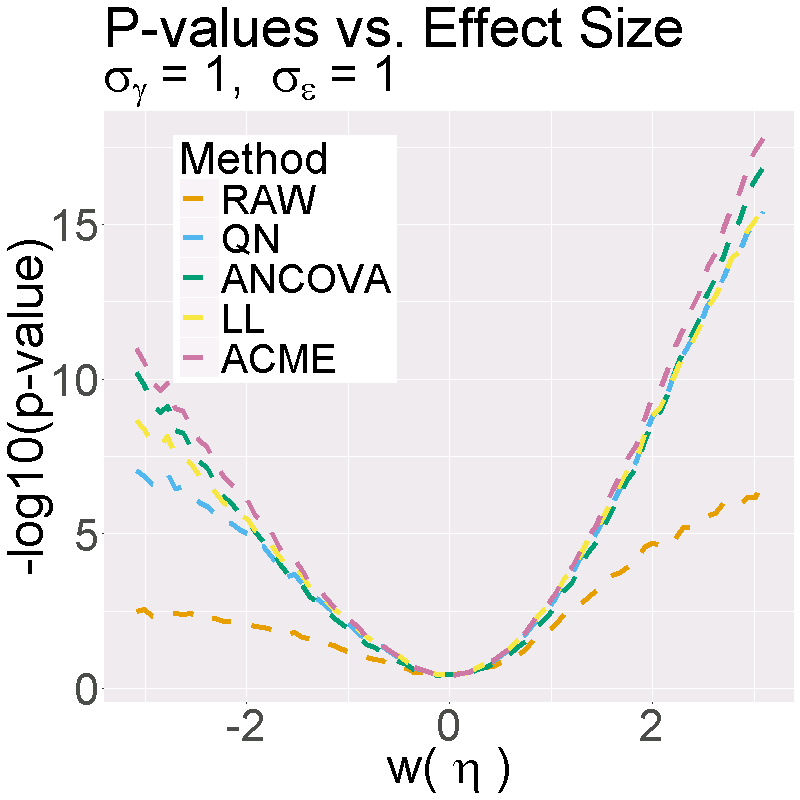
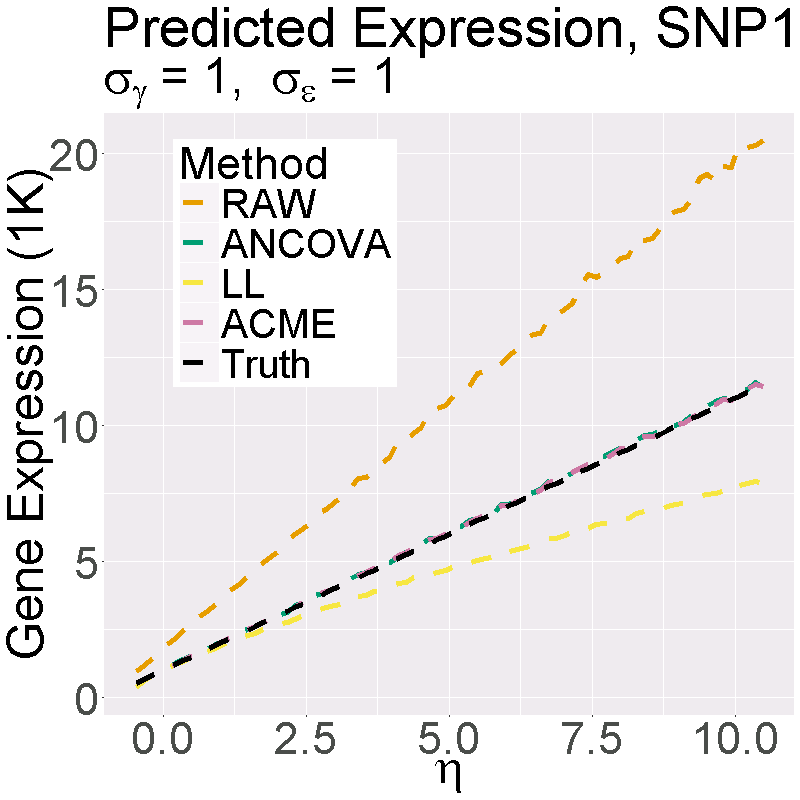
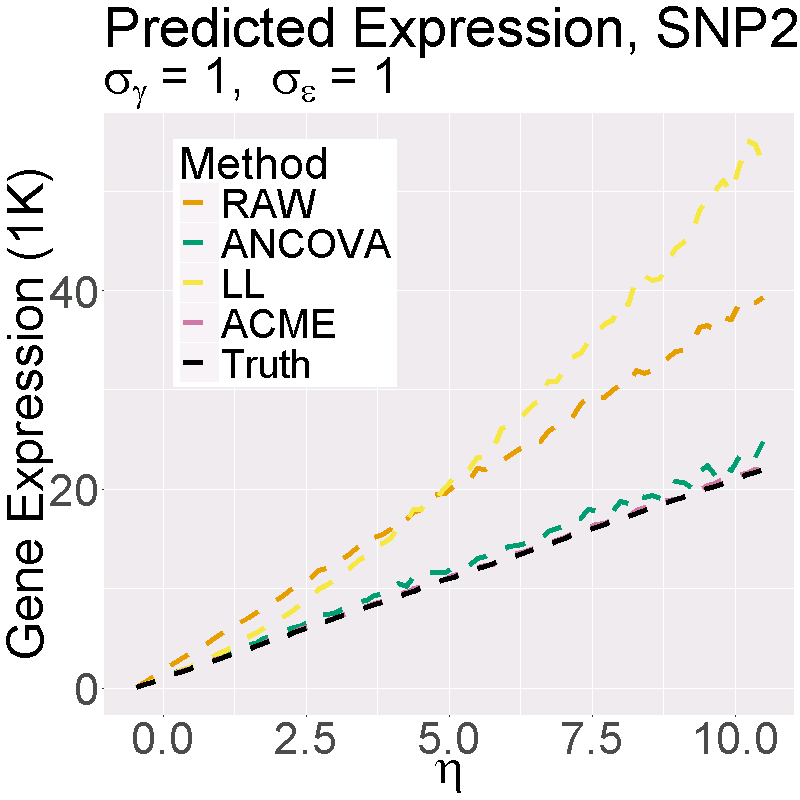
In this section we present simulation results which display the detection power, estimation accuracy, and computation speed of the ACME model versus existing alternatives. Recall the representation of the ACME model from equation 6, involving the parameter . We simulated 100 repetitions of the model at values of along the range . The sample-size was set to , as components of the simulations were taken from real data (as in Section 3.1). At each repetition, the other components of the model were set as follows: (1) allele counts from a randomly sampled real-data allele count vector corresponding to GTEx samples of Thyroid tissue; (2) real-data covariate matrix corresponding to Thyroid samples, constant across all repetitions and values of ; (3) noise vector () and covariate effect () generated as normals with mean 0 and covariances and (respectively), independent within and across repetitions.
We replicated the above simulation framework for various choices of , with fixed at 1. We then applied linear (RAW), quantile-normalized linear (QN), log-linear (LL), log-ANCOVA (ANCOVA), and ACME models to each instance of the simulation. For each value of , we computed the average and standard deviation over the repetitions of the following metrics (per model). (1) -test p-value for hypotheses vs. ; (2) Estimated raw expression value when reference allele count equals 1; (3) Estimated raw expression value when reference allele count equals 2. Note that estimation with the QN model cannot provide (2) or (3), as the model is based on a rank-normalized expression. Furthermore, parameters of the LL model are not directly comparable to those of ACME or RAW (as they are additive on the log-expression scale), which motivates our choice to evaluate estimated expression rather than estimated .
In Figure 3, we display results from the above simulation framework with . Note that, for the top plot, the -axis is transformed according to , a scale which better displays the results when . We replicated the simulation framework with other choices of both above and below . The results of these replications are shown in Web Figure LABEL:fig:power-sims2. Our results show that the ACME model achieves the most power and estimation accuracy among the alternative methods. Hence, if the ACME model is the best representation of underlying eQTL biology in terms of allele count (as the analyses in Section 2.3 suggest), use of the existing methods reduces accuracy and sensitivity. Additionally, in Web Figure LABEL:fig:power-sims2, we show that when is increased (i.e., the covariates have more effect), the accuracy and sensitivity of the competing methods is even further reduced.
Remark: The power of log-ANCOVA is quite close to that of ACME. This is expected, as log-ANCOVA contains ACME, the true simulated model. Thus, in this simulation study, the log-ANCOVA results act mainly as a reference; the larger model’s practical and conceptual shortcomings compared to ACME were discussed in Section 2. The focus of this study is mainly on single-parameter models and the consequences of misspecification.
4.1 Computation times
To assess computation speed, we timed various methods on every simulation instance for Figure 3. There were 10,000 unique values of , and therefore 1 million simulation instances. On each instance, we recorded the computation time for: (1) the LL model with least-squares estimation; (2) the ACME model with maximum likelihood using the BFGS method implemented in from ; (3) the ACME model with the custom fitting algorithm derived in Web Appendix LABEL:Fitting. The timing of (1) will be of the same order as any other procedure based on least-squares (RAW, QN, and ANCOVA). The timing of procedure (2) is provided as a benchmark for procedure (3). All computations were performed on an Intel Xeon E5-2640 (2.50 GHz), using the , and timed with the package.
The mean and standard deviation of computation times for the procedures, over the 1 million simulation instances, were as follows: least-squares at 0.129ms (0.233), BFGS at 2.687ms (1.270), custom ACME at 0.470ms (0.285). So, the efficiency of the custom ACME algorithm is quite comparable to that of least-squares estimating equations, and outstrips stock optimization methods. The complete package implementing our algorithm, including wrappers that employ parallelization to process all cis-eQTL results from massive-scale eQTL data, is available in the package on the CRAN respository.
5 Large-scale real data analysis
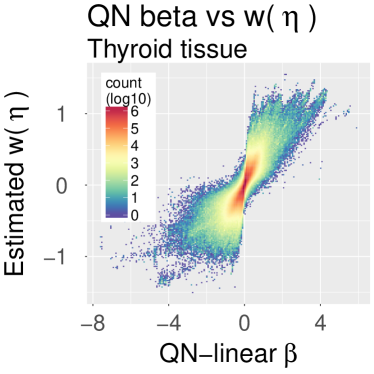
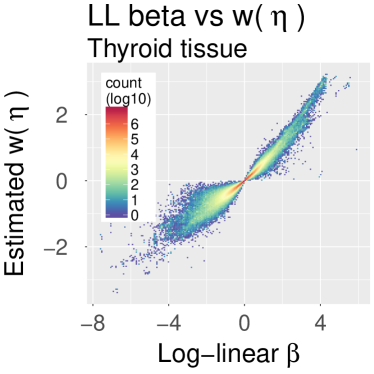
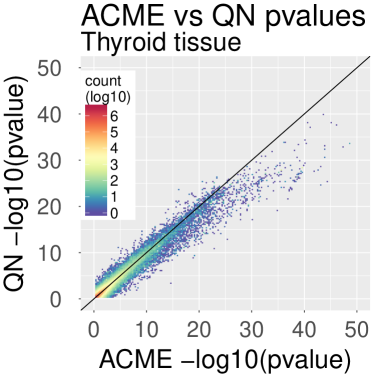
This section contains further comparisons between different effect-size models. Note that the most important real-data comparisons between ACME and standard models are the goodness-of-fit tests shown in Section 2.3. Those tests showed that ACME best fits cis-eQTL data, compared to other allele-count models. Moreover, ACME estimates correspond to a coherent biological interpretation of cis-eQTL action. In light of this, it can be asked whether effect-size rankings from other methods, at least, correspond to those from ACME. Effect size estimates for all cis-pairs were computed from Thyroid tissue data using the QN-linear, LL, and ACME models. The top plots in Figure 4 show that effect-size ordering given to the strongest eQTLs by QN and LL differ markedly from ACME. Also in Figure 4 is a plot of ACME versus QN-linear regression -values, shown mainly to provide a fuller comparison to Ardlie et al. (2015) and other studies which rely on the QN-linear model. It is clear that, while QN p-values are associated with ACME’s (as one would hope), they are by no means identical in rank, and quite different in magnitude for the strongest eQTLs. Furthermore, as shown in the top row of plots, many QN effect sizes differed in sign from ACME’s. All these comparisons held across tissues, as shown in Web Figure LABEL:fig:full-extra. Beyond method comparisons, we also display summaries of ACME effect sizes in Web Figure LABEL:fig:full-extra2.
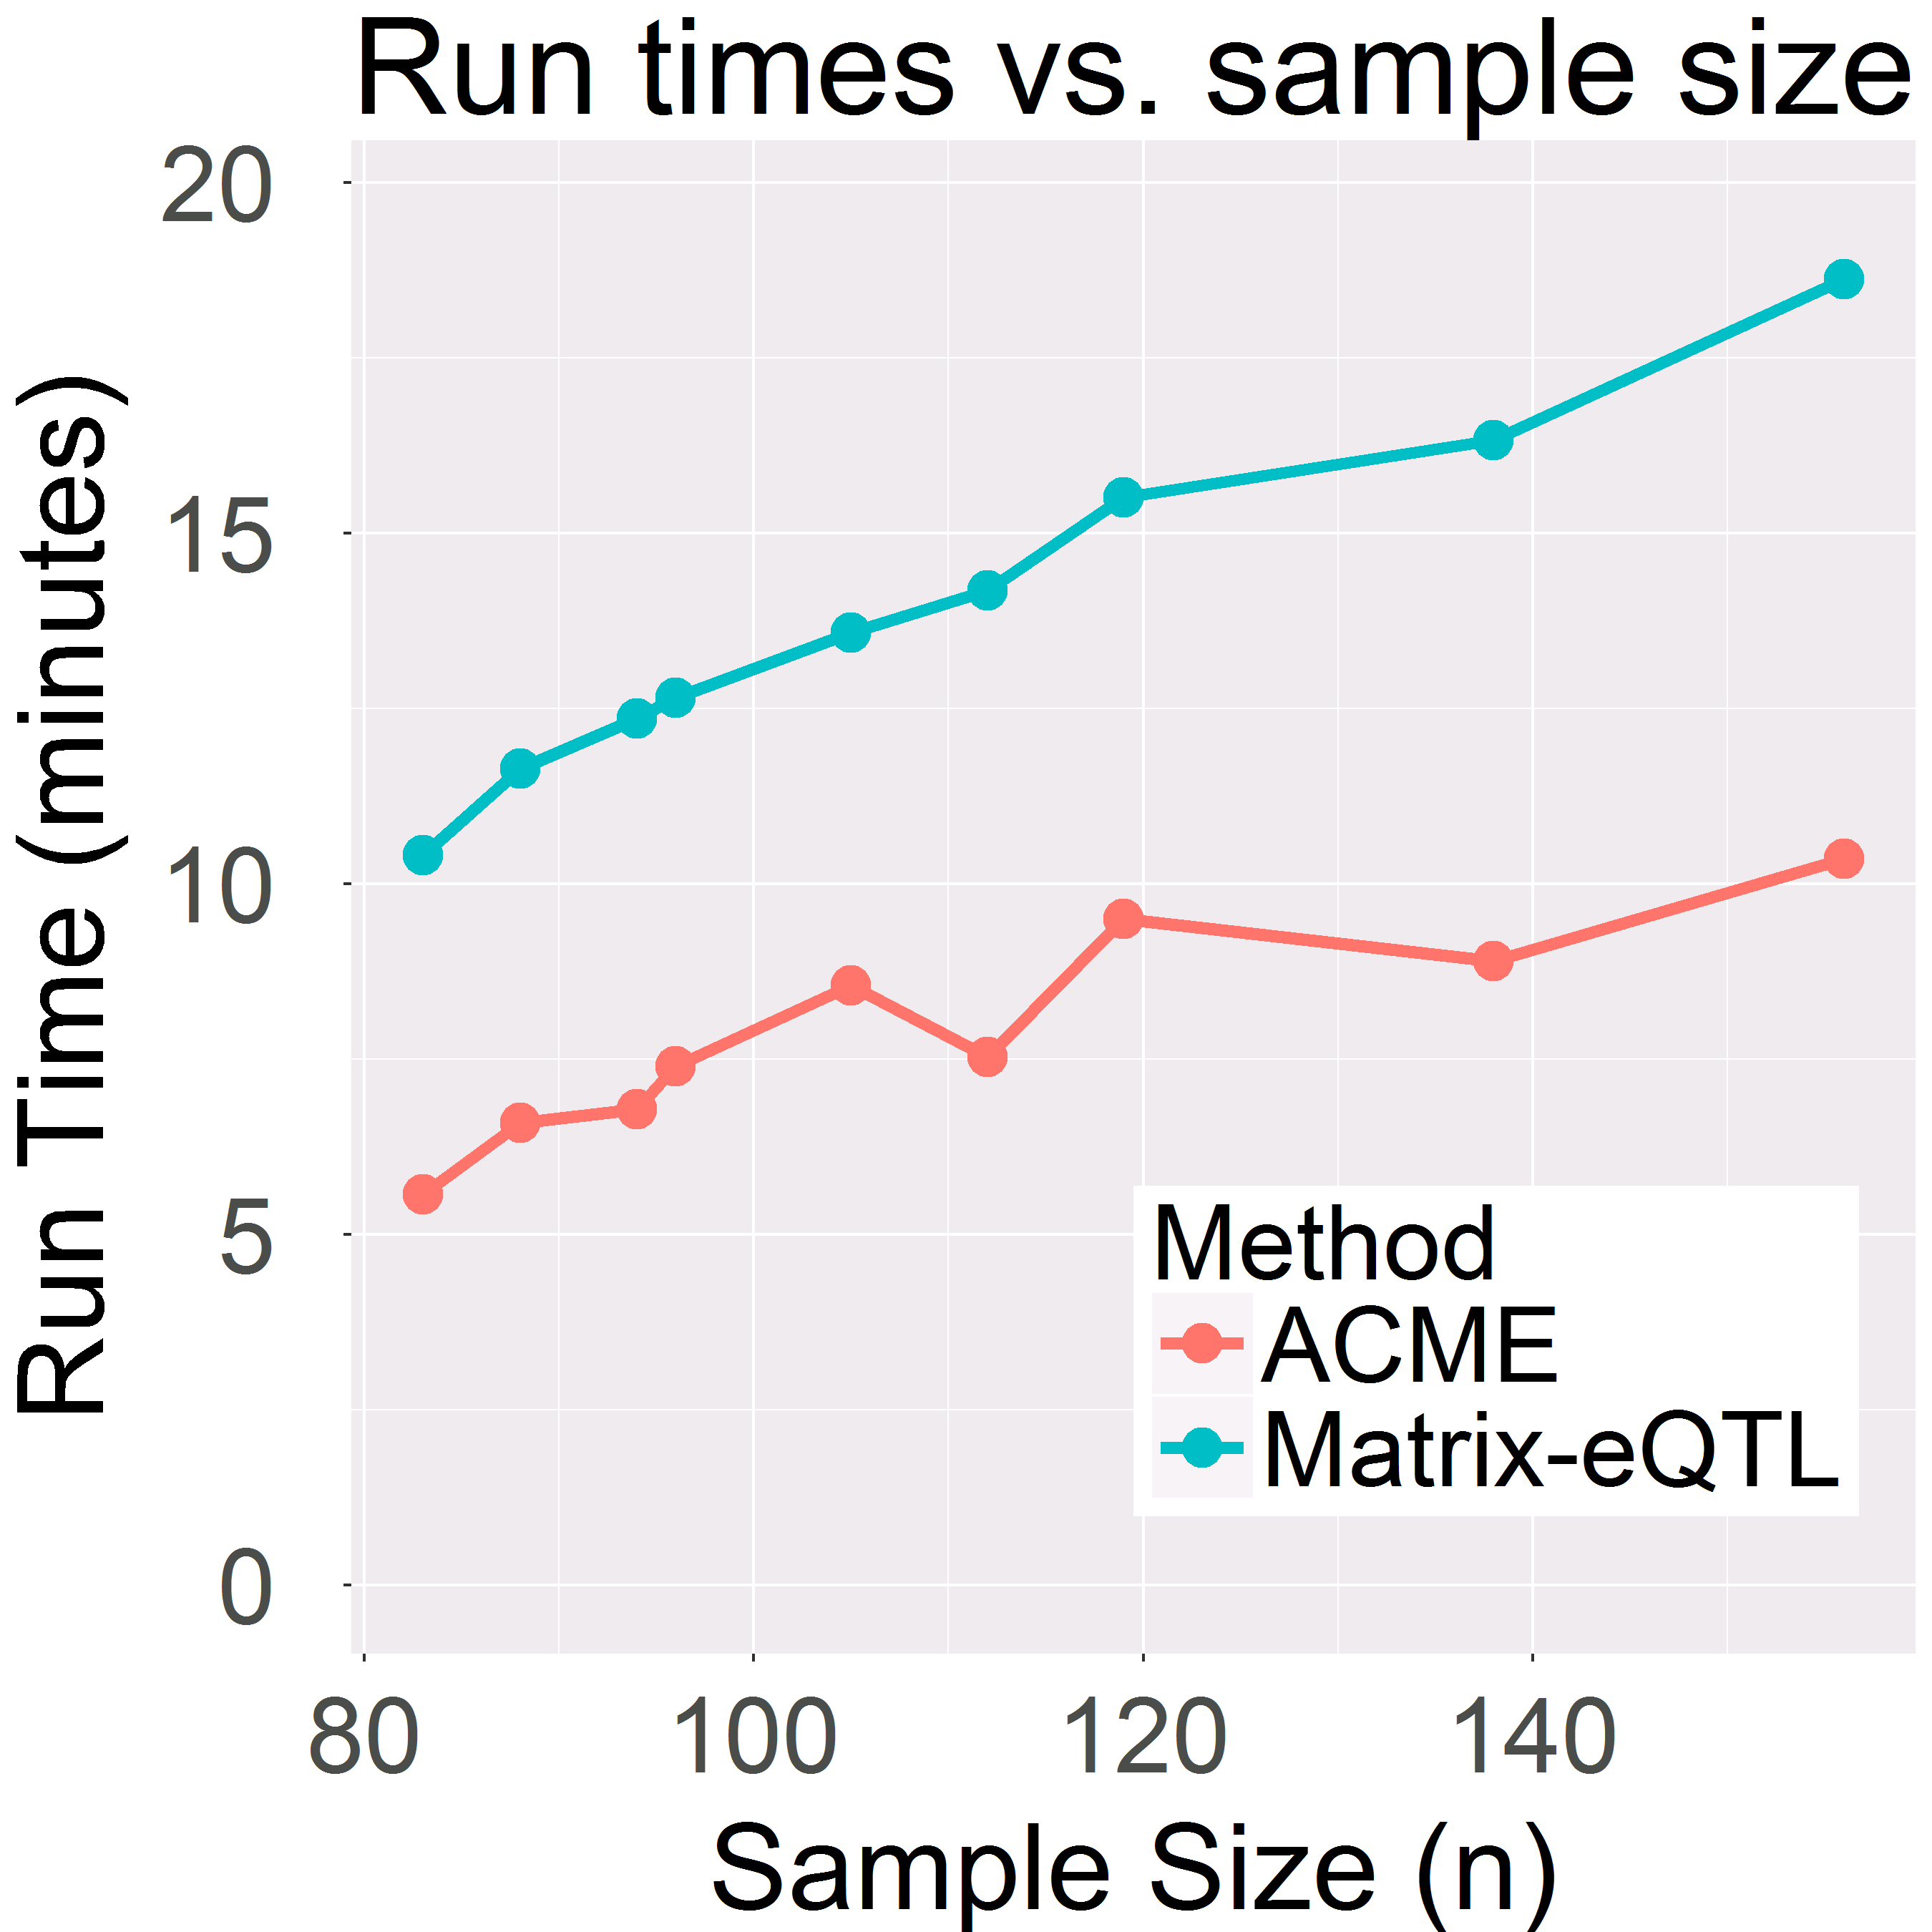
Computation times for real-data analyses were recorded for both the ACME and QN model fitting procedures, using the same PC as mentioned in Section 4.1. The packages and provide full-tissue cis-eQTL procedures for the QN and ACME models (respectively). We timed the run of each procedure on each of the nine tissues. The results are shown in the bottom-right of Figure 4. We note that the ACME software benefits from parallelization that the Matrix-EQTL software currently does not employ. This explains why the ACME full-tissue procedure is faster than Matrix-EQTL, even though the former is based on an iterative optimization procedure.
6 Discussion
We have proposed ACME, a new model for the effect-size of cis-eQTLs. ACME follows a simple additive model for cis-eQTL action, and is supported by careful analysis of real data. In particular, we show via goodness-of-fit tests that while the error distribution of gene expression is best modeled on the log-scale, cis-eQTL additive allelic effects occur on the original scale, contrary to assumptions implied by standard transformations. Beyond simply harmonizing some biological considerations regarding allele-specific expression, this analysis shows that a single parameter can be used in most instances to catalog the effect size of a cis-eQTL, and that dominance in cis-eQTLs appears to be rare. Simulations in Sections 3 and 4 showed the robustness and the superior power of the ACME model. Real-data analyses in Section 5 suggested that, for eQTL ranking purposes, estimates and p-values from standard models (QN and LL) are not adequate stand-ins for those from ACME. Furthermore, as seen in the goodness-of-fit tests, use of the QN-linear or LL models can create false evidence of dominance. Finally, we showed ACME estimation on all cis-pairs is computationally feasible, and have provided open-source software.
We believe the ACME model places cis-eQTL effect size analysis on a solid statistical foundation, and can be readily implemented in current eQTL studies. The results may be useful for investigations in which interpretable eQTL effect sizes and reliable rankings are relevant, such as examining enrichment and overlap with genome-wide association studies (Zhu et al., 2016). Furthermore, our analytic standard errors for ACME effect sizes allows ACME estimates to be used directly in methods for downstream analysis of multi-tissue eQTL variation (Flutre et al., 2013; Li et al., 2013).
Though we did not explore the application of the ACME model to trans-eQTL analysis, the ACME model can in principle be applied to trans-eQTLs. However, for trans-eQTLs, dominance effects may be more plausible, while current sample sizes may be inadequate to fully investigate such effects. Thus we consider the use of the ACME model for trans-eQTLs to be exploratory. Another possible extension is a multi-SNP ACME model. However, it is not obvious that allelic additivity should hold in a multi-SNP model. Nonetheless, to facilitate analysis, we have implemented a step-wise fitting algorithm for a multi-SNP ACME model using additivity across loci, with code included in our software package. These estimates can be used to consider preliminary ACME models that are additive in genotypes across SNPs, pending more rigorous development of a multi-SNP approach.
Supplementary Materials
Acknowledgements
GTEx data were from dbGaP phs000424.v3.p1 (http://www.gtexportal.org), supported by the NIH Common Fund (commonfund.nih.gov/GTEx). Supported in part by NIH R01MH101819-01, HG007840, NSF DMS1310002, and EPA RD83574701. The authors acknowledge many helpful conversations and phone calls with members of the GTEx Consortium.
References
- Ardlie et al. (2015) Ardlie, K. G., Deluca, D. S., Segrè, A. V., Sullivan, T. J., Young, T. R., Gelfand, E. T., Trowbridge, C. A., Maller, J. B., Tukiainen, T., Lek, M., et al. (2015). The genotype-tissue expression (gtex) pilot analysis: Multitissue gene regulation in humans. Science 348, 648–660.
- Azzalini and Dalla Valle (1996) Azzalini, A. and Dalla Valle, A. (1996). The multivariate skew-normal distribution. Biometrika 83, 715–726.
- Beasley et al. (2009) Beasley, T. M., Erickson, S., and Allison, D. B. (2009). Rank-based inverse normal transformations are increasingly used, but are they merited? Behavior Genetics 39, 580–595.
- Box and Cox (1964) Box, G. E. and Cox, D. R. (1964). An analysis of transformations. Journal of the Royal Statistical Society. Series B (Methodological) pages 211–252.
- Castel et al. (2015) Castel, S. E., Levy-Moonshine, A., Mohammadi, P., Banks, E., and Lappalainen, T. (2015). Tools and best practices for data processing in allelic expression analysis. Genome Biology 16, 1.
- Devlin and Roeder (1999) Devlin, B. and Roeder, K. (1999). Genomic control for association studies. Biometrics 55, 997–1004.
- Dixon et al. (2007) Dixon, A. L., Liang, L., Moffatt, M. F., Chen, W., Heath, S., Wong, K. C., Taylor, J., Burnett, E., Gut, I., Farrall, M., et al. (2007). A genome-wide association study of global gene expression. Nature Genetics 39, 1202–1207.
- Flutre et al. (2013) Flutre, T., Wen, X., Pritchard, J., and Stephens, M. (2013). A statistical framework for joint eqtl analysis in multiple tissues. PLoS genetics 9, e1003486.
- Gamazon et al. (2015) Gamazon, E. R., Wheeler, H. E., Shah, K. P., Mozaffari, S. V., Aquino-Michaels, K., Carroll, R. J., Eyler, A. E., Denny, J. C., Nicolae, D. L., Cox, N. J., et al. (2015). A gene-based association method for mapping traits using reference transcriptome data. Nature Genetics 47, 1091–1098.
- Gilad et al. (2008) Gilad, Y., Rifkin, S. A., and Pritchard, J. K. (2008). Revealing the architecture of gene regulation: the promise of eqtl studies. Trends In Genetics 24, 408–415.
- Grundberg et al. (2012) Grundberg, E., Small, K. S., Hedman, Å. K., Nica, A. C., Buil, A., Keildson, S., Bell, J. T., Yang, T.-P., Meduri, E., Barrett, A., et al. (2012). Mapping cis-and trans-regulatory effects across multiple tissues in twins. Nature genetics 44, 1084–1089.
- Irizarry et al. (2003) Irizarry, R. A., Hobbs, B., Collin, F., Beazer-Barclay, Y. D., Antonellis, K. J., Scherf, U., and Speed, T. P. (2003). Exploration, normalization, and summaries of high density oligonucleotide array probe level data. Biostatistics 4, 249–264.
- Li et al. (2013) Li, G., Shabalin, A. A., Rusyn, I., Wright, F. A., and Nobel, A. B. (2013). An empirical bayes approach for multiple tissue eqtl analysis. arXiv preprint arXiv:1311.2948 .
- Li et al. (2014) Li, Y., Liang, M., and Zhang, Z. (2014). Regression analysis of combined gene expression regulation in acute myeloid leukemia. PLOS Computational Biology 10, e1003908.
- Lonsdale et al. (2013) Lonsdale, J., Thomas, J., Salvatore, M., Phillips, R., Lo, E., Shad, S., Hasz, R., Walters, G., Garcia, F., Young, N., et al. (2013). The genotype-tissue expression (gtex) project. Nature Genetics 45, 580–585.
- McCarthy et al. (2012) McCarthy, D. J., Chen, Y., and Smyth, G. K. (2012). Differential expression analysis of multifactor rna-seq experiments with respect to biological variation. Nucleic Acids Research page gks042.
- Mohammadi et al. (2016) Mohammadi, P., Castel, S. E., Brown, A. A., and Lappalainen, T. (2016). Quantifying the regulatory effect size of cis-acting genetic variation using allelic fold change.
- Morley et al. (2004) Morley, M., Molony, C. M., Weber, T. M., Devlin, J. L., Ewens, K. G., Spielman, R. S., and Cheung, V. G. (2004). Genetic analysis of genome-wide variation in human gene expression. Nature 430, 743–747.
- Myers et al. (2007) Myers, A. J., Gibbs, J. R., Webster, J. A., Rohrer, K., Zhao, A., Marlowe, L., Kaleem, M., Leung, D., Bryden, L., Nath, P., et al. (2007). A survey of genetic human cortical gene expression. Nature Genetics 39, 1494–1499.
- Network et al. (2013) Network, C. G. A. R. et al. (2013). Genomic and epigenomic landscapes of adult de novo acute myeloid leukemia. The New England Journal of Medicine 368, 2059.
- Powell et al. (2013) Powell, J. E., Henders, A. K., McRae, A. F., Kim, J., Hemani, G., Martin, N. G., Dermitzakis, E. T., Gibson, G., Montgomery, G. W., and Visscher, P. M. (2013). Congruence of additive and non-additive effects on gene expression estimated from pedigree and snp data. PLOS Genetics 9, e1003502.
- Rantalainen et al. (2015) Rantalainen, M., Lindgren, C. M., and Holmes, C. C. (2015). Robust linear models for cis-eqtl analysis. PloS one 10, e0127882.
- Shabalin (2012) Shabalin, A. A. (2012). Matrix eqtl: ultra fast eqtl analysis via large matrix operations. Bioinformatics 28, 1353–1358.
- Smyth (2002) Smyth, G. K. (2002). Nonlinear regression. Encyclopedia of Environmetrics .
- Stegle et al. (2012) Stegle, O., Parts, L., Piipari, M., Winn, J., and Durbin, R. (2012). Using probabilistic estimation of expression residuals (peer) to obtain increased power and interpretability of gene expression analyses. Nature Protocols 7, 500–507.
- Stranger et al. (2007) Stranger, B. E., Nica, A. C., Forrest, M. S., Dimas, A., Bird, C. P., Beazley, C., Ingle, C. E., Dunning, M., Flicek, P., Koller, D., et al. (2007). Population genomics of human gene expression. Nature Genetics 39, 1217–1224.
- Szymczak et al. (2013) Szymczak, S., Scheinhardt, M. O., Zeller, T., Wild, P. S., Blankenberg, S., and Ziegler, A. (2013). Adaptive linear rank tests for eqtl studies. Statistics in Medicine 32, 524–537.
- Tokdar and Kass (2010) Tokdar, S. T. and Kass, R. E. (2010). Importance sampling: a review. Wiley Interdisciplinary Reviews: Computational Statistics 2, 54–60.
- Westra et al. (2013) Westra, H.-J., Peters, M. J., Esko, T., Yaghootkar, H., Schurmann, C., Kettunen, J., Christiansen, M. W., Fairfax, B. P., Schramm, K., Powell, J. E., et al. (2013). Systematic identification of trans eqtls as putative drivers of known disease associations. Nature Genetics 45, 1238–1243.
- Wright et al. (2012) Wright, F. A., Shabalin, A. A., and Rusyn, I. (2012). Computational tools for discovery and interpretation of expression quantitative trait loci. Pharmacogenomics 13, 343–352.
- Wright et al. (2014) Wright, F. A., Sullivan, P. F., Brooks, A. I., Zou, F., Sun, W., Xia, K., Madar, V., Jansen, R., Chung, W., Zhou, Y.-H., et al. (2014). Heritability and genomics of gene expression in peripheral blood. Nature Genetics 46, 430–437.
- Zhou and Wright (2015) Zhou, Y.-H. and Wright, F. A. (2015). Hypothesis testing at the extremes: fast and robust association for high-throughput data. Biostatistics page kxv007.
- Zhou et al. (2011) Zhou, Y.-H., Xia, K., and Wright, F. A. (2011). A powerful and flexible approach to the analysis of rna sequence count data. Bioinformatics 27, 2672–2678.
- Zhu et al. (2016) Zhu, Z., Zhang, F., Hu, H., Bakshi, A., Robinson, M. R., Powell, J. E., Montgomery, G. W., Goddard, M. E., Wray, N. R., Visscher, P. M., et al. (2016). Integration of summary data from gwas and eqtl studies predicts complex trait gene targets. Nature Genetics .
- Zwiener et al. (2014) Zwiener, I., Frisch, B., and Binder, H. (2014). Transforming rna-seq data to improve the performance of prognostic gene signatures. PlOS One 9, e85150.