Secondary radiation measurements for particle therapy applications: prompt photons produced by 4He, 12C and 16O ion beams in a PMMA target
Abstract
Charged particle beams are used in Particle Therapy (PT) to treat oncological patients due to
their selective dose deposition in tissues with respect to photons and electrons used in conventional radiotherapy. Heavy (Z1) PT beams can additionally exploit their high biological effect in killing cancer cells. Nowadays, protons and carbon ions are used in PT clinical routine.
Recently, the interest on the potential application of helium and oxygen beams is growing: with respect to protons such beams are characterized by their reduced multiple scattering inside the body and increased linear energy transfer, relative biological effectiveness and oxygen enhancement ratio.
The precision of PT demands for online dose monitoring techniques, crucial to improve the quality assurance of treatments: possible patient mis-positionings and tissues biological changes with respect to the CT scan could negatively affect the therapy outcome. The beam range confined in the irradiated target can be monitored thanks to the neutral or charged secondary radiation emitted by the interactions of hadron beams with matter. Among these secondary products, prompt photons are produced by nuclear de-excitation processes and, at present, different dose monitoring and beam range verification techniques based on the prompt- detection have been proposed. It is hence of importance to perform the yield measurement in therapeutical-like conditions.
In this paper we report the yields of prompt photons produced by the interaction of helium,
carbon and oxygen ion beams with a poly-methyl methacrylate (PMMA) beam stopping target.
The measurements were performed at the Heidelberg Ion-Beam Therapy center (HIT) with
beams of different energies. A LYSO scintillator, placed at
and with respect to the beam direction, has been used as photon detector.
The obtained yields for carbon ion beams are compared with results from literature, while no other results from helium and oxygen beams have been published yet. A discussion on the expected resolution of a slit camera detector is presented, demonstrating the feasibility of a prompt- based monitoring technique for PT treatments using helium, carbon and oxygen ion beams.
Introduction
Particle Therapy (PT) exploits the characteristic energy release in matter of charged particles, mainly protons and carbon ions, in the irradiation of tumor volumes trying to spare as much as possible the surrounding healthy tissues. In comparison to the most advanced photon radiotherapy technique, protons and carbon ions have the advantageous feature of a high Linear Energy Transfer (LET) and increased Relative Biological Effectiveness (RBE), which make those particles particularly favourable in treating radio-resistant tumors [Loeffer13]. Beside protons and carbon ions, helium and oxygen ion beams are currently investigated as PT candidates [TommasinoHeO]: helium ions suffer less lateral multiple scattering with a consequent reduced beam broadening with respect to protons, providing a good solution in the irradiation of radio-resistant tumors when low beam fragmentation is required [Fuchs]. Oxygen ions could be of advantage when increasing efficiency in treating radio-resistant tumors is needed due to their higher LET, RBE and Oxygen Enhancement Ratio (OER) with respect to protons, carbons and heliums [Kurz].
The high selectivity of PT makes this technique particularly sensitive to possible patient mis-positionings and anatomical variations, asking for the development of an online beam range monitor. This should be able to provide a feedback on the dose deposition spatial distribution during the treatment in order to improve its
quality and efficacy: the lack of a precise online monitoring is one of
the key issues to be addressed to support the diffusion of PT
therapies in clinical centers. The beam range monitoring takes advantage of the secondary radiation
produced by the interactions of the beam with the target
nuclei along the path inside the target volume: the beam is
stopped inside the patient and the secondaries escaping from the body
can be detected, their emission profile reconstructed and used to monitor the beam
dose deposition and range.
So far, the most established PT beam monitoring technique is based on the detection of back-to-back photons produced by the annihilation positrons coming from emitters (PET photons) using the Positron Emission Tomography (PET) technique. Nevertheless, the signal level is lower in comparison with PET signals known from clinical diagnostics, and at present such technique is used off-line, after the patient irradiation, aiming for further investigation methods [Paro13].
A technology capable of on-line PET detection [Pawelke1997, Parodi2002, Priegnitz2008, Fiedler2008] is
currently under development [Attanasi2009, Vecchio2009, Inside, Inside2].
The characterization of the secondary radiation
produced by p and 12C beams of therapeutical energy has been the subject
of an intensive experimental campaign in the recent past: the
production of PET photons [Enghardt2004, Agodi2012Beta],
light charged fragments [Agodi2012CP, Henriquet2012, Gwosch2013, Piersanti2014] and
prompt photons, main object of this contribution, has been studied in different experimental
conditions [aafke2015].
In particular, the prompt- production has been recently investigated by several
experiments performed using p and 12C beams of several energies:
[Testa2008, Testa2009],
[Agodi2012PP, AgodiERRATA],
[GsiLYSO220],
,
and
[Pinto2015, Testa2010]. The prompt- yield
estimation is of particular importance since it strongly affects the achievable resolution on the evaluation
of the hadron beam range. The main interests
in using this kind of secondary radiation for monitoring purposes are related to
its large abundance and the high
precision achievable on the emission point reconstruction
in absence of multiple scattering interactions.
In this paper we present the results of prompt photons production measurements performed using 4He, 12C and 16O beams, available at the Heidelberg Ion-beam Therapy center (HIT, Heidelberg, Germany), interacting with a beam stopping PMMA target.
The experimental setup used for the data acquisition is described in detail in § 1, while the results obtained with the LYSO detector at and with respect to the beam direction are discussed in § 2 and compared with the results available from literature. The discussion of the measured fluxes in the context of monitoring applications can be found in § 3, taking as a reference detector for prompt gamma monitoring the IBA knife edge slit camera. Particular care has been made to quantify the impact of the collectable statistics of prompt photons emitted in Particle Therapy with heavy ions clinical like scenarios on the precision achievable on the dose deposition monitoring.
The experimental apparatus did not allow a measurement of the prompt photons production position and hence a disentangling of the photons production induced by the primary incoming radiation and of the secondary photons produced after the Bragg Peak region was not possible. The implications for the prompt photons monitoring are detailed in § 3.
1 Experimental setup
The experiment was performed at the HIT center where
different ion species of several energies were used to irradiate
a poly-methyl methacrylate (PMMA) target to study the prompt- radiation emitted from the interactions of the beam
projectiles with the target nuclei.
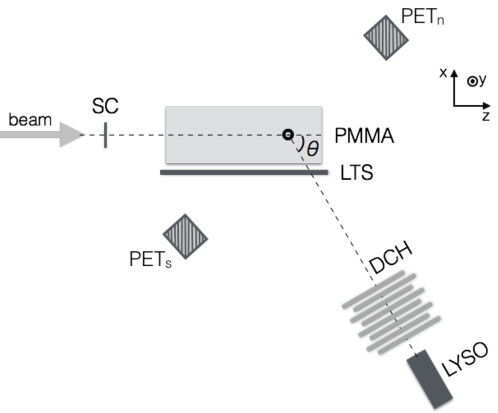
Figure 1 shows the experimental setup, which is part of a more extended geometry meant to measure not only the prompt photon radiation, but also secondary charged particles, PET photons and forward emitted heavy fragments.
The origin of the reference frame is marked by the black spot inside the PMMA target. The beam, coming from the left along the z axis, is illustrated with an arrow. To detect the incoming primary particles, a plastic scintillator (EJ) thick (Start Counter, SC) was placed upstream the PMMA. The SC was read by two photomultiplier tubes (PMTs) - Hamamatsu H - each one giving a recorded signal (SC1, SC2). The SC, used as a trigger detector, provided the number of impinging ions and the reference time for the Time of Flight (ToF) measurements.
The PMMA target dimensions are , where tPMMA is the PMMA thickness that depends on the penetration depth of the primary beam and experimental setup configuration used during the data acquisition (see Table 1). The uncertainty on tPMMA is . For the 4He and 16O ions data collection, in order to keep the Bragg Peak (BP) position fixed for all the beam energies, the size of the PMMA was changed according to the energy and range (BP depth) of each beam. For the carbon ion data acquisition the PMMA thickness was fixed at regardless of the incoming beam energy, still ensuring that the beam stops within the PMMA.
A Long Thin Scintillator (LTS) , read by a H PMT, was placed on the PMMA lateral face in order to identify and study secondary charged particles. A long Drift CHamber (DCH) was mechanically aligned with the reference frame origin and was placed at a distance of from the PMMA center. The DCH, described in details in [AbouHaidar, Agodi2012CP, Piersanti2014], was used to identify and reject the background from low energy charged particles (see § 2).
Prompt photons were detected by a matrix of scintillating lutetium yttrium orthosilicate (LYSO) crystals, each, described in detail in [Agodi2012PP]. The detector was placed behind the DCH exit face and was mechanically aligned with the reference frame origin. In order to discriminate the LYSO signal from the LYSO intrinsic background, a PMT threshold has been set corresponding to a calibrated LYSO deposited energy of .
The energy calibration of the LYSO scintillator was performed with the final data acquisition setup at the HIT center using a radioactive source of . The data collected have been used to provide the reference point needed for the implementation of a former calibration of the very same crystal that was performed in the range of interest for prompt photons emission studies, with a different experimental setup, and is documented in detail in a separate manuscript [Bellini2014]. A linear calibration curve, up to , is assumed following the results obtained in the extended calibration energy range study presented in [Bellini2014]. The ToF slewing effect induced by the front-end electronics fixed voltage threshold was taken into account following the procedure described in [Agodi2012PP, AgodiERRATA].
The DCH and LYSO detectors were attached to the same movable aluminum arm. This arm could be placed at different angles with respect to the beam direction (), i.e. and , in order to measure the angular dependence of the prompt- emission. The total distance of the LYSO from the PMMA center was in the setup and in the setup.
Fig. 1 shows also the positioning of two LYSO pixellated -PET detectors (PETs and PETn) used to monitor the production of emitters111The obtained results, as well as the experimental methods, will be the subject of a dedicated manuscript, currently in preparation, and will be hence documented in detail elsewhere. during the PMMA irradiation. The PET trigger line required the coincidence in time of the signals of the LYSO detectors and was independent from the SC signals in order to allow the measurements of the induced activity also when the beam was not impinging on the target.
The -PET detectors were included in the simulation of the experimental apparatus and used to provide an independent check on the number of incoming ions, as described in § 2.3.
| Ion | Energy | B | Range | t | |
| (MeV/u) | (mm) | (cm) | (cm) | ||
| 7.9 | 2.88 | 10.00 | |||
| 6.2 | 4.83 | ||||
| 5.5 | 6.03 | ||||
| 4.7 | 8.33 | ||||
| 102.34 | 9.3 | 6.68 | 7.65 | ||
| 7.8 | - | ||||
| 6.9 | 12.63 | 12.65 | |||
| 4.6 | 5.78 | 7.65 | - | ||
| 3.9 | 8.38 | 10.00 | |||
| 3.6 | 10.68 | 12.65 |
Table 1 summarizes the measured setup configurations relative to the collected data sample. For each ion species, the beam energy (Energy) and spot size (BFWHM) as the Full Width at Half Maximum (FWHM) from the HIT libraries are reported (later in the text, the beam energies will be approximated values). The relative error on the HIT beam energies is of [ParodiHIT]. The beam range in PMMA, defined as the BP position depth inside the target (Range), was computed using a FLUKA Monte Carlo (MC) simulation [Ferrari2005, Boehlen2014, Battistoni2015]. The error on the reported Range values is , determined from the simulated Bragg curves of each beam impinging on a PMMA target (density: ; ionisation potential: ). For each data taking, the PMMA thickness (tPMMA) and the DCH - LYSO angular configuration () are also listed.
The Data AcQuisition (DAQ) trigger was provided by the time coincidence of the logic OR of the SC signals (SC1 or SC2) with the LYSO signal. This choice was driven by the need to optimize the data sample collection efficiency and to allow for a measurement of the SC detector efficiency. It has to be noted that the data analysis performed for the prompt photons study requires the AND of the SC1, SC2 signals in all the steps, to minimize the contribution of random electronic noise to the measurement of the number of incoming ions.
All electronic signals were read-out by a VME system (CAEN V2718 VME-PCI bridge) interfaced with a PC for the DAQ. The time and charge information for the signals of all the detectors were acquired using a -bit TDC Multi-hit (CAEN V1190B, time resolution of ), and a -bit QDC (CAEN V792N, resolution of ). The digitization of the time information was accomplished by means of a discrimination system in which the digital output signals had a width. The impact of this choice in the counting of events with multiple ions impinging on the SC is discussed in detail below (§ 1.1).
The number of impinging ions was counted by means of a VME scaler (CAEN V560 N), using the logic AND of the SC signals (SC1 and SC2, defined as SCAND). The VME scaler is capable of sustaining an incoming signal rate up to .
1.1 Beam description
The ion beams provided by the HIT facility are accelerated using a synchrotron. The incoming beam rate, kept under the limit set by the SC signal discrimination time used for the ToF measurements, ranged from up to , depending on the ion beam species. Such rate has been heavily reduced with respect to the therapeutical rates in order to allow the experimental data taking.
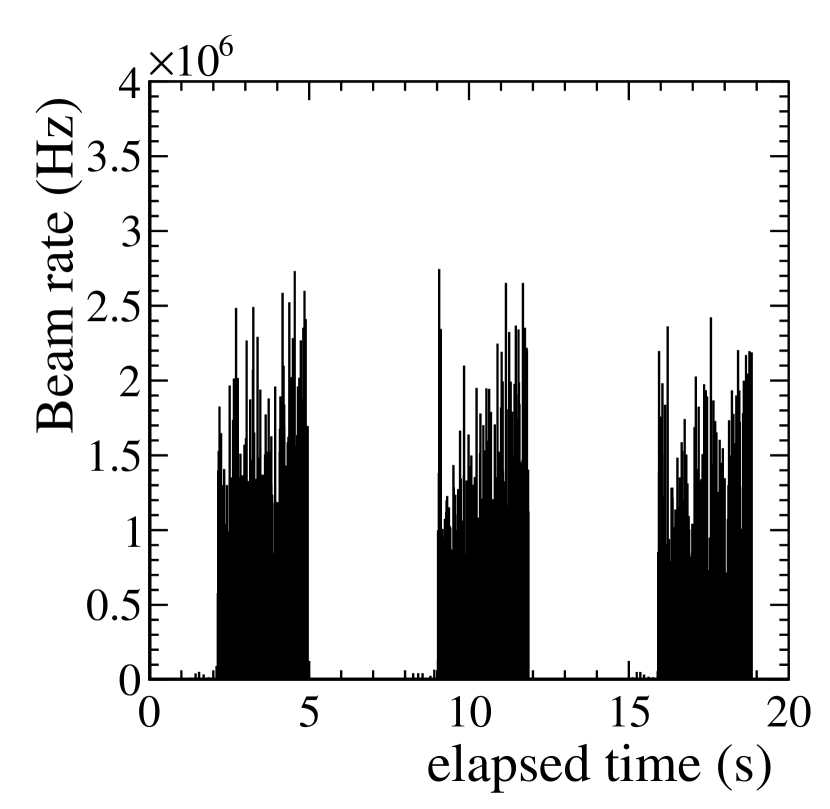
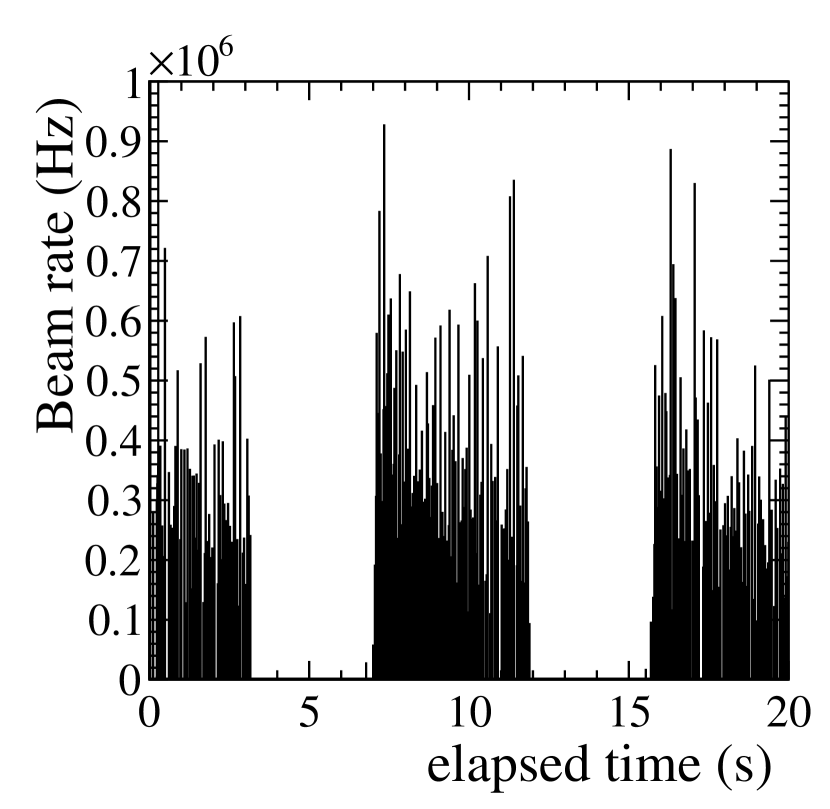
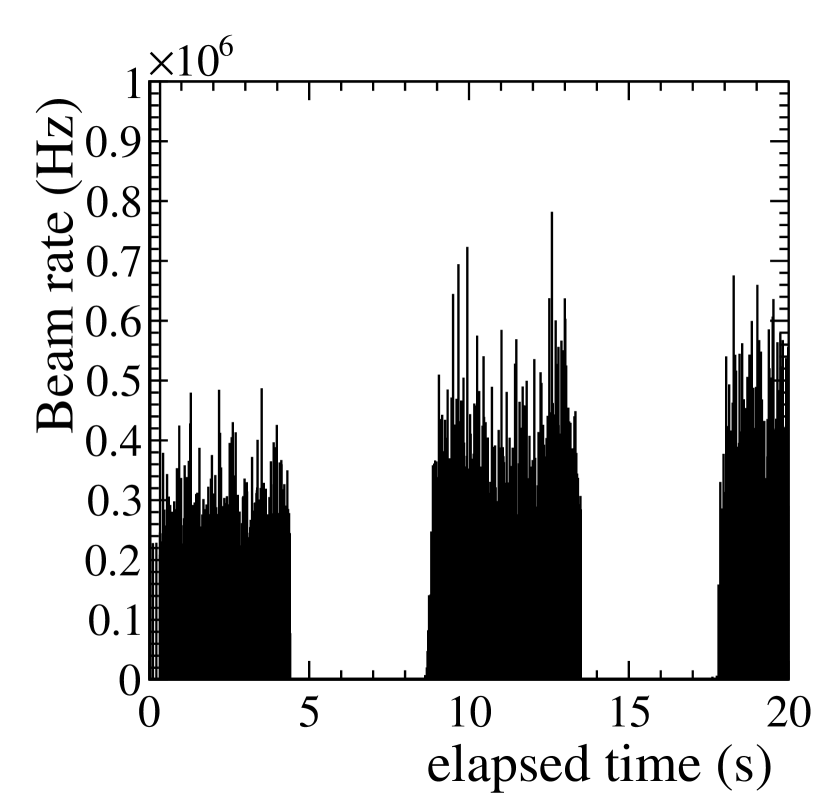
The beam time profile (Beam rate) is shown for 4He (left), 12C (center) and 16O (right) data samples in Fig. 2 as a function of the elapsed data taking time (elapsed time). The spill structure of the beam is clearly visible.
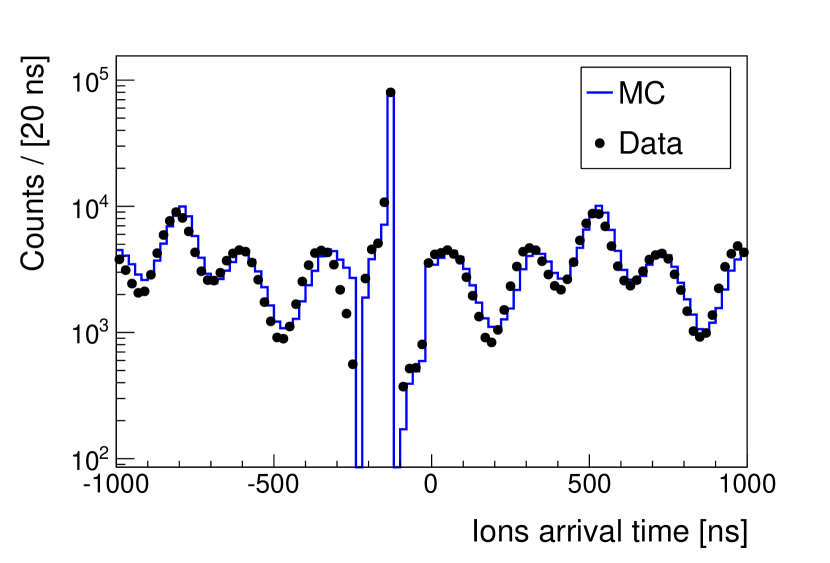
The fine structure of the beam, instead, has been measured by means of the multi hit TDC in a window around the trigger time, and it is shown in black dots in Fig. 3 (left) for events collected using the 4He beams of . Similar spectra have been obtained also for the 12C and 16O beams. Using the beam fine structure measured in a time window far from the trigger, e.g. for the 4He events in the – window, a MC simulation has been performed in order to account for the inefficiencies, in the detection of multiple ions events, introduced by the fixed time window set by the discriminators used to process the analogic signals from the SC detector. The ions rate used to generate the events in the MC simulation has been tuned to optimize the agreement between the MC (shown as histograms in blue continuos lines) and the data (shown as black dots) measured distributions shown in Fig. 3. A remarkable agreement is observed, allowing a reliable measurement of the discrimination window induced inefficiencies.
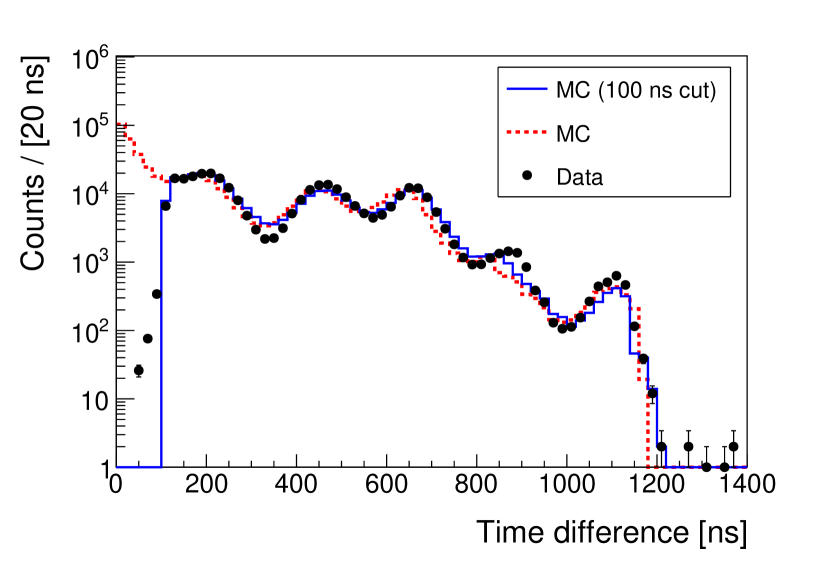
The difference in time arrival of multiple ions is shown in Fig. 3 (right), in black dots for the collected data, and shows the inefficiency introduced for ions impinging on the SC with a time distance that is smaller than . The red dashed line in Fig. 3 (right) shows the difference in arrival time of all the simulated ions, while the blue continuous line shows the time difference after the discrimination window is taken into account. The systematic uncertainties related to the inefficiencies measurement are discussed in § 2.2.
The beam spot size , as reported in Table 1, is inversely proportional to the beam energy for each ion species. It ranges between – for 4He beams, – for 12C beams and – for 16O beams.
The maximum trigger rate was , limit set by the DAQ dead time. The trigger lines were set up for the different measurements pointed out at the beginning of 1: forward fragmentation studies, charged particles and prompt photons production at large angle and emitters production. The trigger line used for the prompt photon studies had a mean rate in the – range, depending on the beam conditions, and contributed for the – of the total trigger rate.
2 Prompt photon yield
The yield of prompt photons produced by the ion beam
projectiles interaction with the PMMA target, normalized to the total
solid angle and integrated over the full target length, has been
computed according to the following equation:
| (1) |
where is the number of prompt photons measured by the LYSO detector in the energy range, is the total number of primary ions impinging on the PMMA target, is the total detector efficiency (including the detector and geometrical contributions) and is the data acquisition dead time efficiency.
Although the analysis has been performed starting from , the lower limit in the energy range for the yield evaluation was conservatively set to . Above this threshold, the background contribution, mainly due to intrinsic radioactivity of LYSO, electronic noise and neutrons, becomes negligible. The energy upper limit in the yield evaluation was set to : above that energy we expected no significant de-excitation gamma lines from carbon and oxygen nuclei or their residues produced by nuclear reactions (National Nuclear Data Center - www.nndc.bnl.gov).
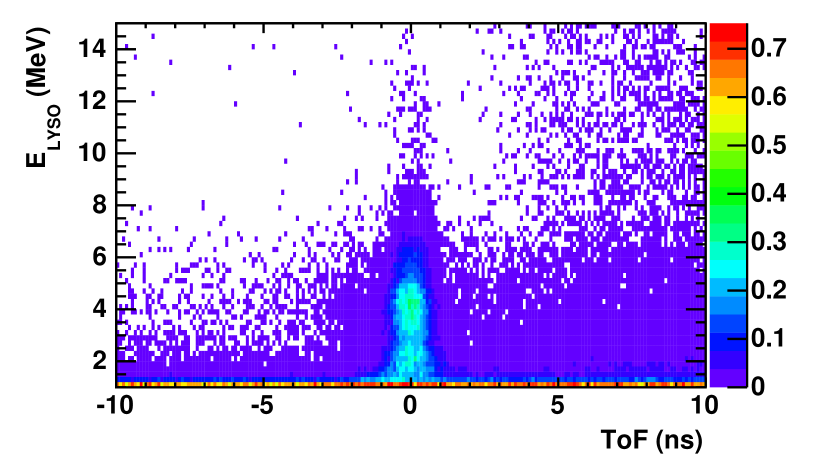
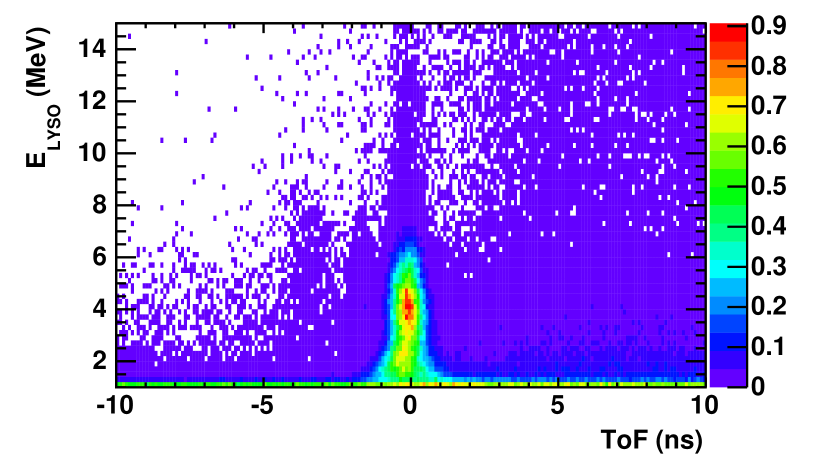
The prompt photons number has been evaluated starting from the 2-dimensional distribution of the deposited energy in the crystal () as a function of the Time of Flight (ToF) of secondaries interacting in the LYSO (see Fig. 4).
The ToF is defined as the time difference between the signal detected in the LYSO and the signal detected in the SC (SCAND) induced by a traversing ion (). In this definition of ToF, the time slewing effect is corrected following the same procedure described in [Agodi2012PP].
Fig. 4 shows, as an example, the vs ToF distribution used to select the prompt- signal for the events taken using 4He (left) and 16O (right) ions as projectiles. The distributions have been obtained combining the data obtained in the different energy configurations and collected at 90 degrees. A scaling factor has been applied to both histograms in order to normalize the distributions to the same statistics (107 events). The horizontal low energy band visible in both plots ( MeV) is related to the LYSO intrinsic noise, while the diffused cloud is associated to neutrons, with a ToF that is almost uncorrelated to the SC signal. The vertical band at is relative to the prompt photons signal.
has been computed from the reduced ToF (ToF/) distributions, selected in the interval and sampled in bins of . The values have been extracted from the time slewing correction procedure, where the ToF distributions sampled in bins have been modeled with a gaussian function (more details can be found in [Agodi2012PP]). The number of prompt photons has been extracted from an unbinned maximum likelihood fit, performed using the RooFit toolkit from ROOT [ROOFIT], to the reduced time distribution for each energy bin. Fig. 5 shows two examples of reduced time distributions in lower (, shown in the left) and higher (, shown in the right) energy bins for a helium ion beam run with the LYSO detector placed at .
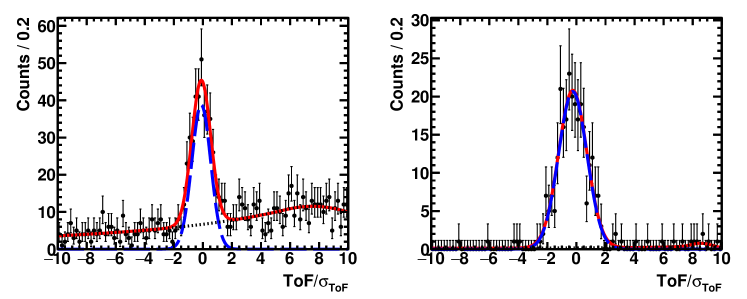
The total fit function (solid line) is superimposed to the data spectrum: the background, mainly due to neutrons, is described by a Crystal Ball [Skwarnicki1986] shape (dotted line), while the signal is modeled using a gaussian Probability Density Function (PDF, dashed line). The Crystal Ball function well represents the neutron background, especially in the low energy range (). The background coming from low energy charged particles has been reduced by requiring that the number of hits detected in the drift chamber () is less than three (the average number of hits detected for a charged particle traversing the DCH is 12). As a cross-check of the charged particle background relevance in the final result, the LTS detector has been used as an additional veto for charged particles: the combined use of DCH and LTS did not result in a sensible change of the yields and hence we did not explictly include the LTS charged particles veto in the final analysis.
The dead time (DT) efficiency has been evaluated using the VME scaler in which all the generated trigger signals () and the triggers signals acquired by the DAQ system (), were counted. The DT efficiency, defined as varied from to , depending on the beam rate. Average values of for the different data taking conditions (ion species, beam energies and angular configurations) have been used to compute the integrated yields using Eq. 1.
The total number of primary ions impinging on the PMMA target is defined as where is the number of primary ions computed counting the number of SCAND signals over threshold as described in § 1.
The obtained counts have to be corrected by , a correction factor that takes into account the inefficiency due to the dead time introduced by the width of the SC discriminated signals.
As discussed in § 1.1, and shown in Fig. 3 (right), this correction has been evaluated as the average fraction of lost ions using a dedicated MC simulation tuned in order to reproduce the temporal beam structure of each data set that was acquired. was measured as the ratio of all the events impinging on the SC, without applying any cut (as shown in Fig. 3 right, red dashed histogram), to the number of events in which the arrival time difference of multiple ions was greater than (as shown in Fig. 3 right, blue solid histogram). The measured values, computed for each data set to take into account the different beam rates, are in the range .
2.1 MC simulation
The detector and geometrical efficiencies () have been computed using a MC simulation based on the FLUKA code, that implemented all the experimental configuration (beam characteristics and experimental setup as described in § 1 by Table 1 and shown in Fig. 1).
The total efficiency has been defined as the ratio of to , where is the number of prompt photons measured by the LYSO detector, after having applied the same signal selections performed in the experimental data analysis, and is the number of prompt photons produced with energy by the ion beam interacting with the PMMA target. The computed ranges from up to , depending on the different experimental setup conditions.
The computed efficiency depends only on the modeling of the prompt photon transport from the production point inside the PMMA target up to the LYSO detector. There is no dependence of the measured efficiency on the nuclear models used in FLUKA to generate the prompt photons emission spectrum as we are only taking into account the attenuation due to the interactions with matter of the emitted photons (related to the positioning and composition of the target and experimental setup), averaging on their production position and energy. Care has been taken in order to ensure that a significant statistics was collected for all the relevant energies and emission positions allowing a measurement in which the dominant contribution to the uncertainty was systematic.
As the interactions with matter of the photons in the 1–20 MeV energy range is know to be very well reproduced in FLUKA, particular care has been made in setting up a simulation in which all the detector and experimental apparatus parts were properly included and positioned, especially those traversed by the photons in their path towards the LYSO detector. The uncertainty related to the geometrical survey measurements and detector description details on the efficiency measurements are discussed in the systematic uncertainty section (§ 2.3).
2.2 Results
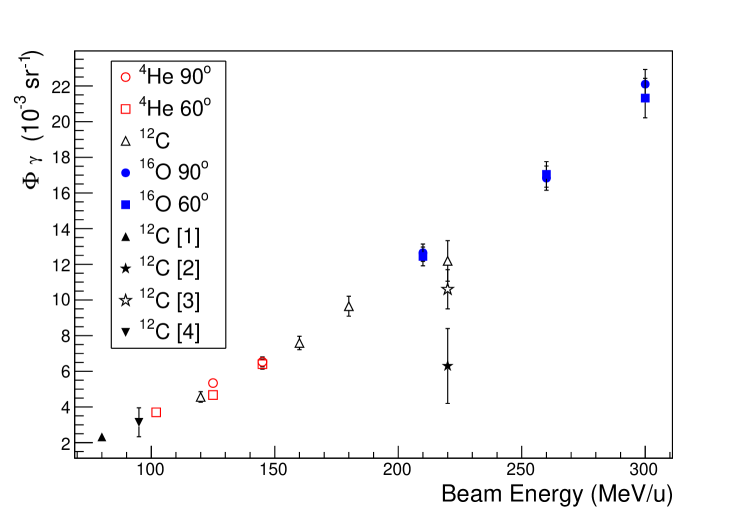
The production yields of prompt photons () produced by 4He ,12C and 16O ion beams, computed according to Eq. 1, measured with the detector in the angular configuration at and , with a deposited energy E , integrated over the full target size and averaged in a full solid angle, for the different ion beam energies are listed in Table 2. For each ion species, increases with increasing energy, both at and , while no angular dependence is evidenced in the integrated production yield. Furthermore, as a first approximation, an universal behavior as a function of the primary energy exists independently of the nuclear species, as shown in Fig. 6.
It has to be noted that the results presented in this manuscript are related to the total integrated production of prompt photons occuring as a direct consequence of the interactions of primary ions with the target medium (primary component) that is limited up to the BP region and of the other indirect nuclear processes (secondary component) that can lead to a significant prompt photons production even after the BP region [Pinto2015]. While the data collected with the most energetic 12C beam and the 4He and 16O beams had a BP position that was close (1 cm or less) to the exit (rear) PMMA face, and hence the secondary production of photons can be considered as similar and subdominant in all cases, particular care has to be taken when comparing the low energy carbon yields with results obtained in other experimental conditions. However, the nice agreement of the yields shown in Fig. 6 for the 12C beam at 120 MeV/u and the measurement presented in [Pinto2015] (12C at 95 MeV/u) and in [AgodiERRATA] (12C at 80 MeV/u) obtained in completely different experimental conditions are suggesting that the secondary component, while certainly present, is not dominant for those beam and (low) energy pair conditions.
| Ion | Energy | ||
|---|---|---|---|
| (MeV/u) | |||
| 125 | |||
| 145 | |||
| 120 | |||
| 160 | |||
| 180 | |||
| 220 | |||
| 210 | |||
| 260 | |||
| 300 | |||
| 102 | |||
| 125 | |||
| 145 | |||
| 210 | |||
| 260 | |||
| 300 |
The results from carbon ion beams have been compared with other results from literature. As reported in [GsiLYSO220], the prompt photon production yield obtained from a 12C beam impinging on a PMMA target, integrated over the full target size () and averaged in a full solid angle, measured with a LYSO detector at the GSI (Darmstadt, Germany) facility is . This experimental result is less than 3 standard deviation away from the correspondent HIT yield shown in Table 2.
The production yield was also measured at GSI using a BaF2 detector [GsiBAF] obtaining a value of , in agreement within 1 standard deviation with the corresponding value shown in Table 2.
The measured yields were also compared with what presented in [Pinto2015], where the prompt- absolute yield produced by a 12C beam interacting with a PMMA target, with an energy threshold of , averaged over the full beam range, was reported to be . In order to relate the integrated yield produced by the carbon ion beam shown in Table 2 with the Pinto’s result, we used an estimate of the full projected range for our beam of , as estimated by SRIM 2013. With this assumption, the normalized rate becomes , in agreement with what measured in [Pinto2015].
2.3 Systematic uncertainties
Several sources are contributing to the total systematic uncertainty () on the integrated absolute yield.
The value was computed using an unbinned maximum likelihood fit of the reduced ToF distributions. In order to evaluate the systematics related to the signal and background fit models, a different approach to count the signal events has been used. The background contribution in the signal region (ToF/) has been extrapolated from the unbinned fit of the SideBands (SB) of the ToF/ spectra (ToF/). Therefore, the signal events have been computed as the total number of events in the signal region after the subtraction of the background as obtained from the SB extrapolation. The difference between the values obtained for from the SB subtraction method and the full fit analysis, significant only for the cases of 12C beams, has been used as an estimate of the systematic source from the evaluation and added in quadrature to in the computation of the 12C . The relative contribution of the systematics to the total uncertainty varies from up to .
The measured total number of primaries impinging on the PMMA target has been computed using the number of SCAND signals (NSCAND). In order to evaluate the systematic uncertainty due the NSCAND evaluation, an independent measurement of is necessary. It has been provided by the trigger line of the PET photons measurement, since the PET trigger is not related to the SC detector, though it is related to the true number of ions interacting in the target. The correlation between the number of PET triggers (NPET) and the SCAND signals has therefore been studied and founded to be within the statistical uncertainty of NPET. Since this is the intrinsic limit of the systematic error on , the statistical fluctuation of NPET has been assigned as systematic uncertainty to the estimated number of primaries. The relative contribution to the total uncertainty from this source ranges between .
As already discussed beforehand, the measurement has been corrected taking into account the inefficiency in the selection of multiple ions impinging on the SC at times smaller than 100 ns using the correction factor . The details on the MC simulation that has been setup to account for this inefficiency are given in § 1.1. The systematic uncertainty due to this MC correction has been evaluated by performing a dedicated study in which the beam rate and the spill shape of the MC model have been varied within the uncertainties. The beam rate was changed from the value obtained by the data/MC agreement tuning to the mean value measured on data while the beam shape, obtained from a fit to the data sample, has been varied to take into account the uncertainties on the fit parameters and fit range. The relative contribution to the total uncertainty from this source varies from up to .
The systematic uncertainty on the total efficiency has been computed by using the FLUKA MC simulation and varying the simulated setup geometry, in order to account for the uncertainty on the relative positions of the different detectors and of the PMMA target, and beam size. The overall contribution to the total systematic uncertainty was found to be negligible in all cases.
The systematic error due to the maximum energy cut () in the integral computation has been checked against the MC simulation: the fraction of photons above that threshold () is of the order of for the Helium and Carbon cases and for the Oxygen beam of at . For the other Oxygen configurations is and has been added to .
Another possible systematic source to the yield evaluation is the lower limit of the energy range for the integral computation, due to possible energy shifts depending on the LYSO calibration curve. A systematic on the LYSO calibration has therefore been computed varying the calibration parameters of around their mean values and taking into account their correlation coefficient: it is found to be negligible.
The systematic contribution coming from the background rejection of low energy charged particles using the selection has been studied. Exploiting the MC simulation that reproduces the DCH number of hit data distribution, the raw integral has been computed asking for and and no significant variation has been observed.
3 Prompt- monitoring applications
The research and development of particle therapy online monitoring devices relies on the experimental knowledge of the abundance and energy spectrum of secondary radiation produced by the incoming beam interaction with the patient body. As stated in the previous sections, the prompt photon radiation can be used to monitor the beam range inside the target during a PT treatment. The resolution achievable on the measured beam range depends on the production yield of prompt-’s, their emission energy and the technology that is used to detect them.
In order to have an estimate of the resolution achievable on the beam range using the prompt photons produced by the interaction of 4He ,12C and 16O ion beams with a PMMA target, we used the results published in [Smeets2012], where the performances of a slit camera recently developed by the IBA are documented.
The results presented in [Smeets2012] have been obtained studying
the prompt-’s produced by the interactions of a proton beam impinging on a PMMA target.
Figure in [Smeets2012] shows the range estimation standard deviation as a function
of the number of irradiated primary protons as measured by the IBA slit camera.
The use of a result obtained studying the interactions of a proton beam to assess the monitoring performances reachable in PT treatments with 4He ,12C and 16O ion beams is possible, once the number of primary ions that have to be shot in order to deliver a given dose to a selected target volume (depth and dimensions fixed) is known.
Using a dedicated MC simulation it is possible to compute the number of primary ions in all the different configurations of ions (4He ,12C and 16O) and energies of interest. The produced prompt photons in a given slice can hence be computed using the results presented in this manuscript and the detector performances (that are independent of the secondary radiation production source) properly assessed.
Two important implications of the proposed strategy have to be clarified:
-
•
the number of primary ions that has to be shot in a real treatment to any target volume has a strong dependence on the details of the total tumor region under treatment. Beside the obvious dependence on the energy of the beam, for each slice under treatment the number of ions that have to be shot depends on the slice position within the total target volume, in order to account for the dose pile up and, also, of the RBE weight applied to each voxel. The assumptions that have been used to obtain the results presented in this manuscript are outlined below.
-
•
the number of prompt photons that are emitted during the treatment has a dependence also on the material that is present after the BP: a secondary emission can occur, not directly related to the nuclear interactions of the primary beam particles with the target volume. The results obtained in this manuscript are related to the total prompt photons production, not having any experimental mean to disentangle the two different production mechanisms. Hence, the flux used to compute the final number of photons has a direct dependence on the experimental conditions used to obtain the results presented in table 2, as discussed in § 2.2.
The study documented in this manuscript refers to two distinct and well defined treatment configurations, studied using a dedicated FLUKA MC simulation. The first one to be used as a reference (a) while the second one represents a real case scenario as described by [Kramer2000] (b):
-
a)
dose homogeneously distributed in a slice of centered on the Bragg peak position at a depth in PMMA of ;
-
b)
dose delivered to a tumor of , divided in slices.
The conclusions, that are related to the number of prompt photons generated in the well defined scenarios are an indication of the expected number of produced photons in conditions that are, under some assumptions, not far from typical treatment conditions but are not meant to be used as representative of the final performances attainable on generic PT treatments, as those will have to be assessed using dedicated full MC simulations.
In both cases, the number of primary 4He ,12C and 16O ions of a given energy needed to deliver the desired dose has been evaluated and is, in the 12C case, of the same order of magnitude of the number of ions used in real treatments performed at CNAO. The physical dose (1 ) has been chosen as a reference considering that the RBE weighted dose is of the order of RBE- and that in a PT treatment at CNAO, using two laterally-opposed carbon-ion beams, a value of an RBE-weighted dose of RBE- divided in 16 fractions of RBE- each was prescribed to a skull-base chordoma target volume ( RBE- for each beam) [TPSbatti]. We thus used the 1 value as representative of the total RBE weighted dose, averaged against the SOBP region, for a given PT with heavy ions. Such assumption, and the related conclusions, can be translated to different total doses to account for different details of the treatment under study using a dedicated MC simulation. However the conclusions on the feasibility of prompt photons monitoring do not change, as they are related to the order of magnitude of the emitted photons.
The expected prompt photons absolute yields have been estimated
using the results reported in
Table 2, in the angular configuration.
For the a configuration, the number of primaries predicted by the MC simulation and the
relative amount of prompt-’s
produced are reported in Table 3. As previously outlined, [Smeets2012] quoted the standard deviation on the estimated beam range using the prompt photon radiation as a function of the number of primary protons irradiating a PMMA target. Hence, using the measurement of the prompt photon yield emitted by a proton beam reported in [Pinto2015], we computed the number of primary protons needed to produce the prompt- absolute yields listed in the last column of Table 3.
For 4He beam we obtained primary protons, for 12C and 16O beams we obtained protons and, hence, an expected standard deviation on the beam range estimation
that is less than .
| Beam | Number of Primaries | Absolute Yield ( counts/sr) |
|---|---|---|
| 4He MeV/u | ||
| 12C MeV/u | ||
| 16O MeV/u |
These preliminary results can be used as a basis to discuss the prompt photons applications to beam range monitoring in the scenario of a real treatment plan, described in the b configuration. In [Kramer2000] a total number of carbon ions is needed to deliver of absorbed dose to a tumor of divided in slices. As an exercise, assuming that each energy slice is irradiated with 12C ions of , we computed the expected absolute prompt photon yield per slice that is counts/sr. If 4He and 16O ion beams are considered, to deliver the same physical dose of 12C ions a number of 4He and 16O is needed, producing a yield of and counts/sr respectively. The expected resolutions when using a slit camera have been computed for the real case scenario as done before for the a configuration: the number of equivalent primary protons needed to produce the predicted prompt- yields from 4He ,12C and 16O ions has been estimated. The obtained relative expected standard deviation on the beam range estimation has values smaller than for 12C and 16O and smaller than for 4He .
It has to be noticed that physical doses larger than
can be delivered in a typical treatment
fraction, and hence our estimate of the achievable
resolution on the beam range can be considered as conservative.
Furthermore, we would like to
point out that in hypofractionated treatments the relevance of a
possible real–time monitoring will be particularly significant. Our results support
the conclusion that
monitoring techniques exploiting prompt photons are feasible in
particle therapy, providing a resolution on the beam range
matching the clinical requirements.
To evaluate the monitoring performances in real treatment cases, it is necessary to take into account all the patient/treatment specific characteristics, like the tumor volume, its location inside the body and the different tissues that have to be traversed by the beam. A systematic study of the impact on the prompt gamma monitoring performances of the target inhomogeneities will be performed in the future, testing different geometrical configurations and beam energies. Furthermore, a substantial contribution to predictions when considering a real treatment scenario can also be provided from the Monte Carlo simulations, progressively updated with experimental data measurements.
Conclusions
The prompt photon production of 4He , 12C and 16O beams interacting with a beam stopping PMMA target has been studied at the HIT Heidelberg facility with beam energies of interest for PT applications. The production yield measurements performed in this study using 12C ions beam are found to be in agreement with results obtained from other experiments.
The 4He and 16O beams, whose prompt- production is herein measured for the first time, are particularly relevant for future PT applications. The obtained results confirm that a non negligible prompt photons production occurs in the interactions of 4He and 16O beams of therapeutical energy with a PMMA target.
The measured yields have been used to compute the expected resolution on the beam range in a typical treatment scenario, assuming the performances of the IBA slit camera documented in [Smeets2012]. Resolutions below are obtained in all the different scenarios supporting the feasibility of a prompt photons based beam range monitoring approach for PT using 4He , 12C or 16O particle beams.
Acknowledgements
We would like to thank sincerely Marco Magi (SBAI Department) for his valuable effort in the construction of several mechanical supports of the experimental setup. This work has been partly supported by the “Museo storico della Fisica e Centro di studi e ricerche Enrico Fermi”. The access to the test beam at the Heidelberg Ion-beam Therapy center has been granted by the ULICE European program. We are indebted to Prof. Dr. Thomas Haberer and Dr. Stephan Brons for having encouraged this measurement, made possible thanks to their support and to the help of the whole HIT staff.
References
References
- [1] \harvarditemAbou-Haidar et al.2012AbouHaidar Abou-Haidar Z et al. 2012 Performance of upstream interaction region detectors for the first experiment at gsi Journal of Instrumentation 7, P02006.
- [2] \harvarditemAgodi et al.2012aAgodi2012CP Agodi C et al. 2012a Charged particle’s flux measurement from pmma irradiated by 80 mev/u carbon ion beam Physics in Medicine and Biology 57, 5667.
- [3] \harvarditemAgodi et al.2012bAgodi2012PP Agodi C et al. 2012b Precise measurement of prompt photon emission from 80 mev/u carbon ion beam irradiation Journal of Instrumentation 7, 03001.
- [4] \harvarditemAgodi et al.2012cAgodi2012Beta Agodi C et al. 2012c Study of the time and space distribution of beta+ emitters from 80 mev/u carbon ion beam irradiation on pmma Nuclear Instruments and Methods in Physics Research Section B 283, 5667.
- [5] \harvarditemAgodi et al.2013AgodiERRATA Agodi C et al. 2013 Erratum: Precise measurement of prompt photon emission from 80 mev/u carbon ion beam irradiation Journal of Instrumentation 8(11), E11002.
- [6] \harvarditemAttanasi et al.2009Attanasi2009 Attanasi F et al. 2009 Comparison of two dedicated in beam pet systems via simultaneous imaging of -induced -activity Physics in Medicine and Biology 54, 29.
- [7] \harvarditemBattistoni et al.2015Battistoni2015 Battistoni G et al. 2015 Overview of the fluka code Annals of Nuclear Energy 82, 10–18.
- [8] \harvarditemBellini et al.2014Bellini2014 Bellini F et al. 2014 Extended calibration range for prompt photon emission in ion beam irradiation Nuclear Instruments and Methods in Physics Research Section A 745C, 14.
- [9] \harvarditemBoehlen et al.2014Boehlen2014 Boehlen T T et al. 2014 The fluka code: Developments and challenges for high energy and medical applications Nuclear Data Sheets 120, 211–214.
- [10] \harvarditemEnghardt et al.2004Enghardt2004 Enghardt W et al. 2004 Charged hadron tumour therapy monitoring by means of pet Nuclear Instruments and Methods in Physics Research Section A 25, 284.
- [11] \harvarditemFerrari et al.2005Ferrari2005 Ferrari A et al. 2005 Fluka: a multi particle transport code Tech. Rep. CERN-2005-10 INFN/TC05/11.
- [12] \harvarditemFiedler et al.2008Fiedler2008 Fiedler F et al. 2008 In-beam pet measurements of biological half-lives of 12c irradiation induced -activity Acta Oncologica 47, 1077.
- [13] \harvarditemFuchs et al.2014Fuchs Fuchs H et al. 2014 Oc-0393: Can particle beam therapy be improved using helium ions? - a treatment planning study focusing on pediatric patients Radiotherapy and Oncology 111, S154.
- [14] \harvarditemGwosch et al.2013Gwosch2013 Gwosch K et al. 2013 Non-invasive monitoring of therapeutic carbon ion beams in a homogeneous phantom by tracking of secondary ions Physics in Medicine and Biology 58, 3755.
- [15] \harvarditemHenriquet et al.2012Henriquet2012 Henriquet P et al. 2012 Interaction vertex imaging (ivi) for carbon ion therapy monitoring: a feasibility study Physics in Medicine and Biology 54, 4655.
- [16] \harvarditemKraan2015aafke2015 Kraan A 2015 Range verification methods in particle therapy: underlying physics and monte carlo modeling Frontiers in Oncology Article 150.
- [17] \harvarditemKrmer et al.2000Kramer2000 Krmer M et al. 2000 Treatment planning for heavy-ion radiotherapy: physical beam model and dose optimization Physics in Medicine and Biology 45, 3299–3317.
-
[18]
\harvarditemKurz et al.2012Kurz
Kurz C, Mairani A \harvardand Parodi K 2012 First experimental-based
characterization of oxygen ion beam depth dose distributions at the
heidelberg ion-beam therapy center Physics in Medicine and Biology 57(15), 5017.
\harvardurlhttp://stacks.iop.org/0031-9155/57/i=15/a=5017 - [19] \harvarditemLoeffer \harvardand Durante2013Loeffer13 Loeffer J S \harvardand Durante M 2013 Charged particle therapy – optimization, challenges and future directions Nature Reviews Clinical Oncology 10, 411– 424.
- [20] \harvarditemMarafini \harvardand et al.2015Inside Marafini M \harvardand et al. 2015 The inside project: innovative solutions for in-beam dosimetry in hadronteraphy Acta Physica Polonica A 127, 1465.
- [21] \harvarditemMattei et al.2015GsiLYSO220 Mattei I et al. 2015 Prompt- production of 220 mev/u 12 c ions interacting with a pmma target Journal of Instrumentation 10(10), P10034.
- [22] \harvarditemParodi et al.2002Parodi2002 Parodi K et al. 2002 In-beam pet measurements of radioactivity induced by proton beams Physics in Medicine and Biology 47, 21.
-
[23]
\harvarditemParodi et al.2008Paro13
Parodi K et al. 2008 Comparison between in-beam and offline positron emission
tomography imaging of proton and carbon ion therapeutic irradiation at
synchrotron- and cyclotron-based facilities International Journal of
Radiation Oncology Biology Physics 71, 945–956.
\harvardurlhttp://dx.doi.org/10.1016/j.ijrobp.2008.02.033 - [24] \harvarditemParodi et al.2012ParodiHIT Parodi K et al. 2012 Monte carlo simulations to support start-up and treatment planning of scanned proton and carbon ion therapy at a synchrotron-based facility Physics in Medicine and Biology 57(12), 3759.
- [25] \harvarditemPawelke et al.1997Pawelke1997 Pawelke J et al. 1997 In-beam pet imaging for the control of heavy-ion tumour therapy IEEE Trans. Nucl. Sci. 44, 1492.
- [26] \harvarditemPennazio \harvardand et al.2015Inside2 Pennazio F \harvardand et al. 2015 A study of monitoring performances with the inside system Acta Physica Polonica A 127, 1468.
- [27] \harvarditemPiersanti et al.2014Piersanti2014 Piersanti L et al. 2014 Measurement of charged particle yields from pmma irradiated by a 220 mev/u 12c beam Physics in Medicine and Biology 59, 1857.
- [28] \harvarditemPinto et al.2015Pinto2015 Pinto M et al. 2015 Absolute prompt-gamma yield measurements for ion beam therapy monitoring Physics in Medicine and Biology 60, 565–594.
- [29] \harvarditemPriegnitz \harvardand et al.2008Priegnitz2008 Priegnitz M \harvardand et al. 2008 In-beam pet measurement of 7li3+ irradiation induced beta+-activity. Phys. Med. Biol. 53(16), 443.
- [30] \harvarditemRusso et al.2016TPSbatti Russo G et al. 2016 A novel algorithm for the calculation of physical and biological irradiation quantities in scanned ion beam therapy: the beamlet superposition approach Physics in Medicine and Biology 61, 183–214.
- [31] \harvarditemSkwarnicki1986Skwarnicki1986 Skwarnicki T 1986 A study of the radiative CASCADE transitions between the Upsilon-Prime and Upsilon resonances PhD thesis.
- [32] \harvarditemSmeets et al.2012Smeets2012 Smeets J et al. 2012 Prompt gamma imaging with a slit camera for real-time range control in proton therapy Physics in Medicine and Biology 57, 3371.
- [33] \harvarditemTesta et al.2008Testa2008 Testa E et al. 2008 Monitoring the bragg peak location of 73 mev/u carbon ions by means of prompt -ray measurements Applied Physics Letters 93, 093506.
- [34] \harvarditemTesta et al.2009Testa2009 Testa E et al. 2009 Dose profile monitoring with carbon ions by means of prompt-gamma measurements Nuclear Instruments and Methods in Physics Research Section B 267, 993.
- [35] \harvarditemTesta et al.2010Testa2010 Testa M et al. 2010 Real-time monitoring of the bragg-peak position in ion therapy by means of single photon detection Radiation and Environmental Biophysics 49, 337–343.
- [36] \harvarditemTommasino et al.2015TommasinoHeO Tommasino F, Scifoni E \harvardand Durante M 2015 New ions for therapy International Journal of Particle Therapy 2(3), 428–438.
- [37] \harvarditemVanstalle et al.2016GsiBAF Vanstalle M et al. 2016 Measurement of prompt- yields and spectra for hadrontherapy monitoring Submitted for publication in Physics in Medicine and Biology .
- [38] \harvarditemVecchio et al.2009Vecchio2009 Vecchio S et al. 2009 A pet prototype for in-beam monitoring of proton therapy IEEE Trans. Nucl. Sci. 56, 1.
- [39] \harvarditemVerkerke \harvardand Kirkby2003ROOFIT Verkerke W \harvardand Kirkby D 2003 The roofit toolkit for data modeling arXiv:physics/0306116 .
- [40]