MNRAS LaTeX 2ε template – title goes here
LOTUS: A low cost, ultraviolet spectrograph
Abstract
We describe the design, construction and commissioning of LOTUS; a simple, low-cost long-slit spectrograph for the Liverpool Telescope. The design is optimized for near-UV and visible wavelengths and uses all transmitting optics. It exploits the instrument focal plane field curvature to partially correct axial chromatic aberration. A stepped slit provides narrow ( arcsec) and wide ( arcsec) options that are optimized for spectral resolution and flux calibration respectively. On sky testing shows a wavelength range of 3200–6300 Å with a peak system throughput (including detector quantum efficiency) of 15 per cent and wavelength dependant spectral resolution of . By repeated observations of the symbiotic emission line star AG Peg we demonstrate the wavelength stability of the system is Å rms and is limited by the positioning of the object in the slit. The spectrograph is now in routine operation monitoring the activity of comet 67P/Churyumov-Gerasimenko during its current post-perihelion apparition.
keywords:
instrumentation: spectrographs – ultraviolet: general – comets: 67P1 Introduction
In this paper we describe the design, construction and commissioning of a simple spectrograph (LOTUS - LOw-cosT Ultraviolet Spectrograph) that provides sensitivity down to the atmospheric cutoff at Å. The project was particularly inspired by the opportunity to make simultaneous ground based observations with the in-situ measurements provided by the 2015 rendezvous of the Rosetta spacecraft (Glassmeier et al., 2007; Taylor et al., 2015) with comet 67P/Churyumov-Gerasimenko.
Cometary nuclei have been stored at cold temperatures in the outer solar system for most of their lifetime. They become active and release volatile species as they approach the Sun. Several of these species result in strong spectroscopic bands at near-ultraviolet (UV) wavelengths that are inaccessible to many astronomical spectrographs which often have wavelength ranges that extend only down to Å. The LOTUS design therefore particularly targets the NH(0,0) band at Å and the CN band at Å. NH is a granddaughter product of NH3 ice, a molecule with astrobiological significance (Longstaff, 2014). CN gives an excellent overview of the relative level of total activity of comets and can be compared with the total continuum brightness to look at dust-to-gas ratios(A’Hearn et al., 1995). By providing some sensitivity at longer wavelengths (up to 6300 Å) LOTUS also allows observations of the strong C2 and C3 bands and potentially weaker features associated with species such as CO and [Oi].
2 Optical Design

| Comment | Type | Radius | Thickness | Glass | Semidiameter |
|---|---|---|---|---|---|
| Source | Standard | inf | inf | 0.0000 | |
| Primary | Asphere | -12000.0000 | 0.0000 | MIRROR | 1000.0000 |
| Standard | inf | -4315.3850 | 1000.0000 | ||
| Secondary | Asphere | -4813.0000 | 0.0000 | MIRROR | 308.0000 |
| Standard | inf | 5600.0000 | 308.0000 | ||
| Field Lens 250mm | Standard | inf | 2.7100 | F_SILICA | 12.5000 |
| Edmund 48-830 | Standard | -114.6200 | 13.0000 | 12.5000 | |
| Standard | inf | 198.0000 | 12.5000 | ||
| Collimator 200mm | Standard | inf | 2.8800 | F_SILICA | 12.5000 |
| Edmund 48-829 | Standard | -91.6900 | 10.0000 | 12.5000 | |
| 600l/mm (85-292) | Grating | inf | 0.0000 | 12.5000 | |
| 14 degree tilt | Break | inf | 0.0000 | 25.0000 | |
| Standard | inf | 10.0000 | 25.0000 | ||
| Camera 125mm | Standard | 72.9500 | 5.0000 | N-FK5 | 12.5000 |
| Edmund 65-980 | Standard | -64.2100 | 2.5000 | F2 | 12.5000 |
| Standard | -181.9800 | 118.5000 | 12.5000 | ||
| Detector | Standard | inf | 0.0000 | 18.0000 |
 |
LOTUS has been designed for use on the Liverpool Telescope (LT), although the design should be easily adaptable to other telescopes of similar focal ratio. LT (Steele et al., 2004) is a 2.0-m f/10 robotic (i.e. autonomous, unmanned) telescope sited on the Spanish Canary Island of La Palma. The telescope optical design is Ritchey-Chrétien and provides a Cassegrain focal station that can host up to 9 instruments simultaneously. The current instrument suite comprises IO:O (Steele et al., 2014) (an optical imaging camera), IO:I (Barnsley et al., 2014, 2015) (an infrared imaging camera) , FRODOSpec (Morales-Rueda et al., 2004) (a medium resolution optical spectrograph), SPRAT (Piascik et al., 2014) (a low resolution optical spectrograph), RISE (Steele et al., 2008) (a fast readout imaging camera) and RINGO3 (Arnold et al., 2012) (a multi-band imaging polarimeter). Swapping between instruments is accomplished by motion of a retractable and rotating fold mirror. The instrument change time is seconds.
The optical design of LOTUS is based on the requirement to obtain a wavelength range from 3200 Å to at least 6000 Å and a spectral resolution . This corresponds to velocity resolution of km/s. In addition the design had to be sufficiently compact to fit easily on the telescope, implying a length -mm, width -mm and weight -kg.
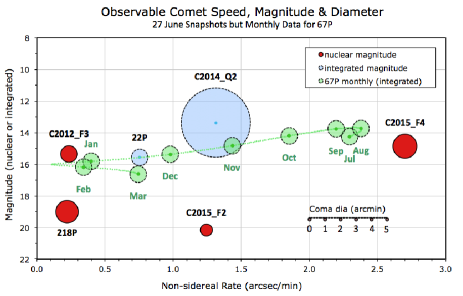
The slit length was determined by our wish to sample both the nucleus and coma of our target comets. In Fig. 1 we present the visual (similar to -band) magnitude, non-sidereal rate and coma size for an example set of comets observable in late June 2015 as well as C67P throughout its observing season. It can be seen that a slit length of 90 arcsec will allow observations of the full coma of the majority of our potential targets and we therefore adopted this as our design requirement.
The slit width was determined by the need to acquire the target reliably in robotic (unattended) operation. We use an automated iterative imaging and world coordinate system (WCS) fitting procedure on our main imaging camera (IO:O) to carry out acquisition. We then deploy the fold mirror to direct the beam to the spectrograph once the target is in the correct focal plane position. Experiments with the same mode of operation on our optical SPRAT spectrograph (Piascik et al., 2014) showed that a projected slit width of 2.5 arcsec was necessary to ensure reliable acquisition.
A 2.5 arcsec slit width on a 2.0-m telescope implies a collimated beam width of 20-mm is necessary to achieve resolution at a wavelength of 4500 Å using a 600 line/mm grating. For the f/10 telescope beam, this implies a collimator focal length of 200-mm. The grating pitch was selected by comparing the efficiency curves of commercially available UV optimized gratings. It was found that 600 line/mm has a sufficient groove density to yield an acceptable resolution combined with reasonable efficiency ( per cent) over the wavelength range of Å and high efficiency ( per cent) at the key wavelength range between 3200 and 4400 Å (Figure 2).


Since we were aiming for a low cost design, we limited our choice of optical elements to those available off the shelf. The UV throughput requirement implies any optical elements used must avoid significant internal absorption or air-glass surface reflections. This ruled out the use of commercial photographic lenses which have unknown prescriptions and coatings. For single element lenses, either fused silica or CaF2 with an anti-reflection coating can be used. However there is a much wider range of focal lengths and diameters available for fused silica and therefore this material was chosen. For achromatic lenses the choice was very limited since the super-flint (SF) glasses typically used within them block light below Å. It was possible however to identify a small range of commercial UV optimized achromats with relatively large diameters (25 and 50-mm) using F2 glass which have reasonable transmission down to Å.
All lenses used in the spectrograph have a proprietary "UV-VIS" anti-reflection multi-coating which reduces reflection losses to per-cent per surface between 3200 and 6400 Å. The total optical throughput (combining reflection and absorption losses) of the lenses and the uncoated fused silica CCD window is also plotted in Figure 2.
The optical design uses simple plano-convex lenses as a collimator and field lens and a UV achromat as a camera lens. A collimator focal length f=200-mm and a camera focal length f=125-mm imply an image magnification factor of 0.625 should be obtained on the detector. This is slightly reduced to 0.587 by the 250-mm plano-convex field lens which is placed just in front of the slit to ensure that rays from the field edge pass through the collimator and grating (Fig 3(a)). The system layout is shown in Figure 3(b). The overall length of the optical path from field lens to focal plane is -mm. Including the 75-mm distance from the telescope mounting flange to the focal plane and -mm length of the detector body, the total instrument length is -mm. The design dispersion is m/Å, giving a spectral length on the detector of -mm. The optical prescription is presented in Table 1.
Ray tracing was carried out on-axis, at the field edge and at three intermediate positions. Fig. 4 highlights an important aspect of the design which partially corrects for axial (focus) chromatic aberration. The natural spectrograph system angle is . This angle would give a layout which places the spectrum symmetrically on either side of the optical axis. However as shown in Fig. 4(b) such a layout suffers from high axial chromatic aberration in the UV. The usual approach in this case is to correct the linear element of the axial chromatic aberration by tilting the detector with respect to the grating. However we found a better correction could be made by tilting both the grating and the detector to give a system angle of . In this configuration (Fig. 4(a)) we keep the grating and detector parallel but shift the centre of the spectrum off the optical axis. The (usually undesirable) second order curvature of the instrument focal plane symmetrical about the optical axis can then be used to achieve a better correction than a grating-only tilt. For both system angles the maximum negative (with respect to the focal plane) defocus occurs at 3200 Å, however it is reduced from -2.7-mm at to -1.5-mm at . The maximum positive defocus is similarly improved from +1.6-mm (at 4700 Å) to +0.9-mm (at 5400 Å).
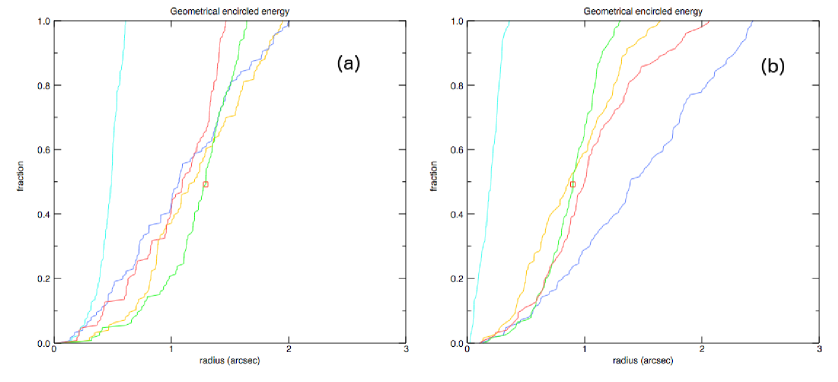
In our design the detector is placed off centre with respect to the optical axis in the dispersion direction only. This means the offset does not significantly increase the effect of the field curvature in the spatial direction. This effect is in any case lower since the maximum extent of the spectral image from the optical axis is only 3.7-mm in the spatial direction, compared with 17-mm in the spectral direction. The lack of effect on the spatial imaging properties of the offset is also demonstrated in the spot diagrams for the two system angles presented in Fig. 5. In our design the 80 per cent geometric encircled energy diameter is arcsec at all wavelengths on-axis, and arcsec off-axis (Fig. 6). Assuming a 2d Gaussian profile this corresponds to spatial full width half maxima (FWHM) of and arcsec respectively, well matched to the slit width of 2.5 arcsec.
In Figure 7 we plot the calculated spectral FHWM as a function of wavelength at various field positions and assuming the input image to the spectrograph has 1.0 arcsec seeing (FWHM). The predicted FWHM varies between 21 Å at 3200 Å and FWHM=8 Å at 4000 Å, corresponding to a variation in spectral resolution from to . Figure 8 shows how the spectral FWHM varies as function of camera lens focus distance. This variation is principally the effect of residual axial chromatic aberration and demonstrates how our optimal focus (-mm) is designed to give the best compromise in terms of absolute FWHM (rather than resolution ) over the entire wavelength range.
3 Detector
Nearly all astronomical spectrographs use CCD detectors that are thinned and back illuminated for best quantum efficiency (QE). Depending on the anti-reflection coating employed, such detectors can have high QE over wide wavelength ranges. However such detectors are expensive and were beyond the project budget. We therefore employed a Starlight-Xpress Trius-SX35 camera designed for the amateur astronomy market. This is based on the use of a Truesense KAI11002M interline CCD (Eastman Kodak, 2006). This detector has pixels of dimensions m. This yields a large image area of -mm. The CCD uses a microlens array to concentrate the light on the active pixel areas. The microlens array and its associated glass cover plate have a multi-layer Kodak proprietary anti-reflection coating. The quoted QE includes these coatings and is plotted in Figure 2. The detector has poor QE in the visible; however its UV sensitivity (25 per cent QE at 3400 Å) exceeds that of typical thinned, back illuminated detectors (15 per cent QE at 3400 Å). It is therefore appropriate in this application. By using binning we derive a spatial scale of arcsec/binned-pixel. This matches well the predicted image quality of 1.5 arcsec. The potential maximum slit length on the detector is arcmin, however vignetting by the field lens limits this to arcmin. In the wavelength direction the design gives a dispersion of 4.7Å per binned pixel. This corresponds to 3.2 pixels per resolution element at the nominal design and implying mild oversampling of the spectrum.
4 Mechanical Design
In order to aid rapid development at low-cost, the lenses and grating were all housed in off-the-shelf T-mount aluminium optical tubes. One tube contains the field lens, slit, collimator lens and grating and the second the camera lens. Each T-mount tube had within it a finely threaded adjustment mechanism to allow collimator and camera focus. The collimator tube was mounted to the aluminium side plate of the spectrograph body and the camera lens screwed to the front of the detector housing via a thread adapter. The collimator lens tube is able to rotate within a locking mounting in order to align the slit with the detector axis. Similarly the grating is able to be locked and rotated independently within the collimator tube to align it. While lacking any precision mechanism, it was found that by making a series of small pseudo-random changes to these rotations during setup it was possible to align both the spatial and spectral directions with the edge of the detector to within one binned pixel. This corresponds to an accuracy of . Finite element analysis of the design predicted flexure of m at the focal plane for a change in gravity vector of 70∘. The direction of flexure (perpendicular to the beam) means that this flexure should not affect wavelength calibration.

To give the option of spectrophotometric calibration (which requires a wide slit) we used spark erosion to cut a “stepped” slit in a thin aluminium disk. This gives a long (95 arcsec) section of 2.5 arcsec projected width and a shorter (25 arcsec) section with a projected width of 5.0 arcsec (Fig. 9). The total slit length is 2 arcmin, within the 2.4 arcmin limit set by the system optics (Section 2). By moving the target in the focal plane, the appropriate slit width can be selected.
5 Commissioning
5.1 Wavelength Calibration and Resolution

The spectrograph was installed on the telescope on 2015 June 29 following realuminzation of the telescope optics. Since no calibration arc lamp unit is provided, immediately prior to installation Xenon (Xe) and Neon (Ne) arc exposures were taken on the bench. The compact PenRay arc lamps were located cm from the field lens, and provided even illumination (Fig. 9). The Xe and Ne exposures were coadded in software. Out of the 23 visible lines, 14 could be unambiguously identified against lines in the NIST atomic spectra database111http://www.nist.gov/. A second order polynomial fit to those lines (which lay between 3370 and 6318 Å) was made. No systematic difference between the Xe and Ne lines was apparent. The measured linear dispersion was 4.7 Å per binned pixel as per expectation and the maximum deviation from linear behaviour is 21 Å at the extremes of the wavelength range. The second order fit residual has rms 1.8 Å. This second order fit is used as the wavelength calibration for all subsequent on-sky data.
In order to confirm the stability of the wavelength calibration, regular observations were made of the symbiotic star AG Peg which has a rich spectrum of optical and UV emission lines (Yoo, 2008). Nineteen observations were taken over the period 2015 Oct 26 to 2016 Jan 11 and the standard wavelength calibration applied (Fig. 10). Cross-correlation of the spectra showed an rms variation in wavelength of 2.1 Å, corresponding to binned CCD pixel. This scatter is naturally explained by the uncertainty of positioning of the target within the 2.5 arcsec (i.e. 4 binned pixel) slit for an individual exposure. We searched for correlations between the wavelength offset and various external parameters (Figure 11). A Spearman rank test showed no evidence of a correlation of offset with date (), telescope altitude (), or temperature (). We conclude that the dominant source of calibration uncertainty appears to be the position of the object within the slit.

To assess the system resolution we used our bench arc spectrum from 2015 June 28 and an on-sky spectrum of AG Peg taken in good conditions (mean seeing 1.1 arcsec in , 1.3 arcsec in ) on the night of 2015 July 01. We measured the full width half maximum (FWHM) by Gaussian fitting of the brightest 22 unblended emission lines between 3700 and 6350 Å in each spectrum. The results are shown in Figure 12. In the data derived from the arc lines no trend is apparent. The mean FWHM of the arc lamp data is 16.3 Å. This appears to be a slight underestimate of the true FWHM for the arc lines due to their flat topped profile. Manual measurement of the lines (to the nearest integer pixel) indicates a mean FWHM of 4 pixels, corresponding to 18.8 Å.
The on sky FWHM show a distinct dependance on wavelength, with best FHWM achieved in the centre of the wavelength range. The mean FWHM over the whole wavelength range is 12.5 Å. At 4500 Å the FWHM is 10.5 Å corresponding to and considerably better than that measured using the arc lines. At 3800 Å the FWHM is 17 Å, similar to that of the arc lines and corresponding to . Also plotted on Figure 12 is the predicted resolution as a function of wavelength from our earlier ray tracing analysis (Section 2) for a camera focus offset of +1.0mm. This makes it clear that the “improved” on-sky resolution at central wavelengths is likely to be due to a combination of the star under-filling the 2.5 arcsec wide slit and an offset of the camera lens focus from the optimum position. This focus offset means that best image quality is obtained at the central wavelength regions and the worst at the wavelength extremes. This demonstrates a weakness of the current design. The combination of a wider (than the seeing disk) slit and lack of on sky focus adjustment means that a focus derived on the bench from arc lamps that fill the slit will not necessarily be optimal. Nevertheless the achieved resolution performance is sufficient for the science goals. The focus will be adjusted at a future date once the current observation programme is completed.

5.2 Throughput
The system throughput was tested by observing the spectrophotometric standard stars GD191B2 (Oke, 1990) and BD+33∘ 2642 (Stone, 1977). The observed spectra were converted from measured ADU counts per wavelength bin to photon counts per second per Angstrom by application of the appropriate scaling factors for exposure time, CCD gain and dispersion. The catalogue spectra were converted to the same units taking into account scaling factors for the variation of photon energy with wavelength, the telescope effective area, the variation of atmospheric extinction with wavelength at the observed airmass (King, 1985), and the telescope optical throughput (Smith, 2016). The ratio of the observed to catalogue spectra then gives the throughput. The results of this analysis are presented in Figure 2.
The peak throughput of the spectrograph (including the CCD camera) is 15 per cent at a wavelength of 4500 Å, compared to the 24 per cent prediction from combining the manufacturers data for the grating, CCD camera. The reason for this discrepancy is unclear however we note that the manufacturer’s figures are not measurements of the supplied items, but merely “representative” and so there may be some sample variation. To discover the true reason would require removal of the spectrograph from the telescope and disassembly for bench testing of the individual components. This would have consequent disruption to the current observing programme. However we may investigate the issue further once the current programme is completed.
We also used our spectrophotometric standard observations to calculate the sensitivity of the instrument expressed in terms of source AB magnitude that yields one detected photon per second per wavelength bin (i.e. 4 binned pixels). The results of this analysis are presented in Figure 13 as an aid to planning observations with the instrument.
5.3 Ghost analysis
No computational scattered light or ghost analysis was carried out during the system design. Empirical bench testing with a bright Neon arc lamp and observations on sky with bright () stars shows a single curved ghost across the image. The ghost has a width of 10 binned pixels. It has flux per image row of per cent of the continuum spectrum. We attribute the ghost to reflection of the zero order light by a curved surface in the spectrograph. In normal use of the spectrograph it is not detectable.

6 Observations
As described in the introduction, LOTUS was developed as a fast track instrument to allow observations of comet 67/P over a range of heliocentric distances in parallel with in-situ measurements from the Rosetta spacecraft. A worldwide campaign of ground-based observations supports this mission, to provide large-scale context and a link to observations of other comets222http://www.rosetta-campaign.net/. Regular spectroscopic monitoring to measure gas production rates is a key element to this campaign, and one particularly suited to robotic telescopes like the LT equipped with LOTUS. This is especially the case during the months after the comet’s perihelion passage in August 2015 when it was visible for only short periods pre-dawn each night. We have therefore observed comet 67P repeatedly with LOTUS since September 2015. We used an ephemeris generated from the JPL Horizons system for non-sidereal tracking. We also made regular observations of flux standards (Section 5.2) and a solar analogue star (HD29641). A detailed analysis of our observations is in preparation which will combine data from other ground based facilities and the in-situ spacecraft measurements. Here we simply present data from one epoch as a proof of concept.
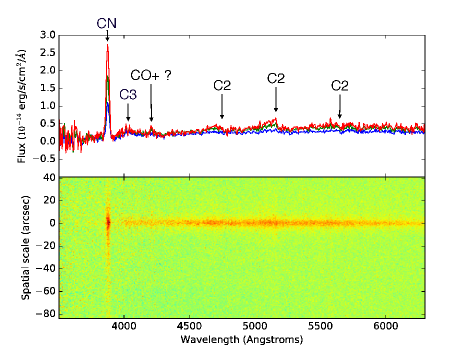
In Figure 14 we present an example spectrum obtained on 2015 September 15. The routine reduction pipeline is very similar to that of other long slit instruments. Bias and dark frame subtraction have been applied and the default wavelength calibration added. Three spectra, each of 300-s exposure time were obtained, plus a single matching offset sky exposure. Measuring a flat, featureless region of continuum between 4650 and 4720 Å in a single spectrum extracted over a 10 pixel (6 arcsec) aperture we found a signal-to-noise ratio (SNR) of 14.4 per binned pixel. The calculated SNR (based on photon counting statistics and using the CCD read-noise of 23 electrons/pixel) is 13.8, in good agreement with the measured value.
The three 300-s comet spectra obtained on the night were combined and extracted by summing the flux over an aperture along the slit and subtracting the background sky frame observed at the same airmass and exposure time directly after the comet observations. The spectra of the comet and the HD29641 solar analog were corrected for atmospheric extinction and flux calibrated using standard IRAF techniques to obtain the spectra as flux versus wavelength. The continuum in the comet spectra (due to reflection of solar radiation off the dust in the coma) was removed using the spectrum of the solar analogue.
Apparent in both the 1d and 2d spectra are strong CN emission at 3880 Å as well as features attributable to the C2 ( Å) bandheads. The spatial extent of these features compared with the continuum emission is also clear. Also present (although weak) are C3 ( Å) and a feature at 4200 Å which could potentially be attributable to CO. We fitted a Gaussian function to measure the intensity of the CN line. For an aperture with a diameter of 168 a line flux of was measured. Based on comparing the flux from the comet in the IO:O acquisition images with integrated spectra from the LOTUS instrument we concluded that there were no significant flux losses when we use the 2.5 arcsec slit.
To convert the measured fluxes from the comet emission bands into production rates we used a simple Haser spherically symmetric model (Haser, 1957). This model takes into account the release of parent molecules flowing outwards from the nucleus and photo-production and dissociation of daughter molecules with a characteristic scale-length. Despite of its simplicity the Haser model is widely used to derive production rates of parent and daughter species, and is useful to compare with the results from other observations.
Due to the faintness of the emission features in comet 67P we only consider the CN emission in the analysis presented here. We adopted the CN scale-lengths and fluorescence efficiencies from Schleicher (2010). Using this model the column density for each of the extracted spectra is proportional to the measured flux of the emission band assuming that the comet is perfectly centred on the slit. A column density of is derived. The CN production rate was fitted simultaneously to the column densities obtained at three different apertures along the slit using a linear least-squares method. By fitting the column densities at these positions in the coma up to a distance from the nucleus of km we find a CN production rate of molecules/s. A comparison with similar measurements in 67P obtained with other instruments will be presented in a forthcoming paper. This method has proven to be less sensitive to model assumptions than using the line fluxes measured with small apertures. Thus the derived value of the CN production rate corresponds to an approximate average value over the molecules contained in the slit apertures which were released on time scales that spanned several hours assuming a typical outflow radial velocity scaling of km/s where represents the heliocentric distance.
7 Conclusions
We have described the design and commissioning of a simple, long-slit optical-UV spectrograph for the Liverpool Telescope. The design uses off the shelf optics in an all transmitting configuration and an “amateur” market CCD camera. The instrument meets its design specification with a wavelength range of 3200–6300 Å and a wavelength dependent spectral resolution . The wavelength calibration is stable to Å rms and the combined instrument and detector peak throughput is 15 per cent. The instrument was designed, built and commissioned in 6 months at a total cost of £10,000. The design is sufficiently simple that is should be straightforward to adopt to other telescopes at similar low cost. LOTUS is now in routine use monitoring the CN production rate in comet 67P.
Acknowledgements
The Liverpool Telescope is operated on the island of La Palma by Liverpool John Moores University in the Spanish Observatorio del Roque de los Muchachos of the Instituto de Astrofísica de Canarias with financial support from the UK Science and Technology Facilities Council. Ray tracing was carried out using LensForge by Ripplon Software Inc.
References
- A’Hearn et al. (1995) A’Hearn M. F., Millis R. C., Schleicher D. O., Osip D. J., Birch P. V., 1995, Icar, 118, 223
- Arnold et al. (2012) Arnold D. M., Steele I. A., Bates S. D., Mottram C. J., Smith R. J., 2012, SPIE, 8446, 84462J
- Barnsley et al. (2014) Barnsley R. M., Steele I. A., Bates S. D., Mottram C. J., 2014, SPIE, 9147, 914737
- Barnsley et al. (2015) Barnsley R., Jermak H., Steele I., Smith R., Bates S., Mottram C., 2015, JATIS, 2(1), 015002
- Eastman Kodak (2006) Eastman Kodak, 2006, KAI-11002 Image Sensor Device Performance Specification, MTD/PS-0938 Rev 1.0
- Glassmeier et al. (2007) Glassmeier K.-H., Boehnhardt H., Koschny D., Kührt E., Richter I., 2007, SSRv, 128, 1
- Haser (1957) Haser L., 1957, BSRSL, 43, 740
- King (1985) King, D. L., 1985, RGO/La Palma Technical Note 31
- Longstaff (2014) Longstaff A, 2014, Astrobiology: An Introduction, CRC Press
- Morales-Rueda et al. (2004) Morales-Rueda L., Carter D., Steele I. A., Charles P. A., Worswick S., 2004, AN, 325, 215
- Oke (1990) Oke J. B., 1990, AJ, 99, 1621
- Piascik et al. (2014) Piascik A. S., Steele I. A., Bates S. D., Mottram C. J., Smith R. J., Barnsley R. M., Bolton B., 2014, SPIE, 9147, 91478H
- Schleicher (2010) Schleicher D. G., 2010, AJ, 140, 973
- Smith (2016) Smith R. J., 2016, LT Technical Note 1, Liverpool John Moores University
- Steele et al. (2004) Steele I. A., et al., 2004, SPIE, 5489, 679
- Steele et al. (2008) Steele I. A., Bates S. D., Gibson N., Keenan F., Meaburn J., Mottram C. J., Pollacco D., Todd I., 2008, SPIE, 7014, 70146J
- Steele et al. (2014) Steele I. A., Mottram C. J., Smith R. J., Barnsley R. M., 2014, SPIE, 9154, 915428
- Stone (1977) Stone R. P. S., 1977, ApJ, 218, 767
- Taylor et al. (2015) Taylor M. G. G. T., Alexander C., Altobelli N., Fulle M., Fulchignoni M., Grün E., Weissman P., 2015, Sci, 347, 387
- Yoo (2008) Yoo, K.H.., 2008, New Astron., 13, 646