Thermoelectric properties of -type SrTiO
Abstract
We present an investigation of the thermoelectric properties of cubic perovskite SrTiO. The results are derived from a combination of calculated transport functions obtained from Boltzmann transport theory in the constant scattering time approximation based on on the electronic structure and existing experimental data for La-doped SrTiO. The figure of merit is modeled with respect to carrier concentration and temperature. The model predicts a relatively high at optimized doping, and suggests that the value can reach 0.7 at = 1400 K. Thus can be improved from the current experimental values by carrier concentration optimization.
I INTRODUCTION
Themoelectric (TE) energy conversion has been widely recognized as a promising technology in power generation including waste heat recovery Wood (1988); Yang and Caillat (2006); Snyder and Toberer (2008). However the applications are limited due to the low efficiency. This is associated with the dimensionless figure of merit , where is the electrical conductivity, is the Seebeck coefficient, is the temperature and is the thermal conductivity. Oxides may offer advantages in applications. Matsubara et al. (2001); Tsubota et al. (1997); He et al. (2011); Saucke et al. (2015) However, while there are a number of thermoelectric materials with 1 Yamashita et al. (2003); Shi et al. (2011); Nolas et al. (2000), progress in oxide thermoelectrics has been slower.
Oxide thermoelectrics with high value approaching 1 mainly fall in -type Co oxides and related alloys Terasaki et al. (1997); Koumoto et al. (2006); Fujita et al. (2001); Shikano and Funahashi (2003). -type oxide thermoelectrics with high performance are rare and with value barely exceeding 0.5. The best -type to date is found in ZnO ceramics at high temperatures Ong et al. (2011); Ohtaki et al. (2009); Jood et al. (2011, 2014). Among the several -type oxides, SrTiO (STO) with cubic perovskite structure has attracted growing attention for TE power generation at high temperatures due to its large Seebeck coefficient originated from the degenerate Ti 3-t band at the conduction band minimum and high power factor (PF) comparable to that of Bi-Te alloy Okuda et al. (2001). However the value achieved is still quite low ( 0.5) even at 1000 K. This is mainly attributed to its high thermal conductivity (6-12 Wm-1K-1 for undoped STO Muta et al. (2005)). Optimizing the doping level and elements as well as introducing point defects are effective methods to reduce the thermal conductivity. For instance the La- and Nb-doped STO can have as low as 3 Wm-1K-1 at about 1000 K depending on the doping concentrations Ohta et al. (2005). Lower thermal conductivity down to 2.3 Wm-1K-1 at 1073 K can be achieved through double doping with La and Dy on the Sr (A) site Wang et al. (2011a). The at corresponding temperature is reported to be 0.36 which is a relatively high value in doped STO. A-site vacancies also can lower . Particularly, Popuri . has shown a glass-like thermal conductivity through A-site vacancies and = 2.5 Wm-1K-1 can be realized at 1000 K Popuri et al. (2014). Recently, Lu and co-workers find high about 0.4 at 973 K with similar low = 2.5 Wm-1K-1 from their La-doped and A-site-deficient samples Lu et al. (2016). Importantly, STO has been identified as a material with a corrugated band structure of a form that is particularly beneficial for the electronic part of , but which at the same time is not reasonably described by standard parabolic band models. This makes detailed calculations particularly important.
Here we report on the thermoelectric properties of cubic STO from a combination of first-principles calculations and analysis of existing experimental data. High temperature up to 1400 K was investigated because the thermoelectric performance typically increases with temperature for wide band gap materials. Furthermore, the melting point of STO is high (2080 ∘C) and -type STO is expected to be applicable at high temperatures. We find that the optimized -type can reach a peak value of 0.7 at 1400 K with reasonable high doping concentrations.
II Computational methods
The model for -type STO was constructed along the lines of the prior model for PbSe Parker and Singh (2010). Specifically, the transport functions and coefficients are obtained using a relaxation time approximation to Boltzmann transport theory Ziman (1972) based on first-principles electronic structure. We use the constant scattering time approximation (CSTA) also known as the constant relaxation time approximation, as implemented in the BoltzTraP code Madsen and Singh (2006). The CSTA consists in taking the energy dependence of the band structure as the main ingredient in the energy dependence of the conductivity in the transport formula. Madsen and Singh (2006); Zhang and Singh (2009) With this approximation the scattering time cancels in the expression for the thermopower, so that one can obtain the thermopower as a function of temperature and doping level from the band structure without any additional input.
We emphasize that while the CSTA neglects the energy dependence of the scattering rate on energy scales of , as compared to the energy dependence of the electronic structure, it does not involve any assumption about the temperature or doping level dependence of the scattering. Furthermore, the CSTA has been used to successfully describe the Seebeck coefficients and their temperature and doping dependencies in a wide variety of thermoelectric materials. This includes both conventional thermoelectrics Parker and Singh (2010); Madsen and Singh (2006); Yang et al. (2008); Parker and Singh (2011); Fei et al. (2014); Bjerg et al. (2011), and even materials where unusual scattering may be expected such as the oxide NaCoO, Singh and Kasinathan (2007) and PdCoO, Ong et al. (2010) which was recently shown to display hydrodynamic electron transport. Moll et al. (2016) We note that it has been shown to yield results in accord with experiment for SrTiO, Kinaci et al. (2010) which is the subject of the present study. In addition the CSTA has proven useful as a basis for performing high throughput searches for new thermoelectrics. Madsen (2006); Wang et al. (2011b); Curtarolo et al. (2013) Going beyond the CSTA would require detailed knowledge of the energy dependent scattering mechanisms including different sources of scattering in combination. For example, if one includes only acoustic phonon scattering with proportional to the density of states, one obtains the result that the mobility diverges and the conductivity is flat as the carrier concentration is lowered to zero. The behavior can be understood from the low behavior, specifically the density of states is given by , which for a power law dependence of on yields . , where is the mobility. For a parabolic band , , , while density of states goes as , i.e. so that has a sublinear dependence on , with a divergent mobility, . At finite , the flatness of is enhanced by the Fermi broadening and the divergence of becomes stronger.
This unphysical result comes from ignoring point defect, polar optical phonon and other scattering. It is the case for a parabolic band model and we verified by direct calculation at 300 K that it is also so for the band structure of SrTiO. Defect scattering, will in general limit the mobility and prevent such divergences of the mobility. SrTiO has a large dielectric constant due high Born charges leading to nearness to ferroelectricity. This provides a mechanism for screening of ionized impurity and other defect scattering. Du and Singh (2010) In SrTiO the dielectric constant and therefore this source of screening is a strong function of temperature. The polar nature of the compound and the high Born charges lead to the expectation of strong polar optical phonon scattering. Himmetoglu and co-workers find that at room temperature with moderate carrier concentration this scattering mechanism dominates the mobility and that it has a strong and complex momentum dependence, Himmetoglu et al. (2014) and a complex energy dependence may also be expected in analogy with other materials. Komirenko et al. (2000) Furthermore, one expects acoustic phonon scattering, discussed above, to contribute to scattering in any material, and electron-electron scattering may also contribute for heavy doping and low temperature.
It is possible to fit various energy, doping and temperature dependent scattering terms to experiment for semiconductors for which large amounts of doping and temperature dependent data is available. An example is provided by the detailed fits performed for the Pb chalcogenide IV-VI semiconductor thermoelectrics, which reproduced extremely well the known body of experimental data. Ravich et al. (1971a, b); Ravich (1970) These models may, however, have limited predictive ability outside the range of known data due to the large number of fitting parameters used. For example, they lead to the expectation that the for PbTe could not exceed unity and that PbSe would invariably be inferior to PbTe. In contrast, calculations based on the CSTA, similar to the approach followed here, did predict that ordinarily (Na and/or K) but heavily doped p-type PbTe and PbSe would both have high above unity, Parker and Singh (2010); Singh (2010a) as was subsequently shown to be the case. Pei et al. (2011) Therefore we use the CSTA, which while approximate, allows one to predict the thermopower directly from the first principles electronic structure, with no adjustable parameters.
In the present work, we use results calculated from the electronic structure using the CSTA and combine these models derived by fitting experimental data for the temperature and doping concentration dependent relaxation time and lattice thermal conductivity, , to obtain the conductivity and thermal conductivity. Eventually we are able to get the figure of merit in terms of and .
The band structure calculations were performed with the linearized augmented plane wave (LAPW) method Singh and Nordstrom (2006), as implemented in the WIEN2K code Schwarz et al. (2002). We used LAPW sphere radii of 2.5 bohr for Sr, 1.9 bohr for Ti and 1.75 bohr for O. A k-point mesh of 666 was used for total energy calculations and much denser k meshes are used for density of states (171717), isoenergy surfaces and transport properties (272727). We adopted the experimental cubic structure with lattice constant a = 3.906 Å Cao et al. (2000), with the modified Becke-Johnson (mBJ) potential of Tran and Blaha Tran and Blaha (2009). This potential generally gives improved band gaps for simple semiconductors and insulators Parker and Singh (2010); Tran and Blaha (2009); Singh (2010b). Spin-orbit coupling (SOC) was included in all the calculations.
III RESULTS AND DISCUSSION
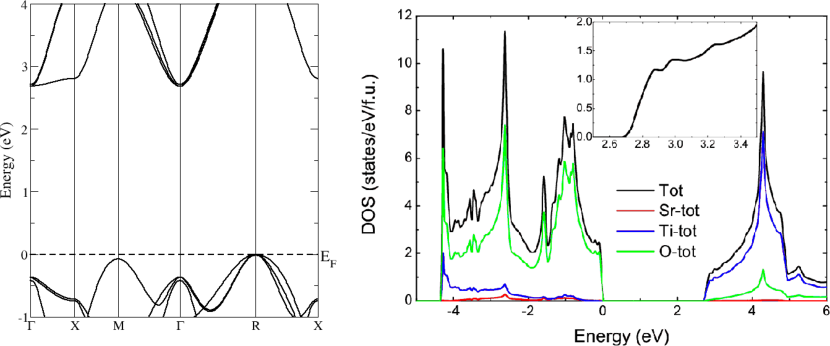
SrTiO is a band insulator with a band gap value of 3.2 eV. Cardona (1965) Our calculated band structure agrees with this quite well as shown in Fig. 1. The calculated band gap is about 2.68 eV (R-) with SOC using mBJ potential. At the point near the conduction band minimum (CBM), the lowest three bands are largely from Ti 3-t states and the degeneracy is lifted by SOC effects with a split-off energy of about 30 meV. This agrees reasonably with other theoretical calculations (25-28 meV Mattheiss (1972); Baniecki et al. (2013)) and experiment (17 meV Uwe et al. (1985)) by interband Raman scattering. The electronic density of states (DOS) is presented in the right panel of Fig. 1, where the inset shows the details at the CBM. As known, the valence band is mainly derived from oxygen 2 states and the conduction band is dominated by Ti 3 states especially near CBM. In fact the high in STO is mainly due to the large DOS effective mass Frederikse et al. (1964); Ohta et al. (2008).
Within a simple parabolic band model, the is proportional to effective mass () and decreases as the 2/3 power of doping concentration. Moreover, plays different roles in and . For thermoelectric performance it is important to have both high and high , which as discussed previously Xing et al. (2016) have opposite dependences on both carrier concentration and effective mass. This conundrum can be resolved by certain complex band structures that exploit the different transport integrals that enter and Kuroki and Arita (2007); Chen et al. (2013); Usui et al. (2013, 2010); Shirai and Yamanaka (2013); Parker et al. (2013); Mecholsky et al. (2014). STO has a particular band shape arising from the degeneracy of the levels in an octahedral crystal field that gives effectively lower dimensional behaviour in transport even though the material is cubic, analogous to the case of PbTe Parker et al. (2013). The sharp onset of the DOS at the CBM reflects the low-dimensional nature of the electronic structure.
The temperature and doping concentration dependent Seebeck coefficient, , can be obtained directly from the electronic structure with no adjustable parameters within CSTA. From the Wiedemann-Franz relation one can rewrite as where and WK2 is the standard Lorenz number. If is neglected assuming the upper bound of which can reach unity when = 156 V/K. In reality good TE materials usually have larger than 200 V/K. We illustrate the calculated of -type STO at different temperatures in Fig. 2 (a). As seen, high Seebeck coefficients ( 200 V/K ) are obtained even at quite low temperatures (200 K) with doping concentration up to 1020 cm-3. At high temperatures ( 1000 K), exceeds 200 V/K at high doping concentrations ( 1021 cm-3). Importantly, due to the substantial band gap, there is no bipolar effect and therefore keeps increasing with to high temperatures even at low doping concentrations.
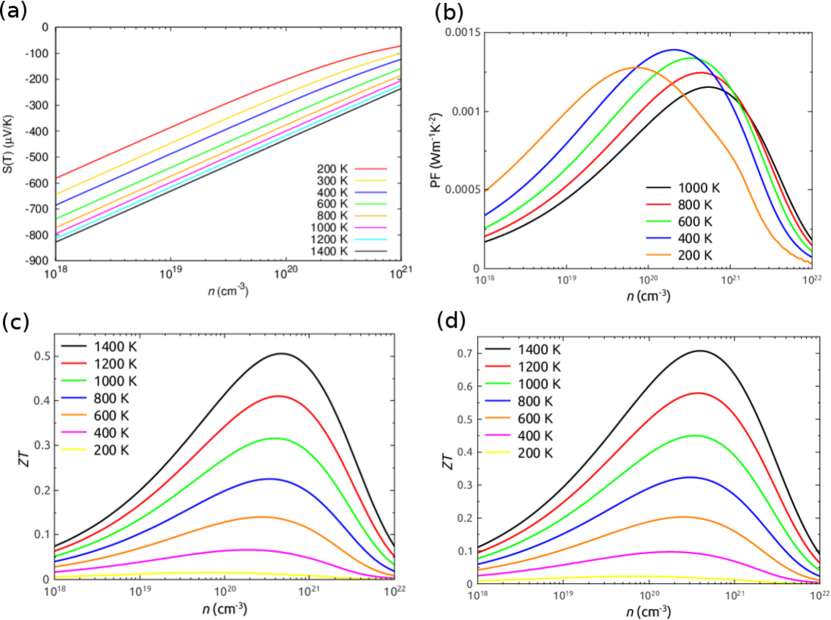
Within the framework of CSTA, one can obtain directly from the electronic structure as a function of and . However, it is not possible to get without the knowledge of the scattering rate . Therefore, in order to proceed, we used the strategy of our recent work on Mg(Ge,Sn) Sun and Singh (2016) and a prior model on PbSe where the experimental data was used to fit the relaxation time . For this purpose, the extrapolation of the experimental data was based on the recent work of La-doped STO films grown by hybrid molecular beam epitaxy, conducted by Cain and co-workers Cain et al. (2013). Their samples have relatively higher electrical conductivities at the same conditions ( and ) compared to other studies, which may indicate the higher quality of the STO films. Specifically, we used the data set which has the highest and choose the experimental at corresponding with a value of about -270 V/K at 300 K. The reason is that we want to estimate the optimum , and the choice of the best samples as the baseline minimizes the effects on the predicted due to extrinsic effects that are presumably controllable. By comparing with our calculated (Fig. 2 (a)), we obtain the carrier concentration cm-3. This calculated is smaller than the reported one (2 cm-3). We are using the experimental rather than the the nominal carrier concentration because of the potential neglect of compensating defects as well as the fact that the carrier concentration is not the same as in the Hall measurements for a non-parabolic case. At this temperature and doping concentration, combing with the calculated and experimental ( 18500 m-1)Cain et al. (2013) yields = 7.210-15 s. In this regime, we considered an approximate electron-phonon dependence of where is proportional to and decreases with carrier concentration as . Therefore these together with fitted yield = 9.45 with in s, in K and in cm-3. Thus can be calculated through . The corresponding PF () obtained from the calculated and as mentioned above is presented in Fig. 2 (b). The maximum PF is about 1.410-3 Wm-1K-2 at 400 K, which is smaller than the heavily La doped STO (3.610-3 Wm-1K-2) at room temperature Okuda et al. (2001). Moreover, the position of the peak in the PF as a function of carrier concentration shifts to higher doping levels with increasing . This means that optimization of the carrier concentration for high temperature will lead to higher doping levels than are optimum at lower . Thermal conductivity is also required to assess . As mentioned, is composed of both the lattice and electronic contributions. The electronic part can be directly calculated using the Wiedemann-Franz relation from . The lattice thermal conductivity usually behaves as until high temperatures, as also observed in the experiments Ohta et al. (2005). Hence we estimate as with constant A determined by fitting the experimental data of . There have been a number of studies of the thermal conductivity measurements on both the bulk and doped STO at elevated temperatures Muta et al. (2005); Ohta et al. (2005); Wang et al. (2011a); Popuri et al. (2014); Lu et al. (2016); Yu et al. (2008); Wang et al. (2013); Oh et al. (2011); Muta et al. (2003). Due to the significant difference of between bulk and heavily doped materials, we consider two scenarios with one taking the bulk at 300 K ( 11 Wm-1K-1)Ohta et al. (2005); Oh et al. (2011) and the other using the doped at the same ( 8 Wm-1K-1, based on moderately doped samples Ohta et al. (2005); Lu et al. (2016)). With the second scenario, we are able to get low from 2.3 - 2.5 Wm-1K-1 at 1000 K. These values are in better accord with experiments at high temperatures ( 1000 K).
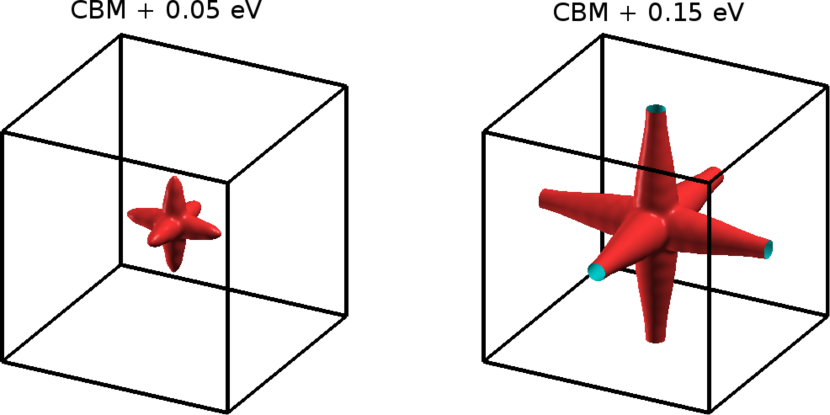
Finally, we obtain the as a function of temperature and doping concentration. The results are shown in Figs. 2 (c) and (d) with (c) depicting the data from model with bulk . Although it has a number of assumptions, the model can be used to describe the behaviour of with respect to and . As seen, strongly depends on and increases up to the highest . This is mainly due to the substantial band gap so that the Seebeck coefficient keeps increasing to high . The lattice thermal conductivity decreases at high but the electronic part has weaker dependence. The maximum with bulk (Fig. 2 (c)) is about 0.5 at 1400 K and 0.3 at 1000 K with high doping concentration range (4-5 cm-3). By using smaller , about 40% higher can be obtained, as shown in Fig. 2 (d), with a peak value up to 0.7 at 1400 K and 0.45 at 1000 K with similar doping level (3-4 cm-3). Though a little higher in the latter case, our calculated with both experimental range agree reasonably well with existing experiments (0.2-0.4 at 900 K - 1000 K Ohta et al. (2005); Wang et al. (2011a); Popuri et al. (2014); Lu et al. (2016); Wang et al. (2013)). Complex isoenergy surfaces are favorable for electronic performance as mentioned above. Therefore we studied the isoenergy surfaces of cubic STO especially at the peak values, for instance at 1400 K and 600 K with doping concentration of 5 cm-3 and 3 cm-3 as shown in Fig. 2 (c). However we found the Fermi energy is about 0.12 eV (for 1400 K) below and 0.002 eV (600 K) above CBM at corresponding carrier concentrations due to the heavy onset feature at the CBM. Thus we present the isoenergy surfaces at 0.05 eV and 0.15 eV above CBM. As seen in Fig. 3, the surfaces show complex shapes due to the three lowest orbitals. Specifically, the surfaces in the 0.15 eV case consist of intersecting cylinders joined at the center around and two small sections inside the center, as was discussed previously for STO and other cubic perovskites Xing et al. (2016). This low-dimensional-like intersecting cylinders in higher carrier concentration (right panel of Fig. 3) that originated from the orbitals is beneficial for achieving high . Thus high doping concentration will be advantageous in achieving high thermoelectric performance for cubic STO.
IV SUMMARY AND CONCLUSIONS
In summary, we have investigated the electronic and thermoelectric properties of SrTiO. Using the combination of constant scattering time approximation Boltzmann theory based on first-principles electronic structure and existing experiments, we have predicted the thermoelectric performance of STO, including the Figure of merit, . Importantly, we find high value of 0.7 at high temperature (1400 K). This confirms the potential of high temperature thermoelectric properties of STO. We find can be further improved relative to currently reported experimental values via carrier concentration optimization.
Acknowledgements.
We are grateful for helpful discussions with Susanne Stemmer. This work was supported by the Department of Energy through the S3TEC Energy Frontier Research Center award # DE-SC0001299/DE-FG02-09ER46577.References
- Wood (1988) C. Wood, Rep. Prog. Phys. 51, 459 (1988).
- Yang and Caillat (2006) J. Yang and T. Caillat, MRS Bull. 31, 224 (2006).
- Snyder and Toberer (2008) G. J. Snyder and E. S. Toberer, Nat. Mater. 7, 105 (2008).
- Matsubara et al. (2001) I. Matsubara, R. Funahashi, T. Takeuchi, S. Sodeoka, T. Shimizu, and K. Ueno, Appl. Phys. Lett. 78, 3627 (2001).
- Tsubota et al. (1997) T. Tsubota, M. Ohtaki, K. Eguchi, and H. Arai, J. Mater. Chem. 7, 85 (1997).
- He et al. (2011) J. He, Y. Liu, and R. Funahashi, J. Mater. Res. 26, 1762 (2011).
- Saucke et al. (2015) G. Saucke, S. Populoh, P. Thiel, W. J. Xie, R. Funahashi, and A. Weidenkaff, J. Appl. Phys. 118, 035106 (2015).
- Yamashita et al. (2003) O. Yamashita, S. Tomiyoshi, and K. Makita, J. Appl. Phys. 93, 368 (2003).
- Shi et al. (2011) X. Shi, J. Yang, J. R. Salvador, M. Chi, J. Y. Cho, H. Wang, S. Bai, J. Yang, W. Zhang, and L. Chen, J. Am. Chem. Soc. 133, 7837 (2011).
- Nolas et al. (2000) G. S. Nolas, M. Kaeser, R. T. Littleton, and T. M. Tritt, Appl. Phys. Lett. 77, 1855 (2000).
- Terasaki et al. (1997) I. Terasaki, Y. Sasago, and K. Uchinokura, Phys. Rev. B 56, R12685 (1997).
- Koumoto et al. (2006) K. Koumoto, I. Terasaki, and R. Funahashi, MRS Bulletin 31, 206 (2006).
- Fujita et al. (2001) K. Fujita, T. Mochida, and K. Nakamura, in Thermoelectrics, 2001. Proceedings ICT 2001. XX International Conference on (2001), pp. 168–171.
- Shikano and Funahashi (2003) M. Shikano and R. Funahashi, Appl. Phys. Lett. 82, 1851 (2003).
- Ong et al. (2011) K. P. Ong, D. J. Singh, and P. Wu, Phys. Rev. B 83, 115110 (2011).
- Ohtaki et al. (2009) M. Ohtaki, K. Araki, and K. Yamamoto, J. Electron. Mater. 38, 1234 (2009).
- Jood et al. (2011) P. Jood, R. J. Mehta, Y. Zhang, G. Peleckis, X. Wang, R. W. Siegel, T. Borca-Tasciuc, S. X. Dou, and G. Ramanath, Nano Lett. 11, 4337 (2011).
- Jood et al. (2014) P. Jood, R. J. Mehta, Y. Zhang, T. Borca-Tasciuc, S. X. Dou, D. J. Singh, and G. Ramanath, RSC Adv. 4, 6363 (2014).
- Okuda et al. (2001) T. Okuda, K. Nakanishi, S. Miyasaka, and Y. Tokura, Phys. Rev. B 63, 113104 (2001).
- Muta et al. (2005) H. Muta, K. Kurosaki, and S. Yamanaka, J. Alloys Compd 392, 306 (2005).
- Ohta et al. (2005) S. Ohta, T. Nomura, H. Ohta, and K. Koumoto, J. Appl. Phys. 97, 034106 (2005).
- Wang et al. (2011a) H. C. Wang, C. L. Wang, W. B. Su, J. Liu, Y. Sun, H. Peng, and L. M. Mei, J. Am. Ceram. Soc. 94, 838 (2011a).
- Popuri et al. (2014) S. R. Popuri, A. J. M. Scott, R. A. Downie, M. A. Hall, E. Suard, R. Decourt, M. Pollet, and J.-W. G. Bos, RSC Adv. 4, 33720 (2014).
- Lu et al. (2016) Z. Lu, H. Zhang, W. Lei, D. C. Sinclair, and I. M. Reaney, Chem. Mater. 28, 925 (2016).
- Parker and Singh (2010) D. Parker and D. J. Singh, Phys. Rev. B 82, 035204 (2010).
- Ziman (1972) J. M. Ziman, Principles of the Theory of Solids, 2nd Edition (Cambridge University Press, Cambridge, 1972).
- Madsen and Singh (2006) G. Madsen and D. J. Singh, Computer Phys. Commun. 175, 67 (2006).
- Zhang and Singh (2009) L. Zhang and D. J. Singh, Phys. Rev. B 80, 075117 (2009).
- Yang et al. (2008) J. Yang, H. M. Li, T. Wu, W. Q. Zhang, L. D. Chen, and J. H. Yang, Adv. Funct. Mater. 18, 2880 (2008).
- Parker and Singh (2011) D. Parker and D. J. Singh, Phys. Rev. X 1, 021005 (2011).
- Fei et al. (2014) R. Fei, A. Faghaninia, R. Soklaski, J. A. Yan, C. Lo, and L. Yang, Nano Lett. 14, 6393 (2014).
- Bjerg et al. (2011) L. Bjerg, G. K. H. Madsen, and B. B. Iversen, Chem. Mater. 23, 3907 (2011).
- Singh and Kasinathan (2007) D. J. Singh and D. Kasinathan, J. Electron. Mater. 36, 736 (2007).
- Ong et al. (2010) K. P. Ong, D. J. Singh, and P. Wu, Phys. Rev. Lett. 104, 176601 (2010).
- Moll et al. (2016) P. J. W. Moll, P. Kushwaha, N. Nandi, B. Schmidt, and A. P. Mackenzie, Science 351, 1061 (2016).
- Kinaci et al. (2010) A. Kinaci, C. Cevik, and T. Cagin, Phys. Rev. B 82, 155114 (2010).
- Madsen (2006) G. K. H. Madsen, J. Am. Chem. Soc. 128, 12140 (2006).
- Wang et al. (2011b) S. Wang, Z. Wang, W. Setyawan, N. Mingo, and S. Curtarolo, Phys. Rev. X 1, 021012 (2011b).
- Curtarolo et al. (2013) S. Curtarolo, G. L. W. Hart, M. B. Nardelli, N. Mingo, S. Sanvito, and O. Levy, Nature Materials 12, 191 (2013).
- Du and Singh (2010) M. H. Du and D. J. Singh, Phys. Rev. B 81, 144114 (2010).
- Himmetoglu et al. (2014) B. Himmetoglu, A. Janotti, H. Peelaers, A. Alkauskas, and C. G. Van de Walle, Phys. Rev. B 90, 241204 (2014).
- Komirenko et al. (2000) S. M. Komirenko, K. W. Kim, M. A. Stroscio, and M. Dutta, Phys. Rev. B 61, 2034 (2000).
- Ravich et al. (1971a) Y. I. Ravich, B. A. Efimova, and V. I. Tamarchenko, Phys. Status Solidi B 43, 11 (1971a).
- Ravich et al. (1971b) Y. I. Ravich, B. A. Efimova, and V. I. Tamarchenko, Phys. Status Solidi B 43, 453 (1971b).
- Ravich (1970) Y. I. Ravich, Semiconducting Lead Chalcogenides (Springer, Berlin, 1970).
- Singh (2010a) D. J. Singh, Phys. Rev. B 81, 195217 (2010a).
- Pei et al. (2011) Y. Pei, A. LaLonde, S. Iwanaga, and G. J. Snyder, Energy Environ. Sci. 4, 2085 (2011).
- Singh and Nordstrom (2006) D. J. Singh and L. Nordstrom, Planewaves, Pseudopotentials and the LAPW Method, 2nd Edition (Springer, Berlin, 2006).
- Schwarz et al. (2002) K. Schwarz, P. Blaha, and G. Madsen, Computer Phys. Commun. 147, 71 (2002).
- Cao et al. (2000) L. Cao, E. Sozontov, and J. Zegenhagen, physica status solidi (a) 181, 387 (2000).
- Tran and Blaha (2009) F. Tran and P. Blaha, Phys. Rev. Lett. 102 (2009).
- Singh (2010b) D. J. Singh, Phys. Rev. B 82, 205102 (2010b).
- Cardona (1965) M. Cardona, Phys. Rev. 140, 651 (1965).
- Mattheiss (1972) L. F. Mattheiss, Phys. Rev. B 6, 4718 (1972).
- Baniecki et al. (2013) J. D. Baniecki, M. Ishii, H. Aso, K. Kurihara, and D. Ricinschi, J. Appl. Phys. 113, 013701 (2013).
- Uwe et al. (1985) H. Uwe, T. Sakudo, and H. Yamaguchi, Jpn. J. Appl. Phys. 24, 519 (1985).
- Frederikse et al. (1964) H. P. R. Frederikse, W. R. Thurber, and W. R. Hosler, Phys. Rev. 134, A442 (1964).
- Ohta et al. (2008) H. Ohta, K. Sugiura, and K. Koumoto, Inorg. Chem. 47, 8429 (2008).
- Xing et al. (2016) G. Xing, J. Sun, K. P. Ong, X. Fan, W. Zheng, and D. J. Singh, APL Mater. 4, 053201 (2016).
- Kuroki and Arita (2007) K. Kuroki and R. Arita, J. Phys. Soc. Jpn 76, 083707 (2007).
- Chen et al. (2013) X. Chen, D. Parker, and D. J. Singh, Sci. Rep. 3, 3168 (2013).
- Usui et al. (2013) H. Usui, K. Suzuki, K. Kuroki, S. Nakano, K. Kudo, and M. Nohara, Phys. Rev. B 88, 075140 (2013).
- Usui et al. (2010) H. Usui, S. Shibata, and K. Kuroki, Phys. Rev. B 81, 205121 (2010).
- Shirai and Yamanaka (2013) K. Shirai and K. Yamanaka, J. Appl. Phys. 113, 053705 (2013).
- Parker et al. (2013) D. Parker, X. Chen, and D. J. Singh, Phys. Rev. Lett. 110, 146601 (2013).
- Mecholsky et al. (2014) N. A. Mecholsky, L. Resca, I. L. Pegg, and M. Fornari, Phys. Rev. B 89, 155131 (2014).
- Sun and Singh (2016) J. Sun and D. J. Singh, Phys. Rev. Applied 5, 024006 (2016).
- Cain et al. (2013) T. A. Cain, A. P. Kajdos, and S. Stemmer, Appl. Phys. Lett. 102, 182101 (2013).
- Yu et al. (2008) C. Yu, M. L. Scullin, M. Huijben, R. Ramesh, and A. Majumdar, Appl. Phys. Lett. 92, 191911 (2008).
- Wang et al. (2013) N. Wang, H. Chen, H. He, W. Norimatsu, M. Kusunoki, and K. Koumoto, Sci. Rep. 3, 3449 (2013).
- Oh et al. (2011) D.-W. Oh, J. Ravichandran, C.-W. Liang, W. Siemons, B. Jalan, C. M. Brooks, M. Huijben, D. G. Schlom, S. Stemmer, L. W. Martin, et al., Appl. Phys. Lett. 98, 221904 (2011).
- Muta et al. (2003) H. Muta, K. Kurosaki, and S. Yamanaka, J. Alloys Compd. 350, 292 (2003).