On the morphology of ray emission induced by from annihilating self-interacting dark matter
Abstract
With the Fermi-LAT data quite a few research groups have reported a spatially extended GeV -ray excess surrounding the Galactic Center (GC). The physical origin of such a GeV excess is still unclear and one interesting possibility is the inverse Compton scattering of the electrons/positrons from annihilation of self-interacting dark matter (SIDM) particles with the interstellar optical photons. In this work we calculate the morphology of such a kind of -ray emission. For the annihilation channel of , the inverse Compton scattering (ICS) dominates over the bremsstrahlung on producing the GeV -ray emission. For the SIDM particles with a rest mass tens GeV that may be favored by the modeling of the Galactic GeV excess, the ICS radiation at GeV energies concentrates along the Galactic plane. The degrees of asymmetry high up to are found in some regions of interest, which in turn proposes a plausible test on the SIDM interpretation of the GeV excess.
pacs:
95.35.+d, 98.70.RzI Introduction
In the standard CDM cosmology model, cold dark matter (DM) consists of energy density in the current universe P. A. R. Ade et al. (2014). Various well-motivated particle candidates have been proposed in the literature and the weakly interacting massive particles (WIMPs) are the most extensively discussed particles Jungman et al. (1996); Bertone et al. (2005); Hooper and Profumo (2007); Feng (2010); Fan et al. (2010). In principle, WIMPs may be able to annihilate with each other (or alternatively decay) and produce energetic particle/antiparticle pairs and gamma-rays. Search for the dark matter originated signals in high energy cosmic rays and gamma-rays is one of the prime targets of some space missions such as PAMELA 111http://pamela.roma2.infn.it/index.php, Fermi-LAT 222http://fermi.gsfc.nasa.gov/, AMS-02 333http://www.ams02.org/ and DAMPE 444http://dpnc.unige.ch/dampe/. Though abundant, so far the DM particles have not been reliably detected. Nevertheless, some tentative signals have attracted wide attention. Among them the most-widely examined signals include the electron/positron cosmic ray anomaly Adriani et al. (2009); Aguilar et al. (2013); Adriani et al. (2011); Chang et al. (2008); Ackermann et al. (2012b); Li et al. (2014) and the so-called Galactic center GeV excess, an “unexpected” spatially extended GeV -ray emission surrounding the Galactic Center (GC) Goodenough and Hooper (2009); Vitale and Morselli (2009); Hooper and Goodenough (2011); Hooper and Linden (2011); Abazajian and Kaplinghat (2012); Gordon and Macias (2013); Huang et al. (2013); Hooper and Slatyer (2013); Daylan et al. (2014); Zhou et al (2012); Calore et al. (2014b); Huang (2015); Ajello et al. (2015b); Liang et al. (2016b). Hereafter we denote the GC excess component as the GCE. The GCE is at GeV scale and extends to a Galactic latitude Hooper and Slatyer (2013). Both the spectrum and the morphology of the GCE are found to be compatible with that predicted from the annihilations of WIMPs with a rest mass tens GeV via the channels mainly to quarks Daylan et al. (2014). The GCE has also been found to be robust across a variety of models for the diffuse galactic ray emission Zhou et al (2012); Calore et al. (2014b); Huang (2015); Ajello et al. (2015b).
In the literature some models have been proposed for this peculiar signal in the GC, such as the millisecond pulsars (MSPs) Abazajian and Kaplinghat (2012); N. Mirabal (2013); Yuan and Zhang (2014); S. K. Lee et al. (2015, 2015a); Brandt et al. (2015a); Bartels et al. (2015), the leptonic cosmic ray outbursts Ilias Cholis et al (2015) and dark matter annihilation Hooper and Goodenough (2011); Hooper and Linden (2011); Abazajian and Kaplinghat (2012); Gordon and Macias (2013); Huang et al. (2013); Hooper and Slatyer (2013); Daylan et al. (2014); Zhou et al (2012); Calore et al. (2014b). One type of the DM model is the so-called self-interacting dark matter (SIDM) D.Spergel,P.Steinhardt (2000a); Yoshida et al. (2000); Carlson et al. (1997). Kaplinghat et al. M.Kaplinghat,T.Linden,and Hai-Bo Yu (2015a) showed that a special SIDM model could account for the GCE. In such a model the SIDM particles interact with each other via a light mediator and annihilate to energetic pairs. Then the high energy scatter with the starlight and afterward boost the optical photons to higher energies that can be estimated as , where is the Lorentz factor of the pairs formed in the dark matter annihilation and eV is the typical energy of the starlight. For the dark matter particles with a rest mass GeV, in the case of we have and , where is the rest mass of the electrons/positrons. A detailed numerical investigation demonstrates that the inverse Compton scattering (ICS) process can reasonably explain the GCE spectrum for GeV M.Kaplinghat,T.Linden,and Hai-Bo Yu (2015a). Moreover, on one hand, numerical simulations have shown that nuclear-scale dark matter self-interaction cross sections can produce heat transfer from the hot outer region to the cold inner region of dark matter halos, reducing the central densities of dwarf galaxies in accordance with observations Vogelsberger et al. (2006); Rocha et al. (2013); Zavala et al. (2013); O. D. Elbert et al (2015). On the other hand, the pairs produced via dark matter annihilation will not produce plentiful rays from dwarf galaxies due to the hosted low starlight and gas densities, in agreement with the non-detection of the statistical significant gamma-ray signal from the spherical dwarf galaxies Ackermann et al. (2015); Sameth,Koushiappas,and Walker (2015a); Shang Li et al (2015).
In this work, we investigate in detail the spatial distribution of the ICS component. The main concern is the following: For the prompt gamma-rays resulting in the final state radiation of dark matter annihilation, the morphology should be directly governed by the dark matter distribution and is hence expected to be spherically symmetric with respect to the GC. For the ICS component, however, the situation is more complicated since the distribution of the interstellar radiation field is not isotropic. The spatial distribution of the ICS component does not follow the electron/positron pairs originated from dark matter annihilation unless the electrons/positrons are energetic enough to lose most of their energy quickly via ICS. The morphological properties of inverse Compton emission from DM annihilations have been investigated previously in the literature Regis,Ullio (2009a); Borriello et al. (2010a); Dobler et al. (2010a, 2011a); Yuan et al. (2015a). Herein, we propose a new method to quantitatively calculate the asymmetry of spatial distribution of gamma-ray skymap and subsequently apply it to the specific SIDM model for the GCE. In this work we adopt the GALPROP v54 code 555http://galprop.stanford.edu Strong and Moskalenko (1998) to numerically calculate the morphology of the ICS component.
This work is structured as follows. In Sec. II we briefly introduce the calculation of the spatial distribution of diffuse -ray emission of DM annihilations and the regions of interest (ROI) adopted in this paper. In Sec. III we calculate the degree of “departure” from the rotational-symmetry of the morphology of -ray emission in two ways. We take bremsstrahlung and prompt emission into account and test the influence of Cosmic Ray Propagation Parameters on numerical analysis in Sec. III.3. In Sec. IV we summarize our results with some discussion on the prospect of testing the SIDM annihilations origin of the GCE.
II The spatial distribution of diffuse rays emission and our regions of interest
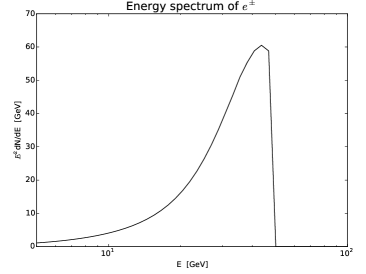
The cosmic ray electrons/positrons propagating through the Milky Way interact with interstellar gas, magnetic fields as well as the interstellar radiation field (ISRF Strong and Porter (1998)) and generate high energy gamma-ray emission. In this work we consider the electron/positron pairs only resulting from SIDM annihilation. The spectra of such electron/positron pairs are calculated with the software PPPC4DMID Cirelli et al. (2012) (see the left panel of Fig. 1). The dark matter distribution is taken to be the generalized NFW profile Navarro et al. (1996, 1997), where kpc is the scale radius and is the slope index (such an was favored in the modeling of the GCE Hooper and Slatyer (2013); Daylan et al. (2014)). The local DM energy density is taken to be . For illustration we take GeV and except in Sec. III.3 where we will also discuss the case of TeV.
We take the GALPROP v54 code Strong and Moskalenko (1998) to calculate the propagation of and -ray emission through ICS as well as bremsstrahlung. The diffusion with re-acceleration configuration of the propagation model is adopted. And we take one group of propagation parameters as default parameters in the bulk of this paper for simplicity except in Sec. III.3 where two different propagation parameters would be used for comparison. The default parameters comprise diffusion coefficient =5.3 at the reference rigidity GV, the height of the propagation halo kpc, the Alfven speed which characterizes the re-acceleration, and the power-law index =0.33 of the rigidity dependence of the diffusion coefficient I. V., et al (2011c); Jin et al. (2012).
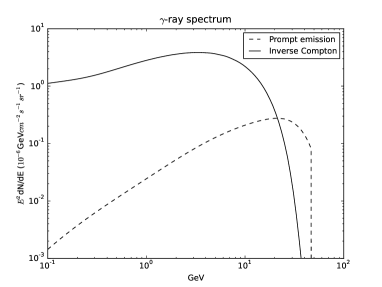
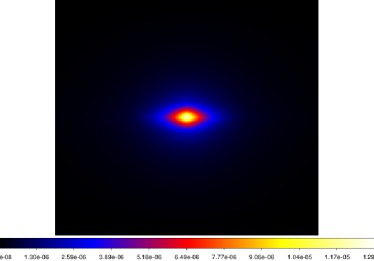
We focus on the ICS rays in the energy range of in which the GCE likely peaks Daylan et al. (2014); Zhou et al (2012); Calore et al. (2014b); Huang (2015); Ajello et al. (2015b). The result is shown in the left panel of Fig. 2, covering regions of and , in unit of . In addition to the spatial distribution, we present the prompt and ICS emission spectra in the right panel of Fig. 1. The ICS radiation component is stronger than the prompt emission component over a wide energy range. As the spherical harmonics analysis can reveal detailed information about the physical quantity distributed on the surface of a sphere, we store the count map in HEALPIX 666http://healpix.sourceforge.net/ form (with resolution parameter NSIDE=512) as well in Sec. III.2, in order to carry out the analysis.
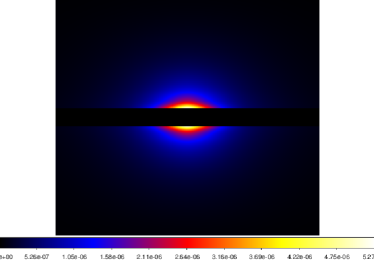
GC hosts a lot of sources with energetic activities that could be accelerators of cosmic rays.Therefore GC is not a perfect region to analyze the DM origin signal from an observational aspect. For this reason, we also consider the case of masking the regions of in our analysis.
It is well known that the spherically symmetric emission about the GC will be rotationally symmetric for observers on the Earth. In other words, the rotational symmetry along our line of sight to the GC reflects the spherical symmetry with respect to GC. In order to analyze the rotational asymmetry, we examine the variance of the flux in a given viewing angle region (i.e., , where ) but at different . A coordinate transformation (see Fig. 3) is therefore needed to manifest the asymmetry. The equations of coordinate transformation are
| (1) |
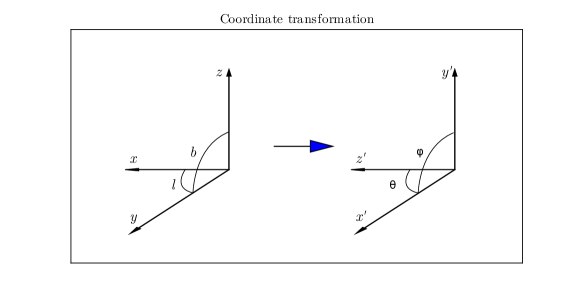
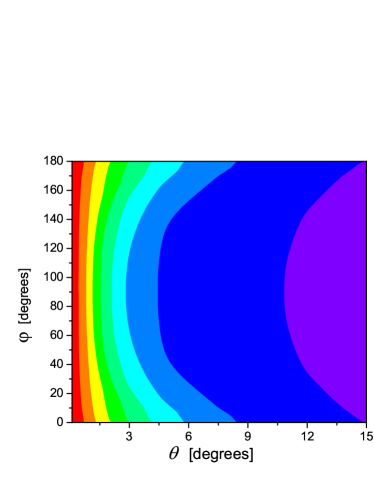
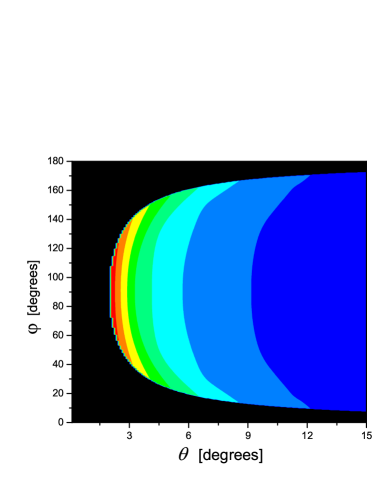
In the new coordinate system, spherical coordinate is the angle observed away from the GC. At a given , the flux of gamma-ray emission varying with spherical coordinate reflects the asymmetry. In Fig. 4, we show part of the results of coordinate transformation of two count maps in Fig. 2, where and are set as the horizontal and longitudinal coordinates respectively. The change of the flux along the longitudinal coordinate manifests the rotational asymmetry. As shown in both the left and the right panels of Fig. 4, non-negligible rotational asymmetry displays in the data, which is independent of whether or not we mask the regions of .
Now we optimize our ROIs to reduce the calculation time as well as the uncertainties for possible observational test in the future. The field of starlight is not only approximately axial symmetric about the GC but also mirror symmetric about the Galactic plane. So 1/4 of the count map in Fig. 2 is enough if one is only interested in the ICS emission. Therefore we select a ROI in Sec. III.1 as and (i.e., ROI I), as shown in the left panel of Fig. 5. Considering the complication about GC, we mask the region of ROI I and denote it as ROI II (i.e. right panel of Fig. 5) for further study. In Sec. III.2, however, we analyze the whole celestial sphere in order to conduct the spherical harmonics analysis. The regions of the whole sky with and without () are defined as ROI III (see the left of top and middle panel of Fig. 6) and ROI IV ( see left of bottom panel of Fig. 6), respectively. While in Sec. III.3, the ROI V (i.e. the regions of , and ) is slightly different from ROI II that we don’t show specifically. The reason is that the distribution of gas in the Milky Way doesn’t share the approximate symmetry with starlight.
III Studies of the morphology of the ray emission
III.1 Degree of asymmetry of -ray emission
In this section, we analyze the asymmetry in the new coordinate system (see Fig. 3). The ICS emission flux varying with directly reflects the asymmetry at a given spherical coordinate . We prefer the flux data on average in several sub-regions instead of analyzing value of special points in case of statistical errors for the observational test. Hus, we divide the ROI I into three sub-regions (i.e., , and ) and split each sub-region equally into three segments. The ROI II is divided in the same way as for ROI I except that the three segments are no longer equal since the regions of have been masked. Additionally, one segment (, , ) is so small that it can be abandoned. Comparing the variance of average flux of these segments in a sub-region, we could get the maximum, the minimum and the mean value of these segments (i.e., ). Let us define the degree of asymmetry (DOA) in order to give a quantitative description of the spatial distribution, i.e.,
| (2) |
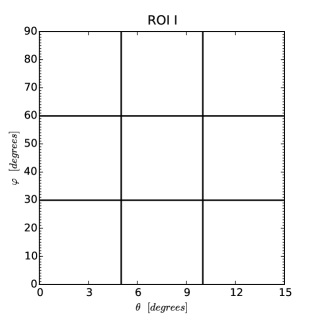
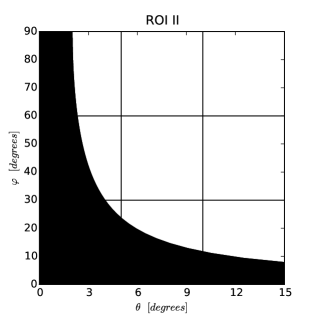
Table 1 presents our DOAs in the sub-regions of ROI I and ROI II, respectively. Significant asymmetries (i.e., DOA ) are found in most sub-regions. The values of DOA in ROI I are found to be larger than those in ROI II. The reason is that the flux in the Galactic plane is larger than in other places. If the regions are masked, the average flux of the segments that contain the masked area decreases. As a result, the change of average flux is “suppressed”. In another word, the mask of some sky along the Galactic plane would reduce the DOA.
| sub-regions of ROI I | DOA | Sub-regions of ROI II | DOA | ||
|---|---|---|---|---|---|
| , | , | ||||
| , | , | ||||
| , | , |
III.2 Spherical harmonics expansion
As for cosmic microwave background (CMB), we carry out a spherical harmonics expansion to spatial distribution of -ray induced by DM annihilations despite having limited data Selig et al. (2000). Since a set of fundamental cosmological parameters have been inferred from angular power spectrum (APS) of the CMB P. A. R. Ade et al. (2014), the analysis of the APS of spatial distribution of the possible DM-induced -ray emission may yield more information on its nature.
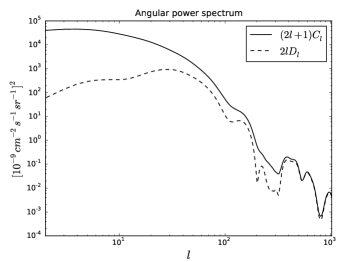
In Sec. II we have mentioned that spherical harmonics analysis would be done in the new coordinate system (see Fig. 3). Using HEALPIX, we analyze the count map of rays in the energy range of via spherical harmonics expansion. If some coefficients of terms are nonzero for , there should be departure from the rotational symmetry. The APS is defined as = , where . In order to better show the asymmetries, we take = , where . In order to check the approach, we analyze the count map of prompt -ray emission of channel: , which is rotationally-symmetric. The results are shown in top panel of Fig. 6, where count map in logarithmic scale is on the left and two types of APS are on the right. It’s clear that the coefficients of terms for are relatively negligible for most of multiple . However, the method is not valid when is approaching 1024, due to numerical errors.
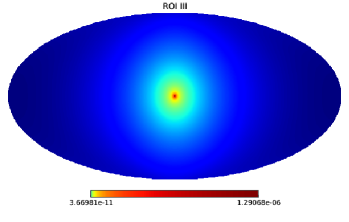
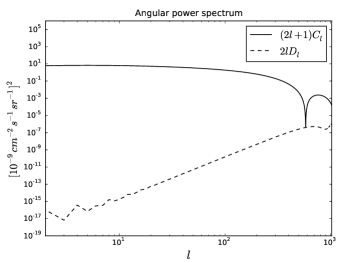
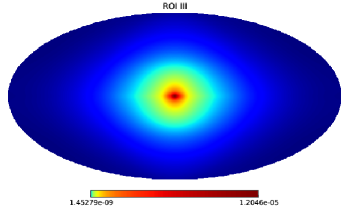
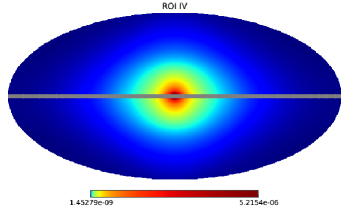
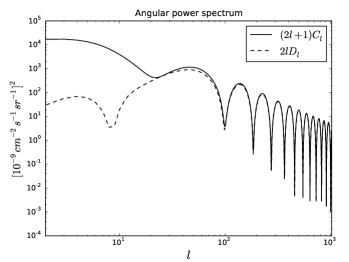
Two kinds of power spectra are shown in the right of Fig. 6 while the figures on the left are count maps in logarithmic scale. The APS without masking the regions of (see the right of middle panel of Fig. 6) is smooth and easily analyzed. For , the asymmetry is negligible as the value of is much smaller than that of . When reaches 50, the asymmetry becomes important. When masking the regions of , the APS oscillates quickly (see the right of bottom panel of Fig. 6). The oscillation of APS is due to masking of such regions and some DOA information is lost. As a result, it’s not proper to analyze qualitatively when the APS oscillates (e.g. ).
III.3 The robustness of the DOA
In the previous studies of DOA, we don’t take the bremsstrahlung and prompt emission components into account since they are relatively weak compared to the ICS for SIDM annihilation channel Cirelli et al. (2012). The bremsstrahlung diffuse emission flux in the Galactic plane would be much larger than in other places since the Galactic plane contains dense gas. Hence the rotational asymmetry of the bremsstrahlung component is expected to be larger than that of the ICS component. The DOA increases if both the bremsstrahlung and ICS components are considered together. As for the prompt emission component, we utilize the PPPC4DMID Cirelli et al. (2012) to calculate the spectra of the DM annihilation. We also adopt the same generalized NFW profile, as was used in Sec. II. Contrary to bremsstrahlung emission, the prompt emission of DM annihilation will not give rise to a DOA. If these three components are summed, the net DOA would be determined by the relative amounts of these constituents. Since bremsstrahlung emission doesn’t possess the symmetry of ICS, we compute the DOA in ROI V instead of ROI II to obtain a more precise result. The results of DOAs are summarized in Table 2. Comparing with the DOA of ICS presented in the second column of Table 1, we find that at least for our fiducial parameters the bremsstrahlung and prompt emission components do not play an important role in modifying the DOA.
| Sub-regions of ROI V | DOA |
|---|---|
| , | |
| , | |
| , |
Let us also check whether or not the high anisotropy of the diffuse emission originating from SIDM might be a consequence of utilizing a special group of cosmic ray propagation parameters. Such a possibility can be tested by varying the propagation parameters. We re-calculate the DOA by adding ICS, Bremsstrahlung and Prompt emission components in ROI V using two groups of parameters listed in Table 3 Ackermann
et al. (2012a). Such a range including the parameters used in previous studies will largely cover the uncertainties of the propagation parameters I. V., et al (2011c); Jin et al. (2012). We would refer to the two rows of Table 3 as parameter set 1, parameter set 2 respectively. The results are depicted in Table 4. Despite suffering from some variations compared with the DOA listed in Table 2, the DOAs are still significant, suggesting that our previous conclusions are robust.
| () | (kpc) | () | ||||||
|---|---|---|---|---|---|---|---|---|
| Set 1 | 2.7 | 2 | 35.0 | 0.33 | ||||
| Set 2 | 9.4 | 10 | 28.6 | 0.33 |
| Sub-regions of ROI V | Set 1 | Set 2 | ||
|---|---|---|---|---|
| , | 0.03 | 0.07 | ||
| , | 0.39 | 0.39 | ||
| , | 0.86 | 0.37 |
However, there could be an exception if the dark matter particles have a TeV. Though in this work we focus on tens GeV that might be favored by the GCE emission, for completeness here we also briefly examine the case of TeV (see J.Zhang et al (2014a) for the case of ), for which the ICS emission component may have a much smaller DOA. The reason is that for tens GeV, the resulting electron/positron pairs have and they mainly scatter with the starlight. While for TeV, the formed electron/positron pairs have . In the rest frame of such energetic particles, the starlight has an energy , exceeding the rest mass of the electrons/positrons. As a result, the inverse Compton scattering is effectively suppressed. Instead, the TeV electrons mainly scatter the CMB and infrared photons and can boost some of them to , again well within the energy range of the GCE emission. We calculate the DOA in ROI V. There is no sizeable DOA in all sub-regions (less than 10).
IV Discussion
With the Fermi-LAT data quite a few research groups have reported a very-significant spatially extended GeV -ray excess surrounding the Galactic Center. The physical origin of such a GeV excess is highly debatable and an interesting possibility is the ICS of the electrons/positrons from annihilation of self-interacting dark matter particles with the interstellar optical photons. In such a scenario, the constraints set by the non-detection of a clear signal in the dwarf spherical galaxies is likely non-applicable since the pairs produced via dark matter annihilation will not produce plentiful rays due to the low starlight/gas-densities. Motivated by such facts, in this work we have investigated morphology of the GeV -ray emission resulting in the ICS process. The regions of have been explored and the DM density distribution has been taken as the generalized NFW profile with kpc and the slope index . The annihilation channel of has been investigated. The general conclusion is that for , the degree of rotational asymmetry reaches or even larger for tens GeV, independent of the propagation parameters. The physical reason is that for the tens of GeV electrons/positrons, the cooling is not quick enough to lose significant portions of their kinetic energy locally. As a result, the ICS emission traces the distribution of the starlight, which is expected to be most dense along the Galactic plane since most of the stars concentrate in such a region. For the same reason, though in this work we have only discussed the ICS process of the tens GeV electrons/positrons from dark matter annihilation, a significant DOA is expected for the ICS GeV emission of the tens GeV electrons/positrons originating from other astrophysical processes (for example, the millisecond pulsars are also believed to be high energy electron/positron sources. We note that such a scenario has been investigated recently by T. Lacroix et al (2015)). One caution is that, if instead the electron/positron pairs were from the annihilation of dark matter particles with a TeV, the DOA seems negligible.
The sizeable DOA found in the regions of is helpful in testing the SIDM ICS interpretation of the GeV excess. As found in the latest analysis by the Fermi collaboration Ajello et al. (2015b), if only interstellar emission and point sources are fit to the data the residual GeV emission is weakly asymmetric about the GC, but the statistical noise is large. This may be suggestive of an excess in the data that is not symmetric with respect to the GC. However, the current astrophysical background gamma-ray emission in particular in the direction of the Galactic center is still to be better constrained. Different Galactic diffuse emission models yield different GCE spectra and the difference can be up to or even larger (e.g., Calore et al. (2014b); Zhou et al (2012)). Fortunately, the Fermi-LAT team is developing a new model of Galactic diffuse emission, with which the uncertainties of astrophysical background can be significantly reduced Johannesson (2015). With the improved diffuse background model a reliable asymmetry of the GCE emission signal is expected, which can then be used to reliably test the ICS interpretation of GCE within the scenario of SIDM annihilation.
Acknowledgements.
We thank Q. Yuan, L. Feng, X. Li, P.-F. Zhang and Z.-Q. Shen for helpful discussions. This work is supported in part by the National Natural Science Foundation of China (under Grants No. 11275097, No. 11475085, and No. 11535005).References
- P. A. R. Ade et al. (2014) P. A. R. Ade et al. (Plank Collaboration), Astron.Astrophys. 471, 16 (2014). eprint 1303.5076.
- Jungman et al. (1996) G. Jungman, M. Kamionkowski, and K. Griest, Phys.Rept. 267, 195 (1996), eprint hep-ph/9506380.
- Bertone et al. (2005) G. Bertone, D. Hooper, and J. Silk, Phys.Rept. 405, 279 (2005), eprint hep-ph/0404175.
- Hooper and Profumo (2007) D. Hooper and S. Profumo, Phys.Rept. 453, 29 (2007), eprint hep-ph/0701197.
- Feng (2010) J. L. Feng, Ann.Rev.Astron.Astrophys. 48, 495 (2010), eprint 1003.0904.
- Fan et al. (2010) Y.-Z. Fan, B. Zhang, and J. Chang, Int.J.Mod.Phys. D19, 2011 (2010), eprint 1008.4646.
- Chang et al. (2008) J. Chang, J. Adams, H. Ahn, G. Bashindzhagyan, M. Christl, et al., Nature 456, 362 (2008).
- Adriani et al. (2009) O. Adriani et al. (PAMELA Collaboration), Nature 458, 607 (2009), eprint 0810.4995.
- Adriani et al. (2011) O. Adriani et al. (PAMELA Collaboration), Phys.Rev.Lett. 106, 201101 (2011), eprint 1103.2880.
- Ackermann et al. (2012b) M. Ackermann et al. (Fermi LAT Collaboration), Phys.Rev.Lett. 108, 011103 (2012b), eprint 1109.0521.
- Aguilar et al. (2013) M. Aguilar et al. (AMS Collaboration), Phys.Rev.Lett. 110, 141102 (2013).
- Li et al. (2014) X. Li, Z.-Q. Shen, B.-Q. Lu, T.-K. Dong, Y.-Z. Fan, et al. (2014), eprint 1412.1550.
- Goodenough and Hooper (2009) L. Goodenough and D. Hooper (2009), eprint 0910.2998.
- Vitale and Morselli (2009) V. Vitale and A. Morselli (Fermi/LAT Collaboration) (2009), eprint 0912.3828.
- Hooper and Goodenough (2011) D. Hooper and L. Goodenough, Phys.Lett. B697, 412 (2011), eprint 1010.2752.
- Hooper and Linden (2011) D. Hooper and T. Linden, Phys.Rev. D83, 083517 (2011), eprint 1011.4520.
- Abazajian and Kaplinghat (2012) K. N. Abazajian and M. Kaplinghat, Phys.Rev. D86, 083511 (2012), eprint 1207.6047.
- Gordon and Macias (2013) C. Gordon and O. Macias, Phys.Rev. D88, 083521 (2013), eprint 1306.5725.
- Huang et al. (2013) W.-C. Huang, A. Urbano, and W. Xue (2013), eprint 1307.6862.
- Hooper and Slatyer (2013) D. Hooper and T. R. Slatyer, Phys.Dark Univ. 2, 118 (2013), eprint 1302.6589.
- Daylan et al. (2014) T. Daylan, D. P. Finkbeiner, D. Hooper, T. Linden, S. K. N. Portillo, et al. (2014), eprint 1402.6703.
- Zhou et al (2012) B. Zhou et al. Phys.Rev. D91, 123010 (2015), eprint 1406.6948.
- Calore et al. (2014b) F. Calore, I. Cholis, and C. Weniger (2014b), eprint 1409.0042.
- Huang (2015) X.-Y. Huang T. Enlin and M. Selig (2015), eprint 1511.02621.
- Ajello et al. (2015b) M. Ajello et al. (Fermi LAT Collaboration), eprint 1511.02938.
- Liang et al. (2016b) Y.F. Liang et al. ,eprint 1602.06527 .
- N. Mirabal (2013) N. Mirabal, Mon.Not.Roy.Astron.Soc. 436, 2461 (2013).
- Yuan and Zhang (2014) Q. Yuan and B. Zhang (2014), eprint 1404.2318.
- Bartels et al. (2015) R. Bartels, S. Krishnamurthy, and C. Weniger, Phys.Rev.Lett. 116, 041102 (2015).
- S. K. Lee et al. (2015) S. K. Lee, M. Lisanti, and B.R. Safdi, JCAP 1505, 056 (2015), eprint 1412.6099.
- S. K. Lee et al. (2015a) M. Lisanti, B.R. Safdi et al. Phys.Rev.Lett. 116, 051103 (2015).
- Brandt et al. (2015a) D. Brandt andB. Kocsis Astrophys.J. 812, 15 (2015a), eprint 1507.05616.
- Ilias Cholis et al (2015) I. Cholis et al. (2015), eprint 1506.05119.
- Carlson et al. (1997) E. D. Carlson, M. E. Machacek, and L. J. Hall, Astrophys.J. 398, 43 (1992).
- D.Spergel,P.Steinhardt (2000a) D. N. Spergel, and P. J. Steinhardt, Phys.Rev.Lett. 84, 3760 (2000).
- Yoshida et al. (2000) N. Yoshida, V. Springel, S. D. M. White, and G. Tormen, Astrophys.J. 544, 87 (2000).
- M.Kaplinghat,T.Linden,and Hai-Bo Yu (2015a) M. Kaplinghat, T. Linden, and H.B. Yu, Phys.Rev.Lett. 114, 211303 (2015).
- Vogelsberger et al. (2006) M. Vogelsberger, J. Zavala, and, A. Loeb, et al., Mon.Not.Roy.Astron.Soc. 432, 3740 (2012).
- Rocha et al. (2013) M. Rocha, A. H. G. Peter, J. S. Bullock, M. Kaplinghat, S.G. Kimmel, et al., Mon.Not.Roy.Astron.Soc. 430, 81 (2013).
- Zavala et al. (2013) J. Zavala, M. Vogelsberger, and, M.G. Walker, Mon.Not.Roy.Astron.Soc. 431, L20 (2013).
- O. D. Elbert et al (2015) O. D. Elbert et al. (2014), eprint 1412.1477.
- Ackermann et al. (2015) M. Ackermann et al. (Fermi-LAT) (2015), eprint 1503.02641.
- Sameth,Koushiappas,and Walker (2015a) A. G. Sameth, S. M Koushiappas, and M. G Walker, Phys.Rev.D. 91, 083535 (2015).
- Shang Li et al (2015) S. Li et al. (2015), eprint 1511.09252.
- Borriello et al. (2010a) E. Borriello, A. Cuoco, andE. Miele, Astrophys.J. 699, 59 (2009a).
- Regis,Ullio (2009a) M. Regis, P. Ullio, Phys.Rev.D. 80, 043525 (2009).
- Dobler et al. (2010a) G. Dobler, P. Finkbeiner, I. Cholis, et al. Astrophys.J. 717, 825 (2010a), eprint 0910.4583.
- Dobler et al. (2011a) G. Dobler, I. Cholis, and N. Weiner, Astrophys.J. 741, 25 (2011a), eprint 1102.5095.
- Yuan et al. (2015a) Q. Yuan andK. Ioka Astrophys.J. 802, 124 (2015a).
- Strong and Moskalenko (1998) A. Strong and I. Moskalenko, Astrophys.J. 509, 212 (1998), eprint astro-ph/9807150.
- Strong and Porter (1998) A. Porter and I. Strong, eprint astro-ph/0507119.
- Cirelli et al. (2012) M. Cirelli, G. Corcella, A. Hektor, G. Hütsi, et al. JCAP 1103, 051 (2011), eprint 1012.4515.
- Navarro et al. (1996) J. F. Navarro, C. S. Frenk, and S. D. White, Astrophys.J. 462, 563 (1996), eprint astro-ph/9508025.
- Navarro et al. (1997) J. F. Navarro, C. S. Frenk, and S. D. White, Astrophys.J. 490, 493 (1997), eprint astro-ph/9611107.
- I. V., et al (2011c) R. Trotta, G. Jóhannesson, and I. V. Moskalenko et al. Astrophys.J. 729, 106 (2011c).
- Jin et al. (2012) H.-B. Jin, Y.-L. Wu, Y.-F. Zhou, and JCAP 1509, 049 (2015), eprint 1410.0171.
- Selig et al. (2000) M. Selig, V. Vacca, N. Oppermann, and T. Enßlin, Astron.Astrophys. 581, 126 (2015), eprint 1410.4562.
- Ackermann et al. (2012a) M. Ackermann et al. (Fermi-LAT Collaboration), Astrophys.J. 750, 3 (2012a), eprint 1202.4039.
- J.Zhang et al (2014a) J. Zhang, et al. Phys.Rev.D. 80, 023007 (2009).
- T. Lacroix et al (2015) T. Lacroix et al. (2015), eprint 1512.01846.
- Johannesson (2015) G. Johannesson (2015), URL http://fermi.gsfc.nasa.gov/science/mtgs/symposia/2015/program/thursday/session13/GJohannesson.pdf