Evolved stars in the Local Group galaxies. I. AGB evolution and dust production in IC 1613
Abstract
We used models of thermally-pulsing asymptotic giant branch (AGB) stars, that also describe the dust-formation process in the wind, to interpret the combination of near– and mid–infrared photometric data of the dwarf galaxy IC 1613. This is the first time that this approach is extended to an environment different from the Milky Way and the Magellanic Clouds (MCs). Our analysis, based on synthetic population techniques, shows a nice agreement between the observations and the expected distribution of stars in the colour–magnitude diagrams obtained with and Spitzer bands. This allows a characterization of the individual stars in the AGB sample in terms of mass, chemical composition, and formation epoch of the progenitors. We identify the stars exhibiting the largest degree of obscuration as carbon stars evolving through the final AGB phases, descending from objects of metallicity and from stars with . Oxygen–rich stars constitute the majority of the sample (, mainly low mass stars () that produce a negligible amount of dust (). We predict the overall dust-production rate from IC 1613, mostly determined by carbon stars, to be with an uncertainty of 30%. The capability of the current generation of models to interpret the AGB population in an environment different from the MCs opens the possibility to extend this kind of analysis to other Local Group galaxies.
keywords:
Stars: abundances – Stars: AGB and post-AGB. ISM: abundances, dust1 Introduction
Stars of mass in the range , after the consumption of helium in the core, evolve through the thermally-pulsing asymptotic giant branch (AGB) phase. This evolutionary phase, though extremely short compared to the duration of the core hydrogen and helium burning, is of paramount importance, because it is during the AGB phase that most of the mass loss occurs, thus allowing the pollution of the interstellar medium with gas and dust.
The importance of this class of objects stems from their relevance in several astrophysical contexts, such as their effect on the determination of the masses and star–formation rates of low– and high– redshift galaxies (Maraston et al., 2006; Conroy et al., 2009), their role in the chemical evolution of galaxies (Romano et al., 2010), and likely the formation of second generation stars in globular clusters (Ventura et al., 2001). Furthermore, AGB stars are efficient dust manufacturers, owing to the thermodynamic conditions of their circumstellar envelope, a favourable environment for dust formation (Ferrarotti & Gail, 2001, 2002, 2006).
The evolution through the AGB is as complex as it is important, owing to the delicate interface between the thermodynamic structure of the compact, degenerate core and the tenuous, expanded convective envelope. In the stellar layers separating these two regions, the main physical variables, i.e. pressure, temperature and density, drop by several orders of magnitude, thus rendering the physical and numerical description of the stellar structure problematic. To this, we add the uncertain description of convection and mass loss, which is still unknown based on first principles and thus modelled via empirical prescriptions. These are the main reasons why, despite the significant progress of AGB modelling over the last few years (e.g., Karakas & Lattanzio 2014), the results are still not completely reliable. The comparison between theoretical AGB models with observations is crucial in order to substantially improve the predictive power of the stellar evolution models.
The Magellanic Clouds (MCs) have been extensively used to test theoretical predictions and to derive information on the internal structure and on the efficiency of the mechanisms that are altering the surface chemical composition of AGB stars. The near– and mid–infrared (IR) colours of the stars observed are extremely sensitive to the dust present in the wind; they can thus test the description of the dust formation in the circumstellar envelope, which some research groups have recently coupled with the modelling of the central star (Ventura et al., 2012a, b; Di Criscienzo et al., 2013; Ventura et al., 2014a; Nanni et al., 2013a, b, 2014). This field of research is currently undergoing significant improvements, with the introduction of chemical–dynamical models of the circumstellar envelope which are promising replacements of the hydrostatic approximation currently used (Marigo et al., 2016).
The comparison between the Spitzer data and the evolutionary sequences allowed the characterisation of the AGB population of the MCs, in terms of mass, age and metallicity distribution (Dell’Agli et al., 2014a, 2015a, 2015b). The analysis of the stars exhibiting the largest degree of obscuration in the MCs was shown to be a valuable indicator not only of the main physical processes taking place during the AGB evolution, but also of the efficiency with which dust grains form and grow in the circumstellar envelope (Ventura et al., 2015, 2016).
To allow a more exhaustive test of the theoretical models used so far, it is crucial to extend this kind of analysis to environments with different metallicities and star formation histories (SFH). This is now possible, thanks to the mid–IR survey of DUST in Nearby Galaxies with Spitzer (DUSTiNGS; Boyer et al., 2015a, b), which provided m and m Spitzer imaging of 50 dwarf galaxies within 1.5 Mpc. The availability of mid–IR data complements recent HST studies aimed at constraining the lifetimes of AGB stars in nearby galaxies (Girardi et al., 2010; Rosenfield et al., 2014, 2016). In particular, the combination of near– and mid–IR photometry is a powerful diagnostic of the AGB population of dwarf galaxies, with the goal of characterizing the stars observed in terms of mass, chemical composition, and progenitor formation epoch. Following the same approach adopted to study the evolved, obscured sources of the MCs, we base our analysis on the AGB evolutionary sequences that account for dust formation in the wind; this is required to correctly interpret the near– and mid–IR fluxes of AGB stars surrounded by dust. We also investigate the most obscured stars in the galaxy and predict the overall dust–production rate from AGB stars. To date, this is the first time that this methodology is applied to galaxies other than Milky Way and the MCs, providing a test of the current generation of AGB models in different environments.
The paper is organised as follows: the observational sample of AGB stars considered for the analysis is described in section 2; section 3 presents the numerical and physical inputs used to model the AGB phase and to produce the synthetic population. The description of the main properties of the AGB phase, including dust evolution and the impact on the IR emission, is discussed in section 4; section 5 present the interpretation of the observations and our conclusions are offered in section 6.
2 IC 1613: infrared observations and SFH
In this work, we focus on the irregular dwarf galaxy IC 1613, one of the nearest gas–rich dwarf galaxies in the Local Group, characterized by low internal reddening and foreground contamination. This choice is mainly motivated by the numerous population of AGB stars, widely studied in the literature. Borissova et al. (2000) presented the – and –band photometry of IC 1613, studying the distribution of AGB stars in the galaxy. Albert et al. (2000) identified carbon stars (C–stars) via a narrow–band wide field survey of IC 1613, focused on the CN and TiO photometry. Battinelli & Demers (2009), compared narrow–band identification of hundreds of C–stars with their and photometry classification, finding a threshold for the detection of C–stars. Menzies et al. (2015) presented a 3yr–survey of simultaneous imaging in the , and of IC 1613, focused on the identification of supergiants, oxygen–rich (O–rich) and C–stars. Wider and complete surveys of this galaxy in the near–IR bands were conducted by Sibbons et al. (2015) and Chun et al. (2015), and the former presented a population of AGB candidate classified on the basis of photometry. The distance of IC 1613 has been studied by several groups using different methods (Dolphin et al., 2001; Pietrzyński et al., 2006; Tammann et al., 2011). We adopt the mean distance of kpc, determined by Bernard et al. (2010) by comparing their own measurement using RR Lyrae and Cepheid data to the values found in the literature.
We base our analysis of the IC 1613 AGB population on near– and mid–IR observations. More specifically, we consider the sample of AGB candidates observed by Sibbons et al. (2015) with the Wide Field CAMera (WFCAM) mounted on UKIRT, in the , and bands, covering an area of 0.8 deg2 on the sky, within 4.5 kpc from the galactic centre. The effects of the internal reddening in the near–IR is negligible mag; Sibbons et al. (2015)), therefore no correction has been made to account for it. All magnitudes and colours are corrected for foreground extinction using the extinction map from Schlegel et al. (1998), which gives mag. Sibbons et al. (2015) flagged each object (as stellar, probably stellar, noise like, saturated etc.) in each band, on the base of the flux curve-of-growth for a series of apertures (Sibbons et al., 2012). Their criterion to select sources required that a given object has a magnitude measurement in all the three bands and that it is classified as stellar or probably stellar in at least two of the three bands111This criterion allows to remove the majority of the background galaxies, as shown by Sibbons et al. (2015)..To exclude the bulk of the foreground objects, Sibbons et al. (2015) assumed a color cut of mag. This is not sufficient to remove completely the foreground sources, which are estimated to contaminate the sample in the central region at the level of . In order to identify AGB candidates, they considered only stars brighter than the mag, i. e. the magnitude of the tip of the red giant branch (TRGB) at the distance of IC 1613. The resulting catalogue of AGB candidates is composed of stars. The AGB sample was further classified in C– and O–rich stars, adopting the following criterion: stars were classified as O–rich if they are confined in the region mag, while C–stars occupy the region mag. Indeed, there is no strict colour boundary between these two spectral types in and the misclassification of AGB sources in both directions is probable, as we show later (see section 5). This classification represents the red limit for the majority of the O–rich stars better than the blue limit for the C–type population (Kacharov et al., 2012; Sibbons et al., 2014).
We extend the analysis to the mid–IR spectral region in order to better constrain our AGB models on the basis of the dust contribution. Boyer et al. (2015a) present the DUSTiNGS survey of 50 dwarf galaxies observed in and around the Local Group, which is designed to detect evolved stars in the dust–producing phase. IC 1613 was observed with InfraRed Array Camera in the [3.6] and [4.5] bands during two epochs, reducing the effect of variability. The level of extinction in these bands results in a change in magnitude that is significantly less than the photometric uncertainties, so we have not corrected for it. Having only the measurement of the [3.6] and [4.5] magnitude available, it was not possible to reduce the contamination from background and foreground sources. Boyer et al. (2015a) adopted TRGB magnitude mag for all the 50 galaxies, considering only star brighter than this limit as AGB stars. While they could not classify all detected AGB stars with only the mid-IR data, they did separate a subset of individual AGB stars from foreground and background sources by their magnitude changes between two epochs.
We cross–correlated the sample of AGB candidates by Sibbons et al. (2015) with stars from the DUSTiNGS “Good Source” catalogue 222The“Good Source” catalogue is culled to include only high–confidence point sources and reliable measurements by Boyer et al. (2015a), using a matching radius of 1.2 arcsec. In this way we were able to select 755 objects, probably AGB stars, observed in both near– and mid–IR bands. 10% of the AGB candidates observed by Sibbons et al. (2015) are not matched with any star in the Boyer’s sample. The reason is that the field of view observed by UKIRT is wider than the Spitzer one: therefore, the majority (90%) of the stars observed by UKIRT that are not in the Spitzer sample fall in the region not covered by the DUSTiNGS field of view. Note that the most obscured stars are excluded by the criterion assumed by Sibbons et al. (2015) to select AGB candidates because they are not detected in the near–IR bands. However, these stars are present in the DUSTiNGS catalogue (see Section 5.3).
Recently, Skillman et al. (2014) presented a study of IC 1613 based on HST/ACS observations. In an area that covers 9% of the field, which is considered representative of the entire galaxy, they find an early phase of star formation, lasting 5–6Gyr, characterized by an approximately constant SFR ( ). This is followed by an epoch, started Gyr ago, during which the SFR has been a factor smaller. The recent era is characterized by a moderate and constant SFR ( ). Concerning the age–metallicity relation (AMR), Skillman et al. (2014) derive a constant increase of the metallicity () during the evolution of the galaxy; the values of span the range . In this work we use the SFR and AMR by Skillman et al. (2014) to construct the synthetic population of AGB stars, as described in section 5.
3 Numerical and physical inputs
3.1 Stellar evolution models
This work is based on evolutionary sequences calculated with the ATON code, extensively described in Ventura et al. (1998); the interested reader may find in Ventura & D’Antona (2009) a list of the most recent chemical and physical input. The models trace the pre–main sequence to the almost complete loss of the external mantle. The metallicities used are , and . The mixtures adopted are taken from Grevesse & Sauval (1998); for the lowest metallicity cases, we use and for , we adopted .
We adopt the physical input that is most relevant for this work, described as follows:
-
•
The convective instability is described by means of the Full Spectrum of Turbulence (FST) model developed by Canuto & Mazzitelli (1991). This prescription was shown to favour strong hot bottom burning (HBB) conditions during the AGB phase of stars (Ventura & D’Antona, 2005). Other models in the literature, based on the traditional mixing length theory (MLT), find that the lower limit in mass to reach HBB condition is (Karakas & Lattanzio, 2014; Marigo et al., 2013)
-
•
Nuclear burning and mixing of chemicals are self–consistently coupled, in a diffusive–like scheme. Overshoot of convective eddies into radiatively stable regions is described by means of an exponential decay of velocities from the convective/radiative interface, fixed by the Schwarzschild criterion. The e–folding distance is assumed to be (where is the pressure scale height calculated at the formal boundary of convection), in agreement with the calibration based on the observed luminosity function of C–stars in the Large Magellanic Cloud (LMC), given by Ventura et al. (2014a).
-
•
The mass–loss rate for oxygen–rich models is determined via the Blöcker (1995) treatment; we set the free parameter to , according to the calibration based on the luminosity function of lithium-rich stars in the MCs, given in Ventura et al. (2000). For C–stars we use the results from the Berlin group (Wachter et al., 2002, 2008). To account for the significant mass loss suffered by stars during the pre-AGB phases, we determined the mass at the beginning of the AGB evolution for these objects adopting the prescription by Rosenfield et al. (2014).
-
•
The molecular opacities in the low–temperature regime (below K) are calculated by means of the AESOPUS tool (Marigo & Aringer, 2009). The opacities are suitably constructed to follow the changes in the chemical composition of the envelope. This was shown to significantly affect the evolution following the achievement of the C–star stage (Ventura & Marigo, 2009, 2010).
3.2 Dust formation in the winds of AGB stars
The growth of dust particles in the circumstellar envelope is modelled according to the scheme introduced by the Heidelberg group (Gail & Sedlmayr, 1985, 1999; Ferrarotti & Gail, 2001, 2002, 2006; Zhukovska et al., 2008). The overall set of equations used and the physical assumptions behind this model are extensively described in the afore mentioned papers and by the previous works by our group (Ventura et al., 2012a, b; Di Criscienzo et al., 2013; Dell’Agli et al., 2014b; Ventura et al., 2014a).
The wind is assumed to expand isotropically, with constant velocity, from the surface of the star; once the gas particles enter the condensation zone, the wind is accelerated owing to the effects of radiation pressure on the newly formed grains. In this model, the dynamical conditions of the wind are determined on the basis of the mass and momentum conservation, whereas the growth of dust particles is found on the basis of the gas density and the thermal velocity in the inner border of the condensation region. Gas dynamics and dust grain growth are coupled via the extinction coefficient in the equation of momentum conservation, which depends on the number density and size of the grains formed.
The dust species taken into account depend on the surface chemical composition of the star. In carbon rich environments (), formation of solid carbon, silicon carbide (SiC) and solid iron are considered, whereas in oxygen–rich atmospheres we account for the formation of silicates, alumina dust and solid iron.
For any stage during the AGB evolution, the dust formed in the wind is determined self–consistently based on the physical parameters of the star (luminosity, mass, effective temperature and mass–loss rate) and on the surface chemical composition.
3.3 Synthetic spectra
The near– and mid–IR magnitudes used in the present analysis are found by a two–step process. First, on the basis of the values of mass, luminosity, effective temperature, mass–loss rate and surface chemical composition of a given AGB phase, the dust-formation model described in Section 3.2 is applied to determine the size of the dust grains formed and the optical depth (here we use the value at m, ). These ingredients are used by the code DUSTY (Nenkova et al., 1999) to calculate the synthetic spectra of each selected point along the evolutionary sequence. The input radiation from the central star was obtained by interpolating in gravity and effective temperature among the appropriate tables of the same metallicity: we used the NEXTGEN atmospheres (Hauschildt, 1999) for oxygen–rich stars and the COMARCS atmospheres (Aringer et al., 2009) for carbon stars. In the latter case we interpolated among the C/O values. The magnitudes in the various bands are obtained by convolution with the appropriate transmission curves. DUSTY needs as input parameters the effective temperature of the star, the radial profile of the gas density and the dust composition of the wind, in terms of the percentage of the various species present and of the size of the dust particles formed. All these quantities are known based on the results of stellar evolution and of the description of the wind. The interested reader may find a detailed description of this process in Dell’Agli et al. (2015a) (Section 2.3).
4 The evolution through the AGB phase
The models used here are extensively discussed in Ventura et al. (2013, 2014a, 2014b). We direct the interested reader to these papers for a full presentation of the evolutionary sequences. The models have been computed specifically for the present investigation. We consider the entire AGB evolution, which begins with the ignition of shell helium burning (early–AGB phase) and extends to the thermal pulse (TP) AGB phase.
4.1 The role of the initial mass
The physical and chemical evolution through the AGB phase is primarily affected by the initial mass of the star, as the latter quantity determines the core mass at the beginning of the TP phase, which is the key quantity in driving the AGB evolution (Herwig, 2005; Karakas & Lattanzio, 2014).
Models with mass above experience HBB, consisting of an advanced proton capture nucleosynthesis at the bottom of the convective envelope (Renzini & Voli, 1981). This nuclear activity requires that the temperature at the base of the external mantle () exceeds MK. The activation of HBB favours a significant increase in the stellar luminosity (Blöcker & Schönberner, 1991), which makes the core mass vs. luminosity relationship much steeper than that predicted by the classic Paczyński (1970) law. HBB affects the overall duration of the TP–AGB phase, because the higher luminosity favours a faster loss of the external mantle (Ventura & D’Antona, 2005). On the chemical side, the ignition of HBB triggers the activation of CN cycling, with the synthesis of nitrogen at the expense of carbon; this process requires temperatures MK. Stars of mass above evolve at MK, thus experiencing an even more advanced nucleosynthesis, with the activation of the full CNO cycle. The surface chemical composition of these stars will be carbon and oxygen poor, and enriched in nitrogen. The achievement of the C–star stage in the stars undergoing HBB is prevented by the proton capture nucleosynthesis at which carbon nuclei are exposed in the external envelope.
Stars of initial mass below do not experience any HBB; their surface chemical composition is altered only by the third dredge up (TDU) phenomenon (Iben & Renzini, 1983). The TDU is characterised by the inward penetration of the base of the convective envelope following each TP; the external mantle may thus reach internal layers undergoing nucleosynthesis and greatly enriched in carbon. Oxygen is also expected to be enhanced in this region of the star, though at a smaller extent than carbon. Owing to repeated TDU events, which eventually lead to the condition, the stars with mass in the range become C–stars. The upper limit of this mass interval is determined by the achievement of HBB conditions, whereas stars of mass below loose the external mantle before becoming C–stars. The surface carbon enrichment increases with the mass of the star, because models of higher mass experience more TPs (thus, more TDU events) before the envelope is entirely lost. Note that the upper limit in mass for the achievement of the C–star stage is dependent on the convection modelling. The value given above is found when the FST description is adopted. Other investigators, using the MLT approach (Karakas & Lattanzio, 2014; Marigo et al., 2013) find a wider range in mass for carbon stars. Unfortunately, the present study cannot be used to discriminate among the different descriptions, because the relative number of C-stars expected (see Section 5 and Fig. 2), if any, is significantly smaller than lower-mass counterparts to allow any statistics of the distribution of stars along the C-star sequence.
4.2 The effects of metallicity
The metallicity of the stars has a significant impact on the results obtained; this is because the efficiency of the mechanisms potentially able to alter the surface chemical composition, namely TDU and HBB, changes with the metallicity. An additional reason is that the core mass vs. initial mass relationship becomes steeper when the metallicity decreases333In the low-mass () domain, the differences are due to the higher efficiency of the H-burning shell in lower metallicity stars, when evolving along the RGB; this makes the core to grow faster, thus to higher core mass in the following phases. For models, the core masses of lower metallicity stars are larger, because they experience a more penetrating second dredge-up..
On the physical side, because lower metallicity stars evolve on more massive cores, the upper limit (in mass) of the stars experiencing the AGB evolution and thus avoiding core collapse, changes from for stars to for . The lower limit for the ignition of HBB also increases with Z: it changes from in the case to for .
The surface chemistry of the stars experiencing HBB is significantly affected by the metallicity because lower–Z stars are exposed to a more advanced nucleosynthesis at the base of the envelope. This particularly affects the oxygen content, which is destroyed more easily in lower metallicity models (e.g., see Fig. 3 in Ventura et al., 2013).
In the low–mass star domain the main effect of metallicity is on the lowest mass of the stars eventually reaching the C–star stage: in the case all stars of mass above become C–stars, whereas for this lower limit is . The reason for this trend with metallicity is twofold: a) stars of lower Z achieve more easily the C–star stage, because the initial oxygen is smaller; b) the efficiency of TDU is higher in models of lower metallicity (Boothroyd & Sackmann, 1988).
4.3 Dust production in AGB stars
The winds of AGB stars prove an extremely favourable environment to dust formation, because they are extremely cool and sufficiently dense to allow condensation of a large number of gas molecules into dust (Ferrarotti & Gail, 2001, 2002, 2006).
The dust production by the AGB models used in the present analysis are extensively discussed in Ventura et al. (2012a, b), Dell’Agli et al. (2014b), and Di Criscienzo et al. (2013). An overall view of the results for various masses and metallicities is presented in Ventura et al. (2014a). Here we provide a short summary of the main findings of those works, most relevant for the present investigation.
The threshold mass of for the activation of HBB also plays an important role in the type of dust produced: this is because the dust formed depends on the atmospheric C/O ratio, with carbon-rich stars producing carbonaceous dust () and oxygen–rich AGB stars () forming silicates444Note that we derived self-consistently the relative percentages of iron-poor/iron-rich silicates formed (see eq. 8 and 9 in Ventura et al., 2014a). In all the cases of interest here we find that silicates produced are iron-poor. and alumina dust (Ventura et al., 2012a).
In the latter case, the amount of silicates and alumina dust formed is approximately proportional to the metallicity, because the abundance of silicon and aluminium scales almost linearly with Z. The same holds for the SiC formed in the lower mass counterparts, which is also dependent on the silicon available in the envelope. Conversely, the solid carbon formed is at first approximation independent of Z, because the carbon transported to the surface via TDU is formed in situ.
In the higher mass domain, the quantity of dust formed increases with the initial mass of the star, because the density of the wind generally increases with mass, at least for the stars experiencing HBB. In lower mass stars the amount of carbon dust formed increases with the initial mass, as the carbon accumulated to the surface is larger in higher mass models (see Fig. 9 and 10 in Ventura et al., 2014a).
4.4 The infrared properties of AGB stars
The degree of obscuration of AGB stars depends on the type and quantity of dust formed in the circumstellar envelope. Dust particles reprocess the radiation emitted by the central star to the IR, thus shifting the peak of the spectral energy distribution to longer wavelengths.
In stars experiencing HBB, the degree of obscuration increases during the initial part of the TP–AGB evolution, because the growth of the core mass leads to stronger HBB conditions, higher mass–loss rates, and higher density winds, resulting in higher rates of silicate and alumina dust grain growth (see Fig. 2 in Dell’Agli et al., 2015b). The largest optical depths (of order unity) are reached in conjunction with the phase when HBB is strongest, before the gradual loss of the envelope provokes a general cooling of the whole external region of the star. The fraction of the TP–AGB evolution during which a star is obscured depends on the mass and metallicity. Massive AGB stars, with mass above , experience strong HBB at the first TPs, thus evolving with a large degree of obscuration for the majority of the TP–AGB phase. Conversely, stars of smaller mass () experience an initial TP–AGB evolution with scarce amount of dust in their wind; the fraction of TP–AGB life during which they are obscured is below . The metallicity trend is therefore straightforward: because higher–Z, massive TP–AGB stars produce more dust, the fraction of the TP–AGB life when the stars are obscured is larger in higher–Z objects.
Stars of mass below evolve initially with no dust, as formation of silicates in the phases previous to the achievement of the C–star phase is negligible. increases significantly at the beginning of the C–star phase, and becomes larger as more carbon is accumulated to the surface. This phase is longer at lower metallicity, where the condition is reached more easily (see Fig. 2 in Dell’Agli et al., 2015b). Because more massive stars accumulate more carbon, the stars of initial mass around are those reaching the largest degree of obscuration ().
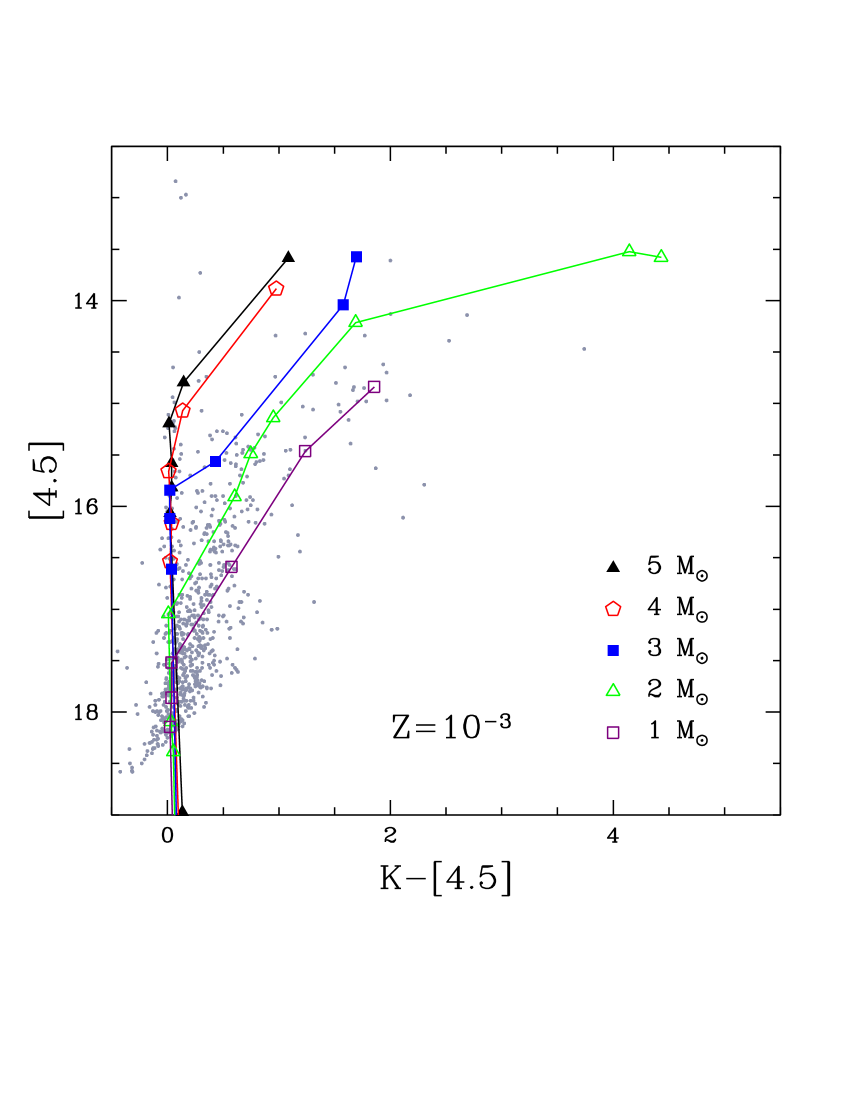
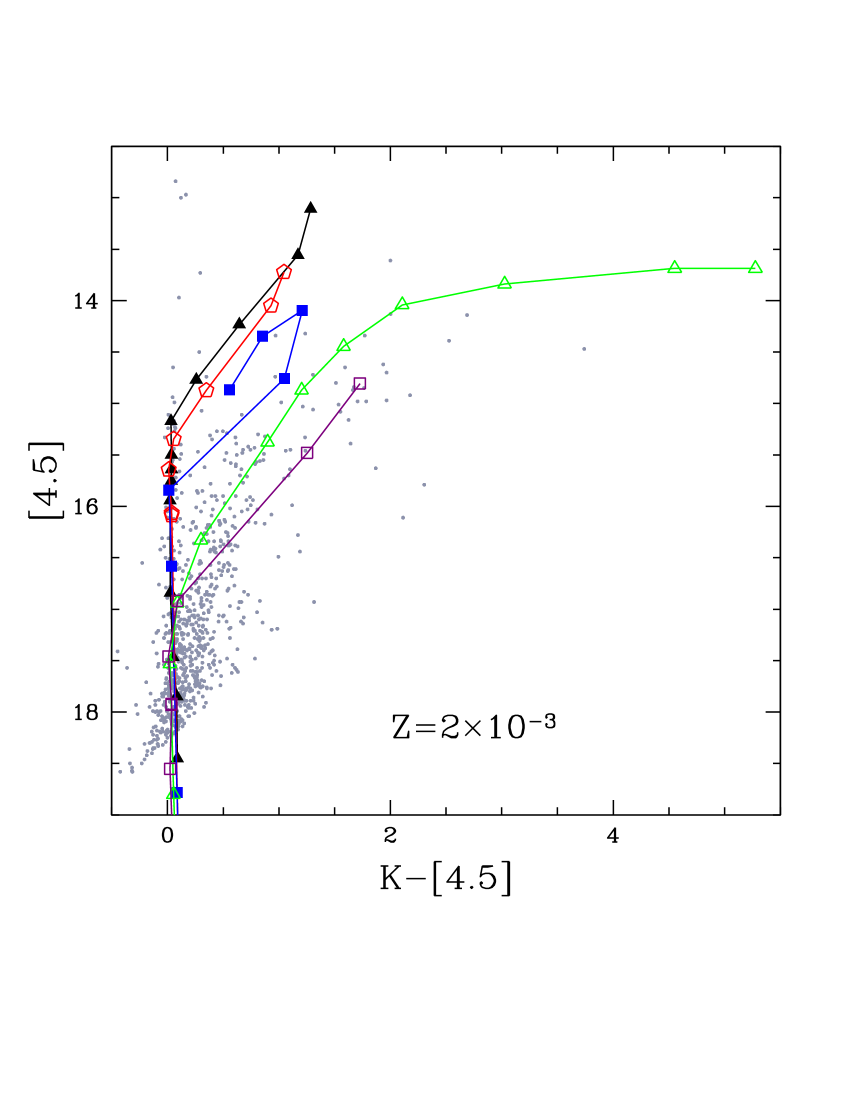
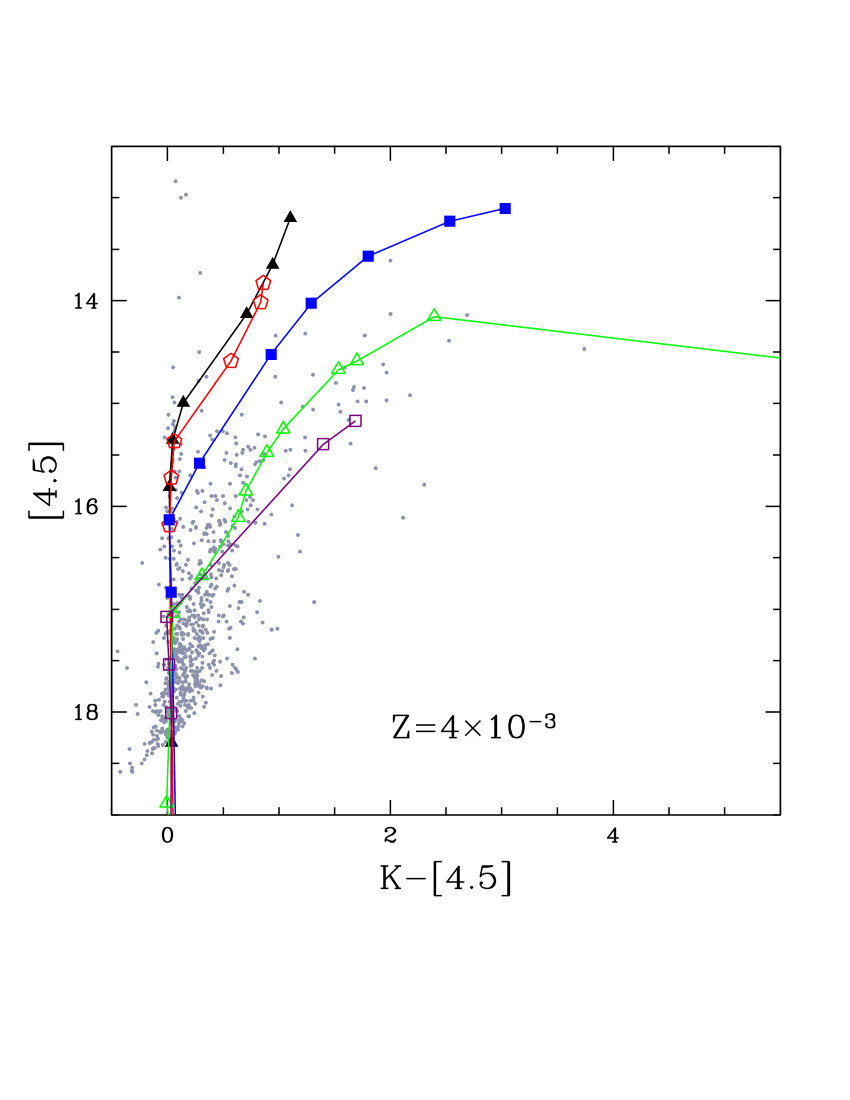
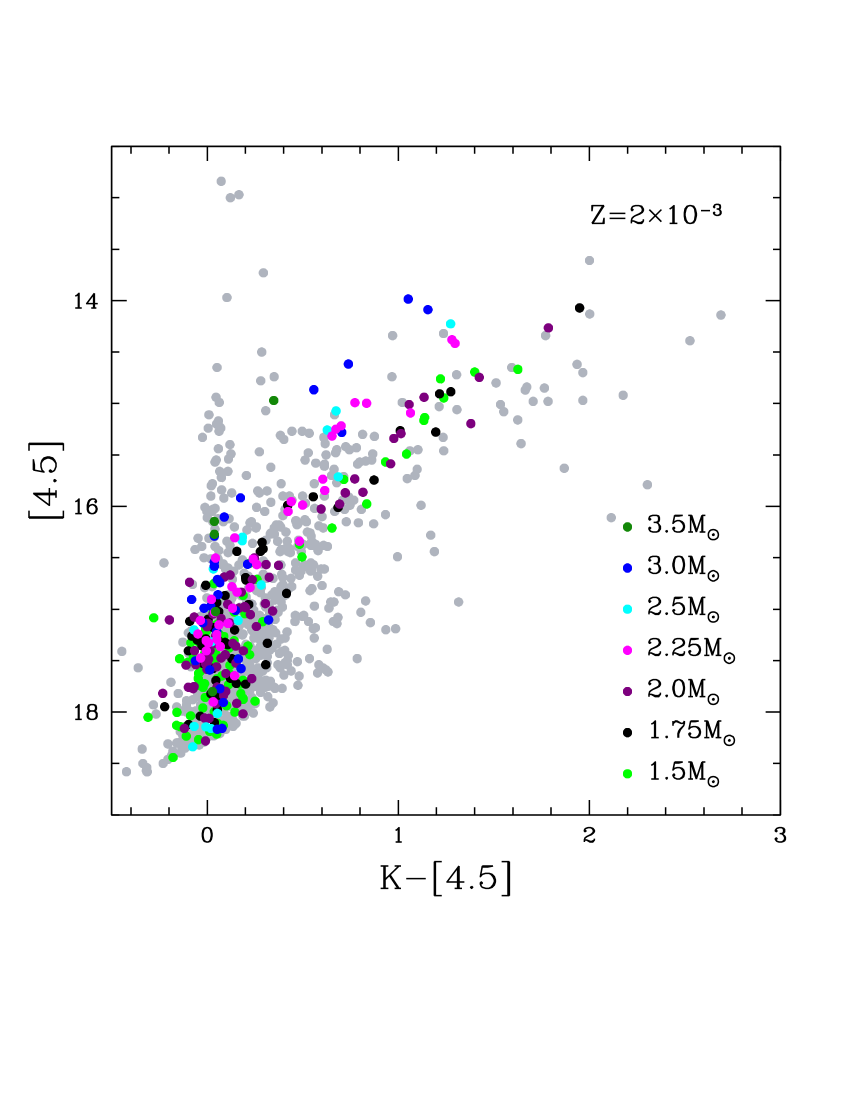
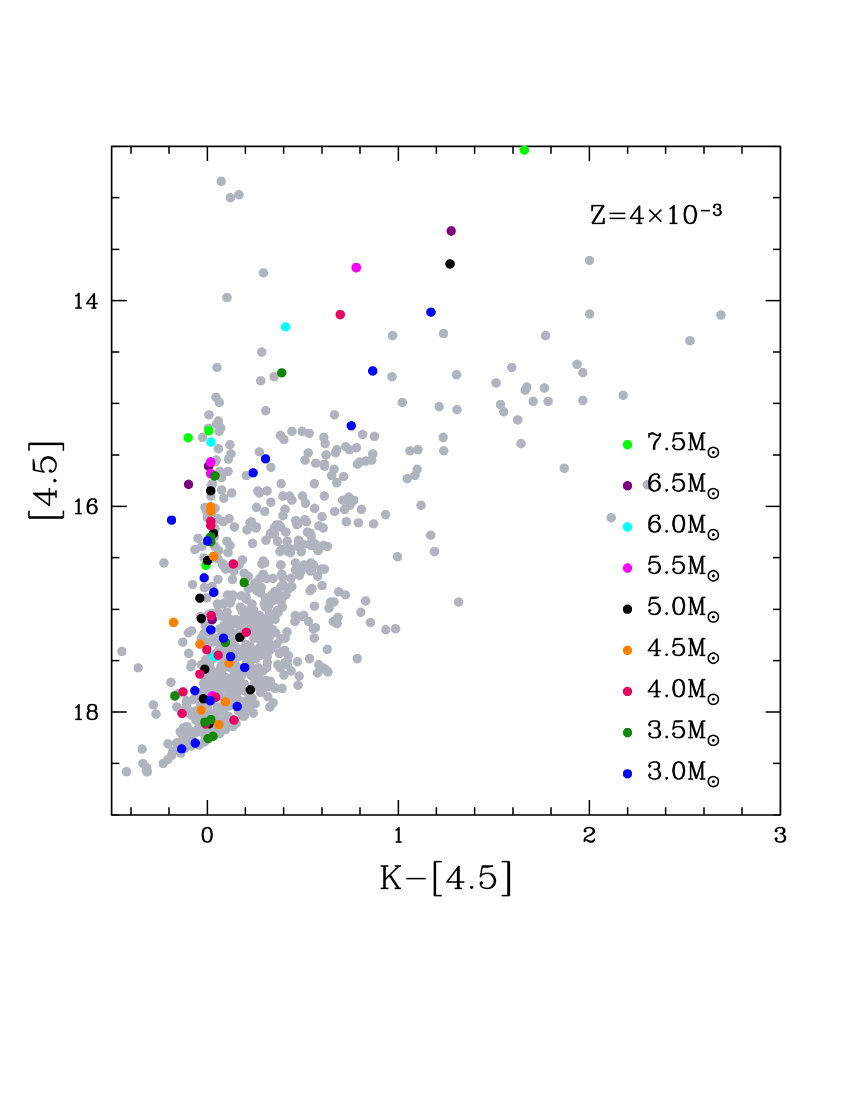
Fig. 1 shows the path traced by the evolutionary tracks of AGB models of various mass and metallicity in the color–magnitude diagram (CMD; ). The three panels refer to the metallicities and show the tracks of low–mass stars experiencing TDU and higher mass objects, whose external mantle is exposed to HBB. All the tracks move vertically in the initial early- and TP–AGB phases, because little dust forms and the degree of obscuration is small. The luminosity of the stars, hence the flux, increases as the core mass grows.
The tracks of stars of initial mass below keep vertical for the whole AGB phase, because they never become carbon stars, and the amount of silicates produced during their evolution is too small to allow a significant degree of obscuration.
The stars of mass in the range 1–3 , as discussed previously, evolve initially as oxygen–rich objects, then become C–stars once the C/O ratio exceeds unity. After the C–star stage is reached, carbon dust forms and the tracks moves rightwards in the CMD. The colour becomes redder as the stars evolve through the TP–AGB, due to the progressive carbon enrichment of the surface layers, in turn favoured by repeated TDU events. This is the case for stars, which accumulate the largest amount of carbon in the external regions, favoring the highest dust production. At a first approximation this mechanism occurs independently from . The increase in the m flux is associated to the progressive shift of the SED to longer wavelengths, while the overall luminosity of the star keeps approximately constant in the latest TP–AGB phases. We stress here that the evolutionary times become progressively shorter as the degree of obscuration (hence, the colour) increases because the presence of carbonaceous dust, owing to the effects of radiation pressure acting on dust grains, favours the increase in the mass-loss rate.
For stars of initial mass above , the mass-loss rate in the initial TP–AGB phase is not sufficient to form the amount of dust necessary to provoke a significant degree of obscuration, thus the tracks move vertically in the CMD. In more advanced phases, the tracks move rightwards as dust forms. Unlike their lower mass counterparts, in this case the colours reach a maximum during the phase of strongest HBB and decreases afterwards555For clarity, in Fig.1 we shown only the evolution until the maximum colours reached by the star.
5 The AGB population in IC 1613
To characterise the AGB population of IC 1613, we used the evolutionary sequences described in Section 4.4 to produce a synthetic distribution of the AGB population. Our analysis is based essentially on the colour–magnitude diagram; this choice is motivated by the clear separation of O– and C–rich stars in this plane. Additionally, reliable magnitudes are available even for the stars with a large degree of obscuration, thus rendering use of the fluxes more reliable than the band. Following the procedure described in Dell’Agli et al. (2015a, b), the number of stars extracted for each mass and metallicity depends on the SFR (from Skillman et al., 2014) and the initial mass function (IMF, here we used a Salpeter law, with ) at the epoch of star formation and on the overall duration of the AGB phase.We consider the photometric uncertainties (Sibbons et al., 2015; Boyer et al., 2015a) in the calculation of the predicted AGB colors and magnitudes.
Concerning the metallicity distribution, based on the results by Skillman et al. (2014), we assumed that the stars older than 4 Gyr formed with . Similarly, we use for ages in the range 0.5–4 Gyrs and in the most recent epochs666According to Skillman et al. (2014), the metallicity of stars older than Gyr should be smaller than , which would require use of models of . However, as shown by Di Criscienzo et al. (2013), the main evolution and dust production properties of low–mass, low–metallicity objects is not significantly sensitive on . Therefore, we may safely assume a minimum metallicity of in the present analysis..
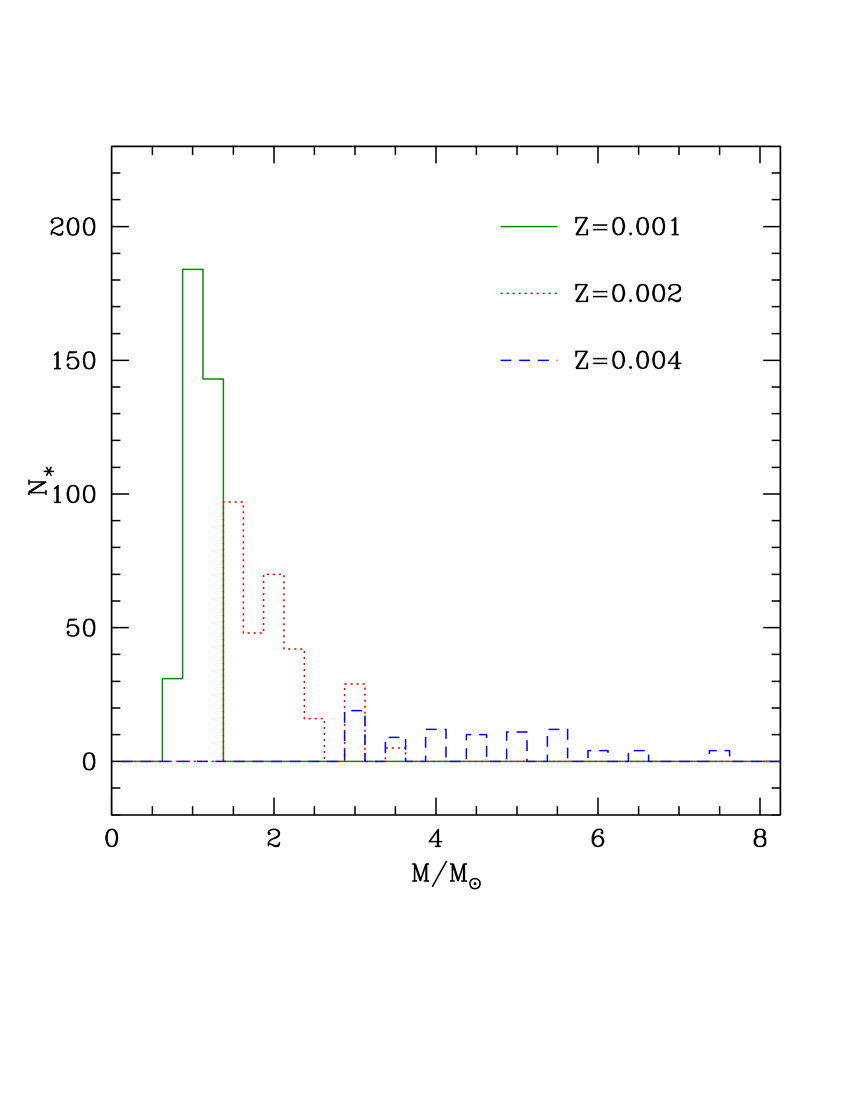
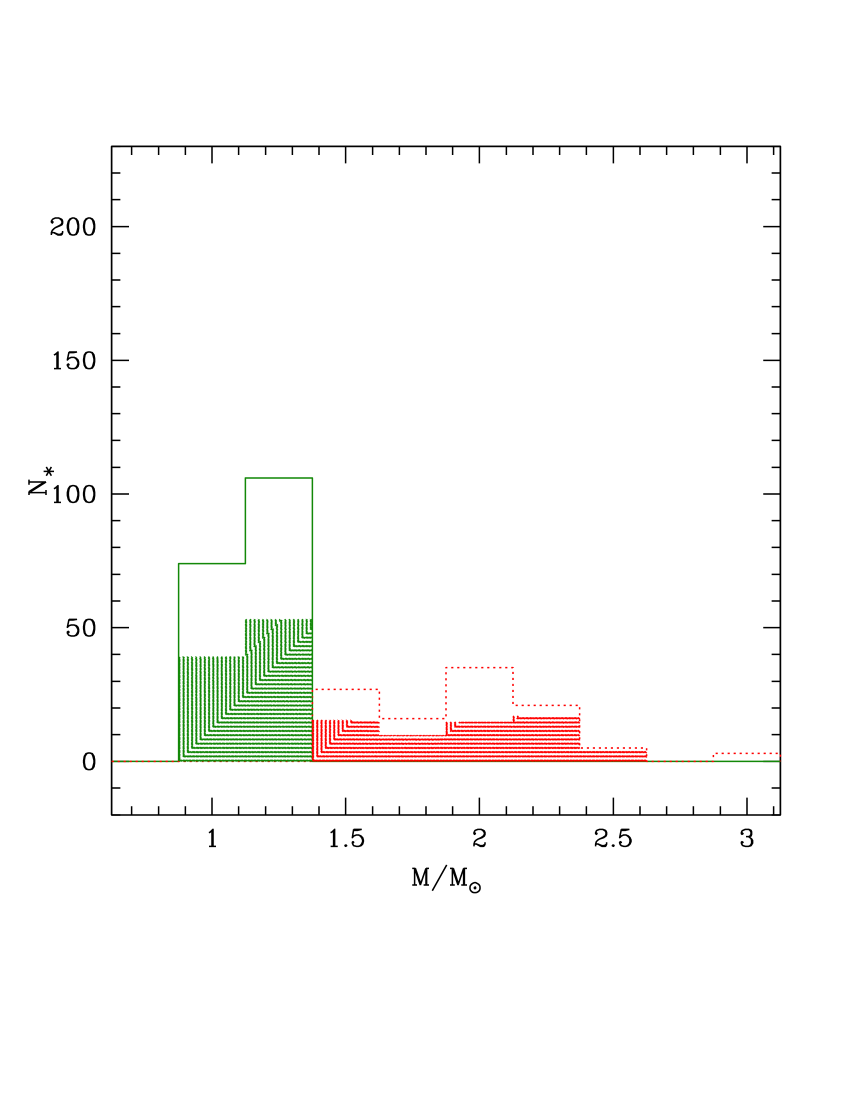
The left panel of Fig. 2 shows the distribution of the stars extracted, as a function of the initial mass and metallicity. For consistency with the analysis by Sibbons et al. (2015), only the synthetic stars with mag are shown. Approximately half of the stars belong to the component, and their mass distribution peaks around , corresponding to stars formed Gyr ago. A significant fraction () is from stars with and mass in the range , formed between 800 Myr and 1.8 Gyr ago. The theoretical population is completed () by higher metallicity () objects, with masses uniformly distributed in the range 3–5.5, formed between 70 and 300 Myrs ago. We also predict few objects of mass , accounting for a negligible fraction of the total population.
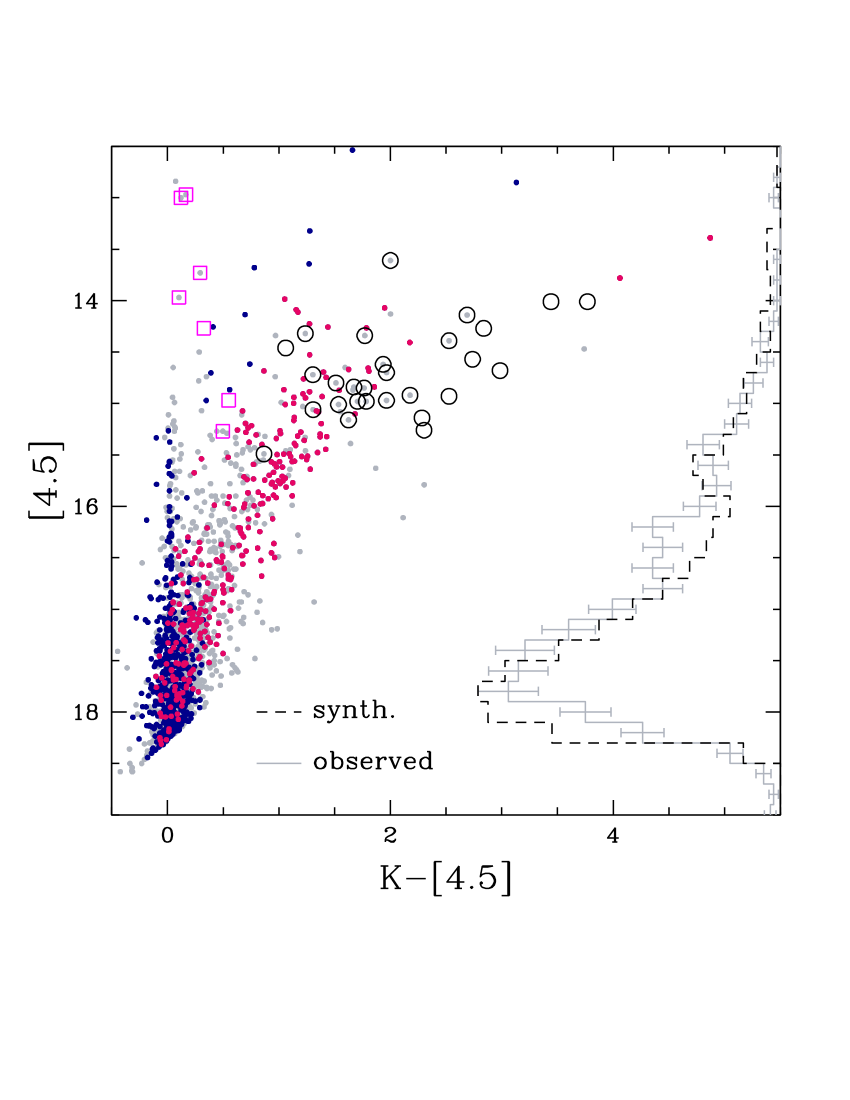
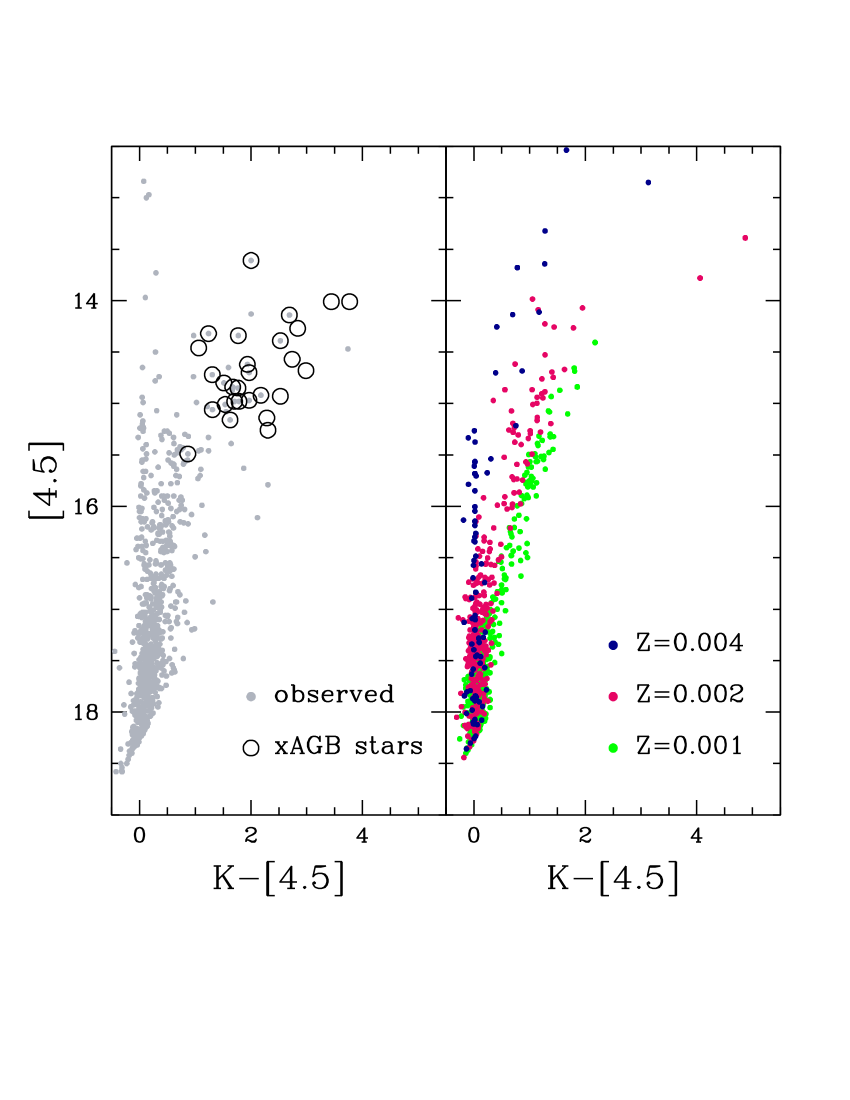
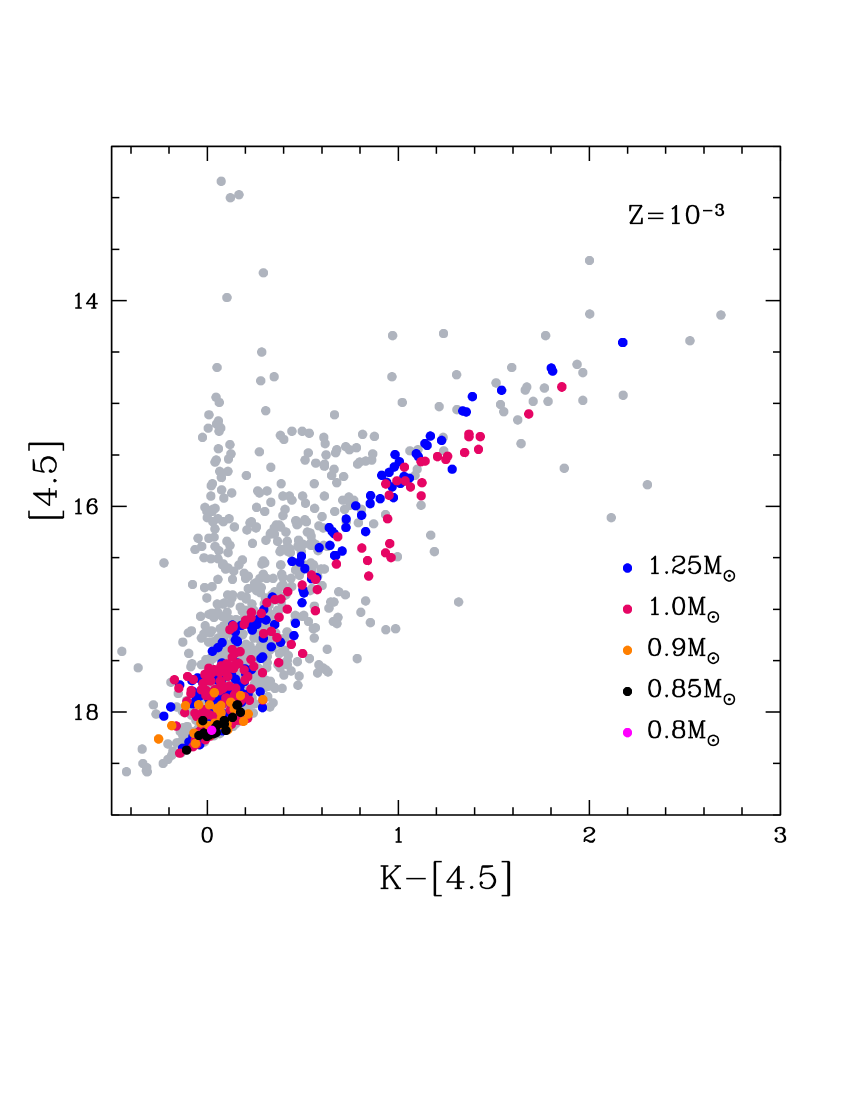
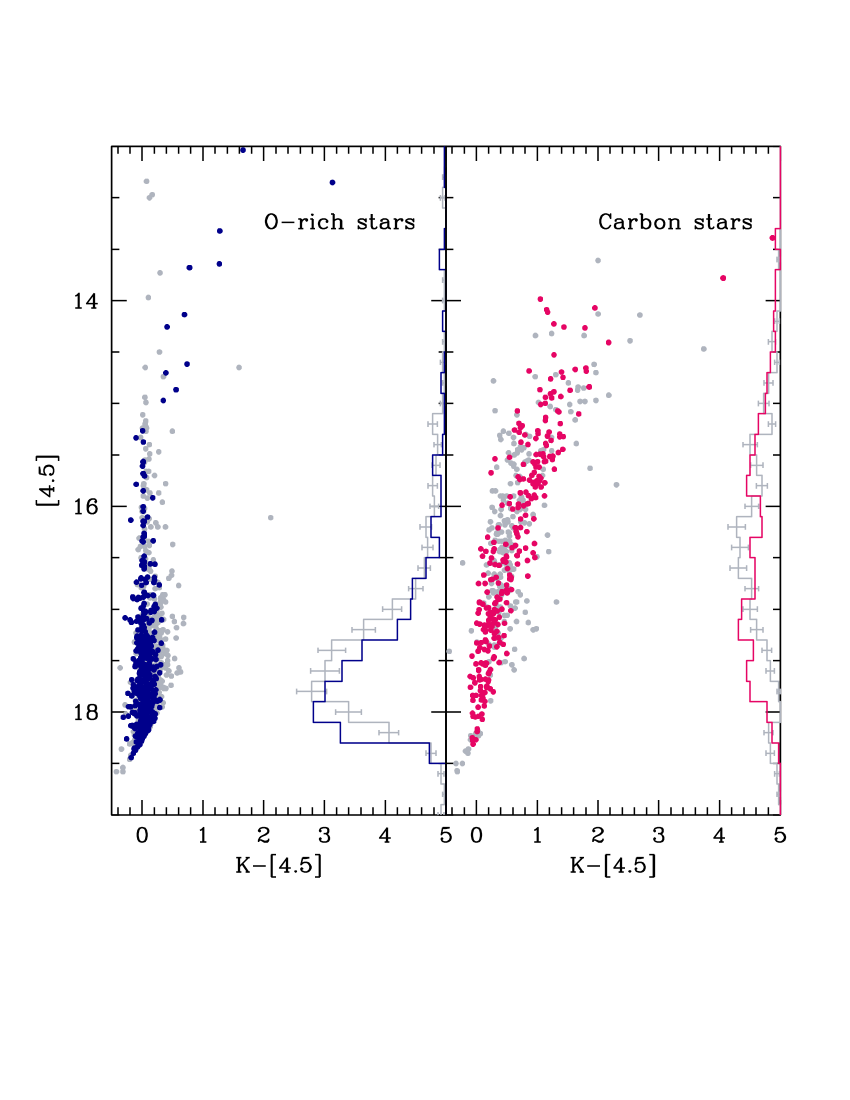
Fig. 3 shows the comparison between the observed (grey points) and expected distribution of AGB stars in IC 1613, in the CMD. The synthetic population in the left panel is split among stars with a surface ratio (blue points) and C–stars (red points). In the right panel the synthetic sample is divided among the three metallicities used in the present analysis. The three panels of Fig. 4 show the comparison between the observations and the synthetic population in the CMD, for each of the three metallicities considered; the extracted points are colour–coded according to the mass of the progenitor. Fig. 5 shows the comparison between the C– and O–rich samples classified by Sibbons et al. (2015) and the synthetic AGB population. We now discuss separately our interpretation of the different groups of stars present in the observed sample.
5.1 Oxygen–rich stars
According to our analysis, oxygen–rich stars constitute the majority () of the AGB sample of IC 1613. 85% of the oxygen–rich AGB stars descend from low–mass stars, with initial masses . These stars are evolving through the early– and initial TP–AGB phases, before reaching the C–star stage. In the CMD, these objects populate the bluer region, with and mag. The circumstellar envelope of these stars is essentially dust–free. Based on the results shown in Fig. 4, we deduce that the blue, low–luminosity region in the CMD is mainly populated by metal-poor objects (), with masses . The reason why these objects are the dominant population of the O–rich sample is twofold: a) lower mass stars () make only 13% of the oxygen–rich AGB stars because they are expected to evolve at magnitudes above the cut only in the very final thermal pulses, thus for a limited fraction of their AGB phase; b) higher mass () objects evolve above the threshold magnitude since the early–AGB; however, the number of these stars in the O–rich phase is smaller than their lower mass counterparts because any realistic mass function peaks towards lower masses and, more important, stars evolve as C–stars for a significant fraction () of their TP–AGB life.
From Fig.4 and 5, we note that 15% of the stars populating the bottom–left region of the CMD with colours mag and mag, have just reached the C–star stage; the small carbon excess with respect to oxygen is the reason for the low degree of obscuration and their relatively blue colours.
More massive stars () account only for of the O–AGB population in IC 1613. Though small in number, these stars can be easily identified, because they are the only objects that evolve to magnitudes brighter than mag, at mag. This is clearly shown in Fig. 1, showing that the evolutionary tracks of models of mass above in the initial TP–AGB phases reproduce the vertical finger in the CMD at mag, extending to mag. In more advanced phases, the ignition of HBB and the consequent increase in the mass-loss rate favour the production of large quantities of silicates (Ventura et al., 2014a), with the gradual shift of the spectral energy distribution towards longer wavelengths and redder colours. During this phase with efficient HBB these massive TP–AGB stars are surrounded by silicates grains, with typical dimension and optical depth . These stars formed in recent epochs ( Myrs ago) and, according to the AMR by Skillman et al. (2014), they belong to the most metal–rich component, namely . The relatively low number of these objects stems from the small values of the IMF in this range of masses and the short duration of their AGB phase. We note that in order to reproduce the magnitude distribution of the stars in the vertical finger of the CMD, it was necessary to increase the SFR by Skillman et al. (2014) by a factor of 2 in the epochs between 100 Myr and 500 Myr ago.This step was necessary to increase by the number of stars of mass , which populate the finger. This assumption would be relaxed by taking into account the partial contamination777Note that foreground contamination has already been taken into account and it is negligible (1%, Section 2). from red super giant (RSG) stars, expected to populate the brightest region of the CMD. In particular, the stars identified by Menzies et al. (2015) as RSG, on the basis of their small variability (open squares in Fig. 3), populate the region mag and mag. of the RSG stars contamination is difficult (out of the scope of this paper) due to the poor resolution of the SFR in the most recent epochs ( Myrs).
The left panel of Fig. 5 outlines a nice agreement between the expected distribution of oxygen–rich stars in the CMD and the sources classified as O–rich by Sibbons et al. (2015) (see Sect. 2). Some differences appear for the brightest [4.5] magnitudes. Three, very bright stars, classified as oxygen–rich AGB stars by Sibbons et al. (2015), populate the region of the CMD , not covered by any of the evolutionary tracks shown in Fig.1. Such a large magnitudes are indeed reached by massive TP–AGB stars (), when the HBB experienced is strong. However, during these phases silicate dust is formed in significant quantities (Ventura et al., 2014a), thus producing a large IR emission. The evolutionary tracks (see Fig. 1) then move to colours mag, significantly redder than the values observed. For this reason we rule out that these are AGB stars, rather we suggest that they belong to the RSG sample of IC 1613. This result is in agreement with results from the literature. Two out of the three bright stars (J010501.65+020839.2 and J010458.36+020908.4) were classified as super giants by Menzies et al. (2015), as shown in Fig. 3. In the left panel of Fig. 5, we also note that the observed O-rich sequence extends a bit redwards than our synthetic distribution, at colours . This is partly due to the criterion adopted to divide the C-rich and the O-rich stars in IC1613. An additional motivation could be that the distribution of the stars in this region of the CMD is extremely sensitive to the details of the description of the transition from the O-rich to the C-star phase, which is affected by some degree of uncertainty.
In the right panel of Fig.3 we see that the region of the CMD , where almost the entire oxygen–rich AGB population of IC 1613 is located, harbours stars with different metallicities. In particular, the [4.5] magnitude can be partly used as a metallicity discriminator: while the mag region is populated by O–rich AGB stars of any metallicity, only objects evolve to magnitudes mag mag, while the mag zone is populated exclusively by AGB stars. This is a natural consequence of the AMR by Skillman et al. (2014), according to which only stars formed in the last 500 Myr, thus implying that only the most metal–rich (), AGB stars descend from most massive () objects.
5.2 Carbon stars
The region of the CMD with colours mag is populated only by stars that have reached the carbon star stage888A few, very bright, oxygen–rich stars are also present in this region of the diagram.; this is clearly shown in the distribution of C–stars, shown in the left panel of Fig. 3. The C–star sequence defines a diagonal band, crossing the CMD from the region mag to the reddest objects, with . A few stars are found with mag. Following the analysis by Dell’Agli et al. (2014a), we identify this diagonal band as an obscuration sequence, in turn related to the amount of carbon accumulated in the surface layers by repeated TDU episodes. In the phases immediately following the achievement of the C–star stage, stars produce a negligible quantity of dust ( below ). In these early phases, the C–star population partly overlaps with the O–rich AGB stars in the CMD, as shown in Fig. 3. In the subsequent evolutionary phases, more and more carbon is accumulated to the external regions of the star, which favors the formation of considerable quantities of dust, and the evolutionary tracks gradually move redwards.
According to our analysis, the C–stars in IC 1613 descend from stars with initial mass in the range , corresponding to ages from 300Myr to 5.5 Gyr. The majority of these objects (see the histogram shown in the right panel of Fig. 2 and the left panel of Fig. 4) are the progeny of 1.25 stars with metallicity , formed 2.5 Gyr ago. A significant contribution () to the C–star sample is provided by stars of initial mass and metallicity . Both components populate the region of the diagram at mag as shown by the filled histogram in the right panel of Fig. 2.
According to the recent analysis by Ventura et al. (2016), the redwards extension of the C–star sequence in the CMD, built with the IR bands, is a valuable indicator of the progenitors of the stars belonging to the observed sample, of the carbon accumulated in the external stellar regions, and of the rate at which mass loss occurs. The analysis by Ventura et al. (2016) must be considered on a qualitative grounds, as it does not account for binarity, which might potentially increase the mass loss rate substantially, via non-spherical mass loss. However, as we will clarify in the following, a similar, tight correlation between the degree of obscuration (hence, the colour) and the parameters given above, cannot be applied in this case. In the case of IC 1613, the right panel of Fig. 3 and the left and middle panels of Fig. 4 show that both stars of initial mass and their counterparts, with initial mass , populate the region of the CMD at mag. In the MCs, Ventura et al. (2016) identified a unique class of progenitors for stars in the reddest side of the C–star sequence, but here we find a miscellaneous distribution of masses and chemical compositions. The reason for this is that the SFH of IC 1613 is rather constant (Skillman et al., 2014), whereas the SFH of the MCs present peaks of intense star formation (Harris & Zaritsky, 2009), during which the formation of the stars currently populating the red side of the C–star sequence occurred (Ventura et al., 2016).
In the analysis of the C–stars populating the reddest regions of the CMD, we note that objects with that have the reddest colours are those evolving through the very final TP–AGB phase, when the envelope is about to be entirely lost. This is deduced by comparing the terminal point of the track, in the left panel of Fig 1, with position of the stars in the CMD at mag. Conversely, for the C–star population of higher mass and metallicity, our models predict that the very final TP–AGB phases are at much redder colours than the AGB stars considered in the CMD999The presence of extremely obscured stars, not detected in the K band, can not be neglected. (Fig.1). This difference is motivated by the greater amounts of carbon accumulated at the surface of these objects compared to their counterparts of lower mass, which favour a significant increase in the mass–loss rate thus provoking a considerable shortening of the evolutionary time–scale. It is interesting to note that, owing to the larger initial masses involved, the stars evolve to brighter magnitudes, compared to the objects (see right panel of Fig. 3). Our models predict that the stars on the reddest side of the C–star sequence are surrounded by carbonaceous particles, of size , with optical depth . Smaller dust grains () of SiC are also expected to be present in the circumstellar envelope of this group of stars. In summary, owing to the combination of the SFH and the AMR, which make the mass distribution to peak at low-metallicity, stars (see Fig. 2), we find that the majority of the most obscured AGB stars, giving the largest contribution to dust production in IC1613, belongs to the lower-metallicity stellar component, with .
There is nice agreement between the objects classified as C–stars by Sibbons et al. (2015) and the stars with in the simulated population. This can be seen in the right panel of Fig. 5, which shows that the color-magnitude distribution of the observed sample is reproduced by the models. Only in the lowest part of the diagram do we find a mismatch between the two samples, where a selection effect limits the number of C stars identified photometrically.
The histogram shown in the left panel of Fig. 3 outlines a slight mismatch between the expected and observed number of stars in the magnitude range mag mag. According to our modelling, only a small number of AGB stars should be present in that region of the CMD, thus suggesting a too-fast evolution through that magnitude interval. That part of the CMD is populated by objects that have just achieved the C–star stage. The small number of predicted stars is triggered by the sudden shift of the SED to longer wavelengths as the C–star phase begins, which in turn, is motivated by an efficient dust production mechanism. This suggests the need for more detailed treatment of dust formation in the cases when the radiation pressure is not highly efficient in accelerating the wind. This is not surprising, considering that these are the only situations where the results obtained are significantly dependent on the adopted boundary conditions, particularly the velocity () with which the wind enters the condensation region. We confirmed this by changing from 1km/s to 2 km/s, which leads to a slower evolution through that region of the CMD with mag. Note that this assumption has a negligible effect on stars populating reddest region of the diagram, where the dust production sufficiently accelerates the wind, eliminating any dependency on the initial velocity. This choice leads to a much better agreement between the observations and the expected distribution of stars.
5.3 xAGB stars
Recent studies of the MCs outlined the presence of extremely red objects, with mag; spectroscopic analysis showed that these AGB stars are mainly carbon stars (Woods et al. 2011, Boyer et al. 2015c, Dell’Agli et al. 2015a,b).
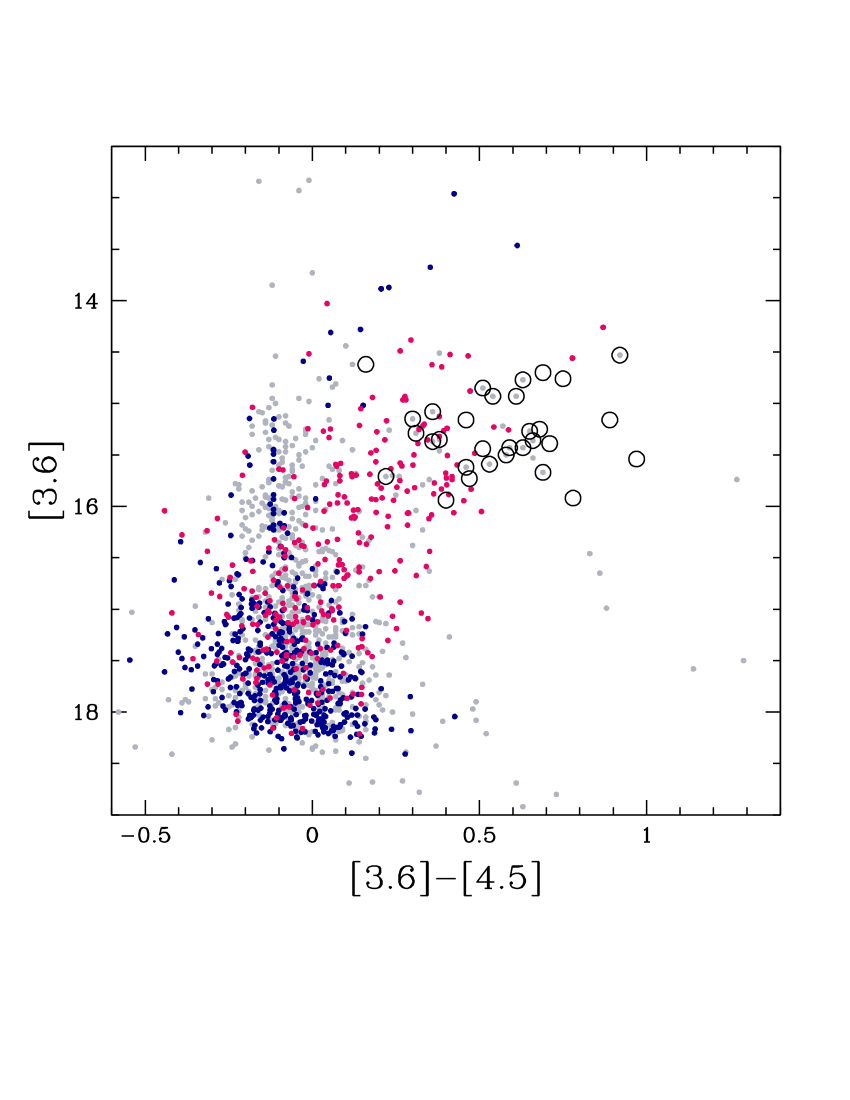
Blum et al. (2006) classified these objects as “extreme–AGB” (xAGB); a straight application of that classification cannot be adopted here since the -band magnitude is not available for a large fraction of AGB stars in IC 1613. For this reason, Boyer et al. (2015b) identified xAGB stars in this galaxy using both the variability index (with 2 epochs) introduced by Vijh et al. (2009) and an IR colour–magnitude classification ( mag and mag). Based on this criterion, they identified 30 xAGB stars in IC 1613, shown as open circles in Fig. 6. In the same ([3.6]-[4.5],[3.6]) diagram, we report the observed stars of our catalogue (grey points) and the results from our simulation, divided among carbon stars (red) and oxygen–rich objects (blue). The xAGB sample of IC 1613 are modeled to be the progeny of 1–1.25 stars of metallicity and objects with . These stars are currently evolving through the final TP–AGB phase, after several TDU events have determined the transition to the C–star stage. All these sources are modeled to be surrounded by carbon dust, with optical depths in the range . A tighter identification of the mass and chemical composition of the individual xAGB is not straightforward; the only exceptions are the sources located at mag, which descend from stars of metallicity .
This interpretation of the xAGB stars is also confirmed by their position in the () diagram, where they populate the carbon star sequence (see Section 5.2) up to mag. Note that the reddest xAGB stars (empty open circles with mag in Fig. 3, left panel) are not classified as AGB candidates by Sibbons et al. (2015), mainly because they are obscured and thus not detected in the J band. Therefore, we can conclude that: a) the criterion assumed by Sibbons et al. (2015) entails a probable loss of the most obscured stars; and b) the colour extension of the carbon star sequence up to mag predicted by the models is confirmed by the observations.
| age | % | [] | DPR | |||
|---|---|---|---|---|---|---|
| O–rich | ||||||
| low-mass | 0.3 - 12 Gyr | 55% | ||||
| high-mass | 40 - 200 Myr | 10% | 0.007-0.08 | |||
| C–rich | 0.3-5.5 Gyr | 35% | 0.003-0.18 |
5.4 Dust–production rate
The estimation of the dust-production rate (DPR) from AGB stars is still a matter of debate. Several observational methods are adopted, usually based on the IR excess and the estimated mass-loss rate. This was the case for the MCs, where the DPR was determined either by excess in the Spitzer 8 band (Srinivasan et al., 2009; Boyer et al., 2012) or by the colour excess (Matsuura et al., 2009, 2013). An alternative approach fit the SED of the individual objects (Riebel et al., 2012; Srinivasan et al., 2016). These kind of estimates become very difficult in other dwarf galaxies because the larger distances and the lower metallicities make the estimation more uncertain, particularly without the support of theoretical models able to describe the dust-production process in metal-poor environments. The first attempts to estimate the DPR based on the theoretical description of the dusty circumstellar envelope of AGB stars (in the MCs) were published by Zhukovska et al. (2013); Schneider et al. (2014); Dell’Agli et al. (2015a).
To reach this goal in the case of IC 1613, we followed the same approach used for the LMC (see Sect. 8 in Dell’Agli et al. (2015a) for more details): at each time step of the AGB evolution, the DPR () of the individual stars is calculated as the product of the mass–loss rate and the degree of condensation of each dust species considered. For oxygen–rich stars, we consider the percentage of gaseous silicon and aluminum condensed, respectively, to silicates and alumina dust. For carbon stars we take into account the fraction of carbon and silicon condensed into solid carbon and SiC particles.
Our predicted contribution to the total DPR of IC 1613 from each class of stars is summarized in Table 1. O–rich AGB stars contribute , with a dominant contribution from silicate dust (90%) compared to alumina dust (). The O–rich stars provide most (above ) of the DPR from stars of mass above ; although limited in number, these objects produce much higher quantities of dust than their counterparts of smaller mass. The latter are evolving through the O–rich phase previous to the formation of a carbon star, when limited dust production occurs. The carbon star contribution to the DPR is . Most of the dust formed is solid carbon, with a very modest (below ) contribution from silicon carbide; this is due to the small metallicities and the resulting scarcity of gaseous silicon in the wind. Among the various stars belonging to the C–rich group (see discussion in section 5.2), those providing most of the DPR () are the progeny of objects of metallicity ; the remaining contribution () is given by stars of initial mass . The estimate of DPR from C-stars is affected by the uncertainties on the rate of mass loss, the efficiency of the TDU (determining the carbon available in the surface regions), the details of condensation of carbon molecules and the SFH. We estimate that the overall uncertainty associated to the given DPR is below .
The C-rich population is giving the dominant contribution also to the gas pollution of IC1613. According to our analysis, the mass of carbon gas ejected by AGB stars into the ISM is , against the corresponding quantities of oxygen gas, estimated to be . This reflects the higher number of carbon stars currently loosing mass at larger rates compared to the O-rich population. However, we expect that the current C/O ratio of the ISM is lower, as our estimate is based only on the AGB winds, thus neglecting additional contributions from, e.g., the pristine gas in the ISM and the mass lost by supergiants. The gas-to-dust ratio from the AGB population is , estimated from the gas and dust mass-loss rates from the synthetic AGB population. This value is in agreement with the expectation that gas-to-dust ratios increase in lower metallicity environments (e.g., van Loon et al. 2000).
6 Conclusions
We study the population of AGB stars in the dwarf galaxy IC 1613 comparing models to the combination of near–IR photometry from Sibbons et al. (2015) and mid–IR data from the DUSTiNGS catalogue (Boyer et al., 2015a). To this aim, we follow the same approach used to investigate the evolved stars in the MCs, based on a population synthesis method; wherein the observed distribution of stars in the colour–magnitude plane is compared to the simulated population. We build the simulations with the latest generation of AGB models, which include dust formation in the circumstellar envelope. To date, this is the first study where these models are applied to a galaxy external to the MCs system. The nice agreement between the models and the observations allows an interesting characterization of the individual sources observed, with the determination of the mass, chemical composition, and progenitor formation epoch. We find that the AGB sample of IC 1613 is composed of 65% oxygen–rich objects and 35% carbon stars. The first group is dominated by a low–mass () component, accounting for 55% of the overall AGB population, formed 2–5Gyr ago, with metallicity below . These stars are evolving through the AGB phases previous to the achievement of the carbon star stage and their environment is essentially dust–free. The remaining oxygen–rich stars comprise a younger population (ages below 200 Myr) of higher metallicity () stars, descending from objects with mass above . This young population can be easily identified in the colour–magnitude () diagram, as they populate a vertical finger at mag and mag. The carbon stars in IC 1613 descend from stars in the range 1–2.5 and metallicities , formed between 300 Myr and 5.5 Gyr ago. Their IR properties are mainly determined by the amount of carbon dust in their circumstellar envelope. Similarly to the MCs, these objects trace an obscuration sequence in the CMD that extends to mag. Our models predict that the sources exhibiting the largest degree of obscuration are surrounded by solid carbon particles, with size . These stars give the dominant contribution () to the overall dust–production rate of IC 1613, predicted to be by our simulations.
The present work not only represents a major step in the understanding of the gas and dust pollution from AGB stars, but also demonstrates that these models can be used to characterise evolved stellar populations in diverse environments. These findings are timely with the upcoming instruments such as the European Extremely Large Telescope or James Webb Space Telescope, which will enormously increase the number of galaxies where AGB stars will be resolved. Analyses similar to this will provide important information about star formation histories, which are currently inferred only from integrated spectral energy distributions.
Acknowledgments
The authors are indebted to the anonymous referee for the careful reading of the manuscript and for the several comments, that help improving significantly the quality of this work. F.D.A. acknowledges support from the Observatory of Rome. M.D.C. acknowledges Adriano Fontana and the contribution of the FP7 SPACE project ASTRODEEP (Ref.No:312725) supported by the European Commission. D.A.G.H. was funded by the Ramón y Cajal fellowship number RYC201314182 and he acknowledges support provided by the Spanish Ministry of Economy and Competitiveness (MINECO) under grant AYA201458082-P..
References
- Albert et al. (2000) Albert, L., Demers, S., & Kunkel, W. E. 2000, AJ, 119, 2780
- Aringer et al. (2009) Aringer B., Girardi L., Nowotny W., Marigo P., Lederer M. T., 2009, A&A, 503, 913
- Battinelli & Demers (2009) Battinelli, P., & Demers, S. 2009, A&A, 493, 1075
- Bernard et al. (2010) Bernard, E. J., Monelli, M., Gallart, C., et al. 2010, ApJ, 712, 1259
- Blöcker (1995) Blöcker T., 1995, A&A, 297, 727
- Blöcker & Schönberner (1991) Blöcker T., Schönberner D., 1991, A&A, 244, L43
- Blum et al. (2006) Blum R. D. et al., 2006, AJ, 132, 2034
- Boothroyd & Sackmann (1988) Boothroyd A. I., Sachmann I. J., 1988, ApJ, 328, 671
- Borissova et al. (2000) Borissova, J., Georgiev, L., Kurtev, R., et al. 2000, Rev. Mex. Astron. Astrofis., 36, 151
- Boyer et al. (2009) Boyer, M. L., Skillman, E. D., van Loon, J. Th., Gehrz, R. D., & Woodward, C. E. 2009, ApJ, 697, 1993
- Boyer et al. (2012) Boyer M. L., Srinivasan S., Riebel D., McDonald I., van Loon J. Th., Clayton G. C., Gordon K. D., Meixner M., Sargent B. A., Sloan G. C., 2012, ApJ, 748, 40
- Boyer et al. (2015a) Boyer M. L., McQuinn K. B. W., Barmby P., et al. 2015a, ApJS, 216, 10
- Boyer et al. (2015b) Boyer M. L., McQuinn K. B. W., Barmby P., et al. 2015b, ApJ, 800, 17
- Boyer et al. (2015c) Boyer M. L., McDonald I., Srinivasan S., Zijlstra A., van Loon J. Th., Olsen K. A. G., Sonneborn G., 2015c, ApJ, 810, 116
- Canuto & Mazzitelli (1991) Canuto V. M. C., Mazzitelli I., 1991, ApJ, 370, 295
- Chun et al. (2015) Chun S.-H., Jung M., Kang M., Kim J.-W., Sohn Y.-J., 2015, A&A, 578, A51
- Conroy et al. (2009) Conroy C., Gunn J. E., White M. 2009, ApJ, 699, 486
- Dell’Agli et al. (2014a) Dell’Agli F., Ventura P., García-Hernández D. A., Schneider R., Di Criscienzo M., Brocato E., D’Antona F., Rossi C., 2014, MNRAS, 442, L38
- Dell’Agli et al. (2014b) Dell’Agli F., García-Hernández D. A., Rossi C., et al. 2014b, MNRAS, 441, 1115
- Dell’Agli et al. (2015a) Dell’Agli F., Ventura P., Schneider R., Di Criscienzo M., García-Hernández D. A., Rossi C., Brocato E. 2015a, MNRAS, 447, 2992
- Dell’Agli et al. (2015b) Dell’Agli F., García-Hernández D. A., Ventura P., Schneider R., Di Criscienzo M., Rossi C. 2015b, MNRAS, in press
- Di Criscienzo et al. (2013) Di Criscienzo M., Dell’Agli F., Ventura P., Schneider R., Valiante R., La Franca F., Rossi C., Gallerani S., Maiolino, R., 2013, MNRAS, 433, 313
- Dolphin et al. (2001) Dolphin, A. E., Saha, A., Skillman, E. D., et al. 2001, ApJ, 550, 554
- Ferrarotti & Gail (2001) Ferrarotti A. D., Gail H. P., 2001, A&A, 371, 133
- Ferrarotti & Gail (2002) Ferrarotti A. D., Gail H. P., 2002, A&A, 382, 256
- Ferrarotti & Gail (2006) Ferrarotti A. D., Gail H. P., 2006, A&A, 553, 576
- Gail & Sedlmayr (1985) Gail H. P., Sedlmayr E., 1985, A&A, 148, 183
- Gail & Sedlmayr (1999) Gail H. P., Sedlmayr E., 1999, A&A, 347, 594
- Girardi et al. (2010) Girardi L., Williams B. F., Gilbert K. M., et al. 2010, ApJ, 724, 1030
- Grevesse & Sauval (1998) Grevesse N., Sauval A. J, 1998, SSrv, 85, 161
- Harris & Zaritsky (2009) Harris J., Zaritsky D. 2009, ApJ, 138, 1243
- Hauschildt (1999) Hauschildt P. H., Allard F., Ferguson J., Baron E., & Alexander D. R. 1999, ApJ, 525, 871
- Herwig (2005) Herwig F. 2005, ARA&A, 43, 435
- Höfner (2008) Höfner S. 2008, A&A, 491, L1
- Herwig (2005) Herwig F., 2005, AR&A, 43, 435
- Iben & Renzini (1983) Iben I. Jr., Renzini A. 1983, ARA&A 21, 271
- Kacharov et al. (2012) Kacharov, N., Rejkuba, M., & Cioni, M.-R. L. 2012, A&A, 537, A108
- Karakas & Lattanzio (2014) Karakas A. I., Lattanzio J. C. 2014, PASA, 31, e030
- Maraston et al. (2006) Maraston C., Daddi E., Renzini A., Cimatti A., Dickinson M., Papovich C., Pasquali A., Pirzkal N. 2006, ApJ, 652, 85
- Marigo & Aringer (2009) Marigo P., Aringer B., 2009, A&A, 508, 1538
- Marigo et al. (2013) Marigo, P., Bressan, A., Nanni, A., Girardi, L., & Pumo, M. L. 2013, MNRAS, 434, 488
- Marigo et al. (2016) Marigo P., Ripamonti E., Nanni A., Bressan A., Girardi L. 2016, MNRAS, 456, 23
- Matsuura et al. (2009) Matsuura M., et al., 2009, MNRAS, 396, 918
- Matsuura et al. (2013) Matsuura M., Woods P. V., Owen P. J., 2013, MNRAS, 429, 2527
- Menzies et al. (2015) Menzies J. W., Whitelock P. A. & Feast M. W., 2015, 452, 910
- Nanni et al. (2013a) Nanni A., Bressan A., Marigo P., Girardi L., 2013a, MNRAS, 434, 488
- Nanni et al. (2013b) Nanni A., Bressan A., Marigo P., Girardi L., 2013b, MNRAS, 434, 2390
- Nanni et al. (2014) Nanni A. Bressan A. Marigo P. Girardi L., 2014, MNRAS, 438, 2328
- Nenkova et al. (1999) Nenkova M., Ivezić Ž., Elitzur M., 1999, in: LPIContributions 969, Workshop on Thermal Emission Spectroscopy and Analysis of Dust, Disks, and Regoliths, ed. A. Sprague, D. K. Lynch, & M. Sitko (Houston, TX: Lunar and Planetary Institute), 20
- Paczyński (1970) Paczyński, B. 1970, Acta Astr., 20, 47
- Pietrzyński et al. (2006) Pietrzyński, G., Gieren, W., Soszyński, I., et al. 2006, ApJ, 642, 216
- Renzini & Voli (1981) Renzini A., Voli M., 1981, A&A, 94, 175
- Riebel et al. (2012) Riebel D., Srinivasan S., Sargent B., Meixner M., 2012, AJ, 753, 71
- Romano et al. (2010) Romano D., Karakas A. I., Tosi M., Matteucci F. 2010, A&A 522, AA32
- Rosenfield et al. (2014) Rosenfield P., Marigo P., Girardi L., et al. 2014, ApJ, 790, 22
- Rosenfield et al. (2016) Rosenfield P., Marigo P., Girardi L., Dalcanton J. J., Bressan A., Williams B. F., Dolphin A, 2016, ApJ, accepted, 2016arXiv160305283R
- Schlegel et al. (1998) Schlegel, D. J., Finkbeiner, D. P., & Davis, M. 1998, ApJ, 500, 525
- Schneider et al. (2014) Schneider R., Valiante R., Ventura P., Dell’Agli F., Di Criscienzo M., Hirashita H., Kemper F., 2014, MNRAS, 442, 1440
- Sibbons et al. (2012) Sibbons L. F., Ryan S. G., Cioni M.-R. L., Irwin M., Napiwotzki R., 2012, A&A, 540, 24
- Sibbons et al. (2014) Sibbons L. F., Ryan S. Irwin M., & Napiwotzki, R. 2014, A&A, 574, 33
- Sibbons et al. (2015) Sibbons L. F., Ryan S. G., Irwin M. Napiwotzki R. 2015, A&A, 583, A84
- Skillman et al. (2014) Skillman E. D., Hidalgo S. L., Weisz D. R., Monelli M., Gallart C., Aparicio A., Bernard E. J., Boylan-Kolchin M., Cassisi S., Cole A. A., Dolphin A. E., Ferguson H. C., Mayer L., Navarro J. F., Stetson P. B., Tolstoy E., 2014, ApJ, 786, 44
- Srinivasan et al. (2009) Srinivasan S. et al., 2009, AJ, 137, 4810
- Srinivasan et al. (2016) Srinivasan S., Boyer M. L., Kemper F., Meixner M., Sargent B. A., Riebel D. et al., 2016, MNRAS, 457, 2814
- Tammann et al. (2011) Tammann, G. A., Reindl, B., & Sandage, A. 2011, A&A, 531, A134
- van Loon et al. (2000) van Loon J.Th., A&A, 354, 125
- Vassiliadis & Wood (1993) Vassiliadis E., Wood P. R. 1993, ApJ, 413, 641
- Ventura et al. (2000) Ventura P., D’Antona F., Mazzitelli I., 2000, A&A, 363, 605
- Ventura et al. (2001) Ventura P., D’Antona F., Mazzitelli I., Gratton R. 2001, ApJ, 550, L65
- Ventura & D’Antona (2005) Ventura P., D’Antona F., 2005, A&A, 431, 279
- Ventura & D’Antona (2009) Ventura P., D’Antona F., 2009, MNRAS, 499, 835
- Ventura et al. (2001) Ventura P., D’Antona F., Mazzitelli I., Gratton R. 2001, ApJL, 550, L65
- Ventura et al. (2012a) Ventura P., Di Criscienzo M., Schneider R., Carini R., Valiante R., D’Antona F., Gallerani S., Maiolino R., Tornambé A., 2012a, MNRAS, 420, 1442
- Ventura et al. (2012b) Ventura P., Di Criscienzo M., Schneider R., Carini R., Valiante R., D’Antona F., Gallerani S., Maiolino R., Tornambé A., 2012b, MNRAS, 424, 2345
- Ventura et al. (2013) Ventura P., Di Criscienzo M., Carini R., D’Antona F., 2013, MNRAS, 431, 3642
- Ventura et al. (2014a) Ventura P., Dell’Agli F., Di Criscienzo M., Schneider R., Rossi C., La Franca F., Gallerani S., Valiante R., 2014a, MNRAS, 439, 977
- Ventura et al. (2014b) Ventura, P., Di Criscienzo, M. D., D’Antona, F., et al. 2014b, MNRAS, 437, 3274
- Ventura et al. (2015) Ventura P., Karakas A. I., Dell’Agli F., Boyer M. L., García-Hernández D. A., Di Criscienzo M., Schneider R. 2015a, MNRAS, 450, 3181
- Ventura et al. (2016) Ventura P., Karakas A. I., Dell’Agli F., García-Hernández D. A., Boyer M. L.,, Di Criscienzo M. 2016, MNRAS, 457, 1456
- Ventura & Marigo (2009) Ventura P., Marigo P., 2009, MNRAS, 399, L54
- Ventura & Marigo (2010) Ventura P., Marigo P., 2010, MNRAS, 408, 2476
- Ventura et al. (1998) Ventura P., Zeppieri A., Mazzitelli I., D’Antona F., 1998, A&A, 334, 953
- Vijh et al. (2009) Vijh U. P., Meixner M., Babler B. et al., 2009, AJ, 137, 3139
- Wachter et al. (2002) Wachter A., Schröder K. P., Winters J. M., Arndt T. U., Sedlmayr E., 2002, A&A, 384, 452
- Wachter et al. (2008) Wachter A., Winters J. M., Schröder K. P., Sedlmayr E., 2008, A&A, 486, 497
- Zhukovska et al. (2008) Zhukovska S., Gail H.-P., Trieloff M., 2008, A&A, 479, 453
- Zhukovska et al. (2013) Zhukovska S., Henning T., 2013, A&A, 555, 15