Dark-ages reionization and galaxy-formation simulation – VI. The origins and fate of the highest known redshift galaxy
Abstract
Using Hubble data, including new grism spectra, Oesch et al. recently identified GN-z11, an =-21.1 galaxy at =11.1 (just 400 Myr after the big bang). With an estimated stellar mass of 109 M☉, this galaxy is surprisingly bright and massive, raising questions as to how such an extreme object could form so early in the Universe. Using Meraxes, a semi-analytic galaxy-formation model developed as part of the Dark-ages Reionization And Galaxy-formation Observables from Numerical Simulations (DRAGONS) programme, we investigate the potential formation mechanisms and eventual fate of GN-z11. The volume of our simulation is comparable to that of the discovery observations and possesses two analogue galaxies of similar luminosity to this remarkably bright system. Existing in the two most massive subhaloes at =11.1 (=1.4 M☉ and 6.7 M☉), our model analogues show excellent agreement with all available observationally derived properties of GN-z11. Although they are relatively rare outliers from the full galaxy population at high-, they are no longer the most massive or brightest systems by =5. Furthermore, we find that both objects possess relatively smooth, but extremely rapid mass growth histories with consistently high star formation rates and UV luminosities at , indicating that their brightness is not a transient, merger-driven feature. Our model results suggest that future wide-field surveys with the James Webb Space Telescope may be able to detect the progenitors of GN-z11 analogues out to 13–14, pushing the frontiers of galaxy-formation observations to the early phases of cosmic reionization and providing a valuable glimpse of the first galaxies to reionize the Universe on large scales.
keywords:
galaxies: evolution – galaxies: high-redshift – galaxies: statistics1 Introduction
Using Hubble Space Telescope (HST) Wide Field Camera 3 (WFC3) grism spectroscopy, Oesch et al. (2016) recently identified the most distant galaxy known to date (GN-z11). The spectrum, combined with photometric data from the Cosmic Assembly Near-infrared Deep Extragalactic Legacy Survey (CANDELS) survey, placed the system at =11.09, with lower redshift spectral energy distribution (SED) solutions excluded with high confidence.
At , GN-z11 is approximately three times more luminous than at =7–8, and is therefore extremely bright for such a high- object. Extrapolations of the =4–8 ultraviolet luminosity function (UV LF) suggest that such objects should be rare with fewer than 0.06 such systems expected in the total volume surveyed (1.2106 Mpc3; e.g. Bouwens et al., 2015; Finkelstein et al., 2015). LF evolution models based on hierarchical assembly (e.g. Trenti et al., 2010; Mason et al., 2015), the extrapolation of abundance matching results to higher luminosities/redshifts (e.g. Trac et al., 2015; Mashian et al., 2016), and cosmological hydrodynamic simulations such as BlueTides (Waters et al., 2016b, a), all similarly point to GN-z11 being an exceptional and rare system. This begs the question of what the formation mechanisms might be for such a galaxy, as well as what its descendants are at lower redshifts?
In this work we use the semi-analytic galaxy-formation model Meraxes (Mutch et al., 2016), developed for the Dark-ages Reionization And Galaxy-formation Observables from Numerical Simulations (DRAGONS) programme (Angel et al., 2016; Geil et al., 2016; Liu et al., 2016), in order to investigate whether galaxy-formation models of this type predict the existence of such extreme systems as GN-z11 and, if so, what their properties, origins and potential fates are. The DRAGONS parent N-body simulation (Tiamat; Poole et al., 2016) possesses a comparable volume to that of the discovery observations, yet Meraxes predicts two =11.1 galaxies of comparable UV magnitude to GN-z11, suggesting that such luminous galaxies may be a more common outcome of early galaxy formation than previously thought.
This paper is laid out as follows. In Section 2, we give a brief overview of the DRAGONS framework, including both the Tiamat N-body simulation and Meraxes semi-analytic model. In Section 3, we discuss the presence and properties of luminous GN-z11 analogues in our model galaxy population before going on to investigate the origin and fate of these objects from =5–20. In Section 5, we discuss the prospects for detecting the progenitors of GN-z11 analogues with the forthcoming James Webb Space Telescope (JWST) and provide forecasts for the maximum redshift out to which these may be observed. We close with a summary of our findings in Section 6.
2 The DRAGONS framework
The DRAGONS programme was designed specifically to study the Epoch of Reionization (EoR) and the growth of the first galaxies. It consists of two main parts: the Tiamat suite of high resolution N-body simulations, and the Meraxes semi-analytic galaxy formation model.
The main Tiamat simulation consists of a (96.9 Mpc)3 volume with enough mass resolution to resolve dark matter haloes down to approximately three times the atomic cooling mass threshold at =5. It also possesses a high temporal resolution of 11 Myr per output snapshot, allowing us to capture the stochastic nature of star formation and quenching during the EoR. Only trees constructed from the main Tiamat N-body simulation are utilized in this work. For more details, including information on the other simulations in the Tiamat suite, please see Poole et al. (2016) and Angel et al. (2016).
The Meraxes semi-analytic model runs atop the merger trees extracted from Tiamat and includes the dominant physical process thought to shape the evolution of high-redshift galaxies, including cooling, star formation, metal enrichment, satellite infall and merger events. The model also features a novel delayed supernova feedback and enrichment scheme and self-consistently incorporates the semi-numerical reionization scheme, 21CMFAST (Mesinger & Furlanetto, 2007; Mesinger et al., 2011), in order to model reionization and its effects on galaxy evolution both temporally and spatially (Geil et al., 2016). A detailed description of Meraxes and its design can be found in Mutch et al. (2016).
The fiducial Meraxes model calibration (used in this work) was constructed to reproduce the observed evolution of the galaxy stellar mass function from =5–7 (González et al., 2011; Duncan et al., 2014; Grazian et al., 2015; Song et al., 2016) and to provide a reionization history consistent with the latest Planck optical depth measurements (Planck Collaboration, 2015). The model has also been shown to accurately reproduce the evolution of the observed UV LF from =5–10 (Liu et al., 2016).
3 GN-z11 analogues in DRAGONS
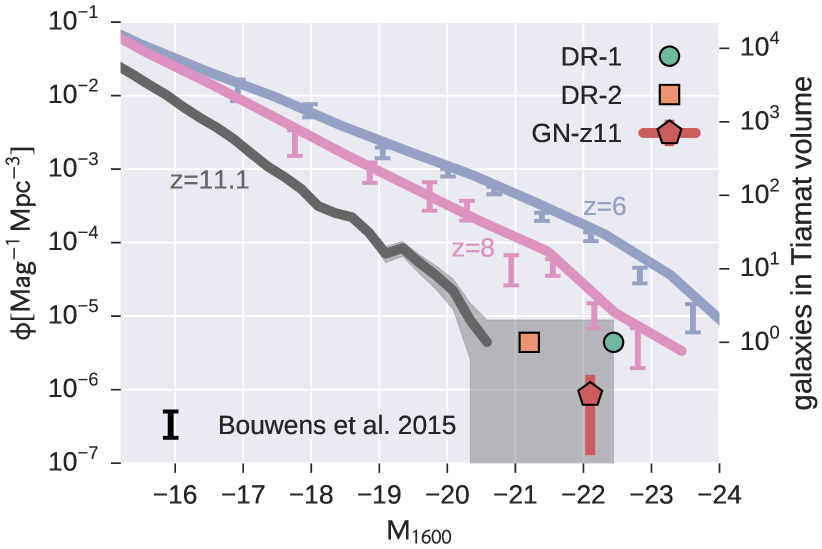
In Fig. 1 we present the bright end of the =11.1 UV LF predicted by Meraxes (grey line and with shaded Poisson uncertainties). The effects of dust extinction are not included. The orange square and green circle indicate the magnitudes of the two most UV-luminous galaxies in our model whilst the red data point indicates the observationally estimated and 1 uncertainty derived from the GN-z11 detection. As can be seen, these two most luminous Meraxes systems are comparable in luminosity to GN-z11.
| =11.1 | =5 | |||||
|---|---|---|---|---|---|---|
| GN-z11 | DR-1 | DR-2 | DR-1 | DR-2 | ||
| M☉ | ||||||
| M☉ | – | |||||
| SFR M☉ | ||||||
| [kpc] | ||||||
For reference, we also show in Fig. 1 the =6 and 8 UV LFs predicted by Meraxes as well as the observational results of Bouwens et al. (2015). The observations have been corrected for dust extinction using the inverse of the methodology described in Liu et al. (2016). The agreement between the observational data and our model results indicates that Meraxes correctly predicts both the normalization and evolution of the bright end of the UV LF at lower redshifts, giving us confidence in the =11.1 result.
Due to the limited volume of the parent Tiamat N-body simulation, the bright end of the LF is poorly constrained for number densities Mag-1Mpc-3. This precludes us from making any quantitative statements regarding the probability of detecting a galaxy as bright as GN-z11 other than to simply state that we find at least one such system in our 1106 Mpc3 volume. However, we note that this is approximately equal to the volume surveyed during the detection of GN-z11 (1.2106 Mpc3) and therefore the presence of any galaxies as bright as this observed object in our model is significant. Given the success of Meraxes in reproducing the evolution of the galaxy stellar mass functions (Mutch et al., 2016) and observed UV LFs (Liu et al., 2016) at =5–8, the presence of any systems as luminous as GN-z11 in our model is remarkable, opening up the possibility that such galaxies may not be as rare as extrapolations of the observed 4–8 LFs to higher redshifts may suggest (see Oesch et al., 2016, and references therein).
Having established that galaxies as UV-luminous as GN-z11 exist in the output
of DRAGONS, we selected the two brightest UV magnitude galaxies at redshift
=11.1 for detailed study. The properties of these
objects,111The model galaxy half-light radii are
calculated from the disc scale radius, , using
for an axisymmetric exponential
disc profile, where is derived from the spin of the host dark
matter subhalo under the assumption of specific angular momentum conservation
(Fall &
Efstathiou, 1980; Mo
et al., 1998; Mutch et al., 2016).
hence forth referred to as DR-1
and DR-2, show good agreement with the best observational measurements of
GN-z11 (Oesch
et al., 2016), as can be seen in Table 1. This
suggests that we can use these model galaxies as analogues with which to
investigate the potential formation, evolution and fate of GN-z11.
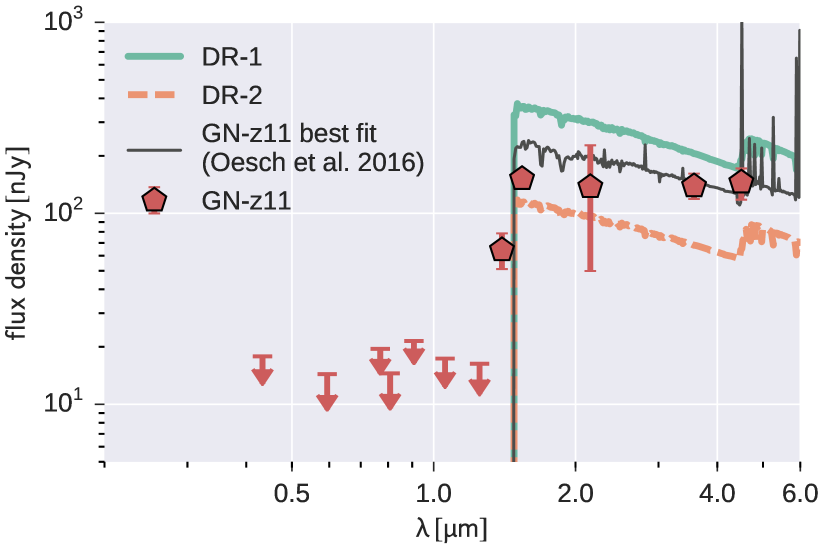
As well as those properties listed in Table 1, DR-1 and DR-2 also possess similar SEDs to GN-z11. In Fig. 2 we plot the observed frame SEDs of DR-1 (green) and DR-2 (orange) in terms of their flux density between 0.2 and 6 m. The red data points show the GN-z11 HST photometric measurements and upper limits, whilst the black thin line indicates the best-fitting SED presented in Oesch et al. (2016). Lyman- absorption has been included in the model spectra and is manifested as the sharp drop in flux at m; however, no dust extinction model has been applied. For more details on the methodology used to construct the model SEDs, see Liu et al. (2016). Both analogue galaxies possess spectra and UV slopes () in close agreement with the GN-z11 observations, supporting the claim that this observed system is relatively dust free (Oesch et al., 2016). The normalization of both model spectra further show reasonable agreement with GN-z11 photometric measurements due to their comparable UV luminosities (cf. Table 1).
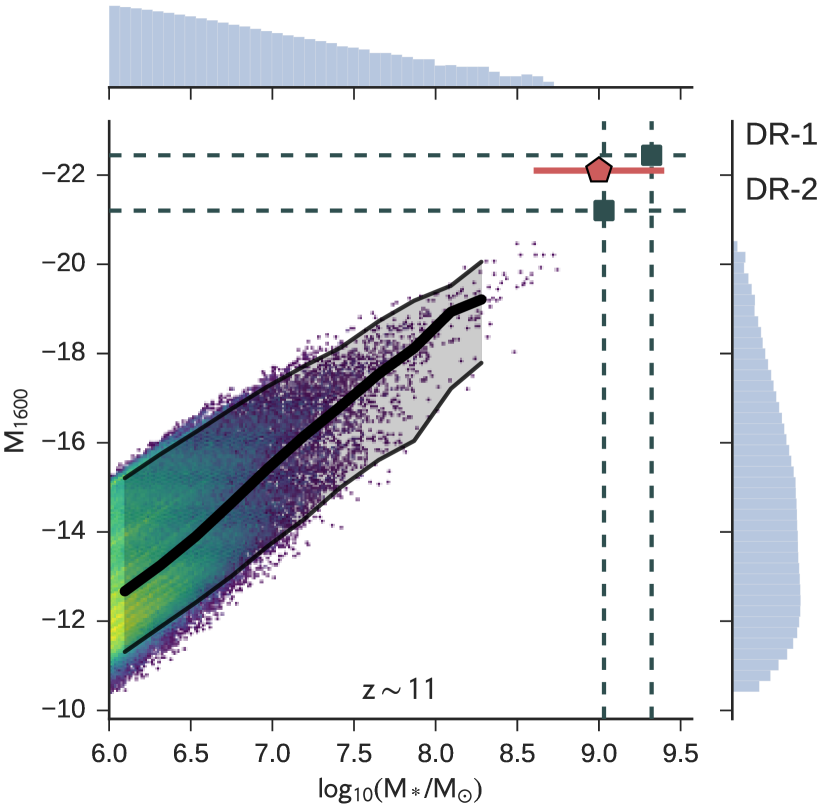
DR-1 and DR-2 are the two most massive galaxies in the simulation at the redshift at which they were selected (=11.1) and are hosted by the two most massive subhaloes. They are also rare outliers from the majority of the model galaxy population in terms of their stellar masses, star formation rates and UV luminosities. However, they remain broadly consistent with the mean trends displayed by galaxies at lower luminosities/masses, suggesting that their history is not particularly special or unique. As an example, in Fig. 3 we present the distribution of all Meraxes =11.1 galaxies in the UV magnitude versus stellar mass plane. The positions of DR-1 and DR-2 are shown as grey squares, whilst GN-z11 is indicated by the red point with error bars. Although these three objects lie out with the bulk of the main distribution, they are roughly consistent with the median – trend extrapolated from lower masses.
4 The origin and fate of GN-z11
The detection of such a massive and luminous galaxy at 11 raises a number of interesting questions. How do such massive systems form so rapidly? Is their extreme brightness merely a transient feature of their evolution brought on by a merger or other significant event? If not, then how can the level of star formation required to produce new, UV luminous stars be maintained? In this section we address these questions using our model analogue galaxies and further explore what the eventual fate of such objects is at lower redshifts.
4.1 Formation history
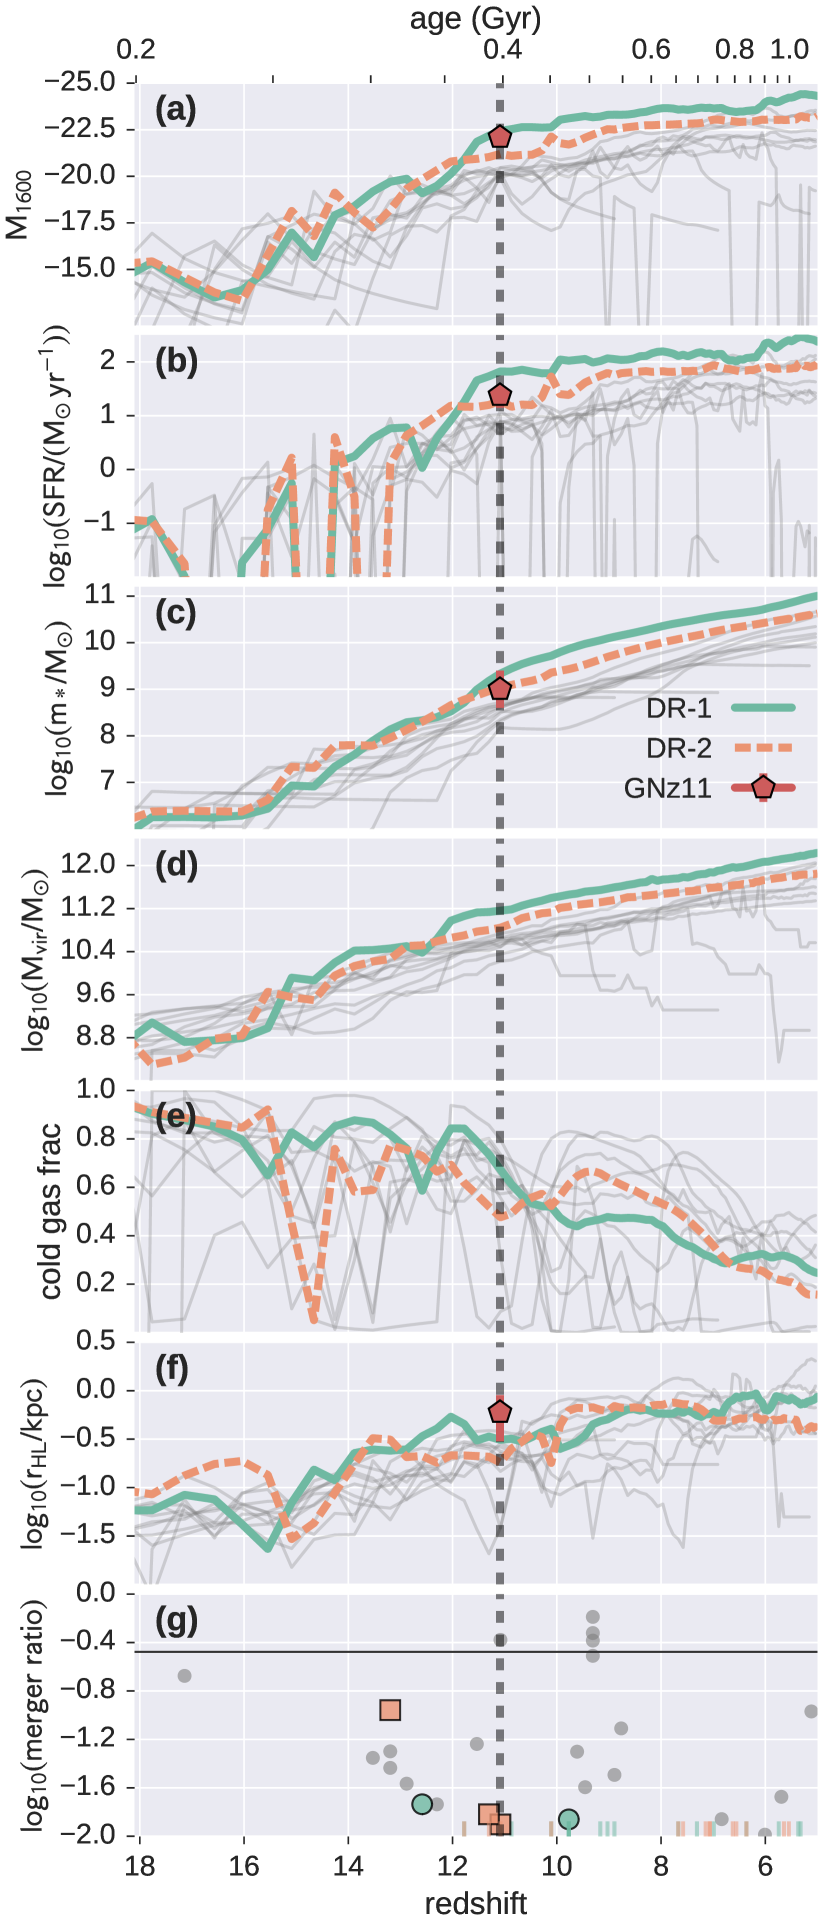
Fig. 4 shows the full formation histories of DR-1 (green) and DR-2 (orange) for a number of properties from =18 to 5. The corresponding measured values for GN-z11 are shown as red points with error bars where available. As with the UV luminosity and stellar masses discussed above, we see close agreement between our model analogues and GN-z11 in terms of star formations rates (panel b) and disc sizes (panel f).
The UV luminosities of both DR-1 and DR-2 continually, but extremely rapidly, increase from high redshift (panel a). The formation (or half-mass) redshift of each =11.1 analogue’s dark matter subhalo is 11.4 and 11.9, respectively. For comparison, theoretical expectations using extended Press–Schechter theory (Bond et al., 1991) are for these two haloes to have formed far earlier, at 12.1, and hence to have grown at a much slower pace (Tacchella et al., 2013; Trenti et al., 2015). In our simulation, the host subhalo of DR-1 grows by a factor of approximately 5 in just 65 Myr (panel c) immediately preceding =11.1, resulting in a growth in stellar mass of a factor of 9 during the same period. A visual inspection of the evolution of the local environment of DR-1 indicates that this period of rapid growth coincides with infall into a filamentary like structure. During this time, the host subhalo is subjected to multiple minor mergers (of haloes with no stellar mass), as well as significant smooth accretion below the resolution limit of the simulation.
It is also immediately apparent from Fig. 4, however, that the extreme UV brightness of DR-1 and DR-2 are not transient features of their evolution; the star formation rates and UV luminosities of both analogue systems remain high or increasing throughout their evolution. For comparison, thin grey lines show the evolution of the 10 next-most-luminous galaxies selected at the same redshift (=11.1). These luminous counterpart galaxies all possess similar growth histories, with high star formation rates (panel b) driven by continual growth of their host haloes (panel d) and associated accretion of fresh gas. However, their star formation is less sustained than that of DR-1 and 2, with more numerous periods of inactivity.
So how can DR-1 and 2 achieve and sustain such a rapid stellar mass growth? High star formation rates should result in large amounts of supernova energy being deposited into the interstellar medium, heating and ejecting cold gas and thus curtailing star formation until this material is replenished. Indeed, this is the dominant mechanism by which star formation is regulated in Meraxes (Mutch et al., 2016). In panel (e) of Fig. 4 we show the cold gas fraction, , of our ten luminous comparison galaxies in grey. Many show the expected large drops in cold gas fraction caused by star formation events which deplete gas, both by converting it to stars and ejecting it from the galaxy through supernova feedback. Occasionally these low gas fractions remain for tens of millions of years, but more often gas reserves are quickly replenished by accretion from the IGM. By comparison, our GN-z11 analogues, DR-1 and DR-2, show typically fewer major depletion events. This is due to the large amounts of cold gas available to these galaxies which results in any one star formation episode removing only a small fraction of the available material.
In panel (g) we show the baryonic merger ratios () of all merger events with mass ratios greater than 0.01 for both DR-1 and DR-2, as well as our ten comparison objects. The horizontal grey line indicates a ratio of 1/3, above which we deem the merger to be a major event. The ticks on the lower -axis indicate merger events with ratios below the range of the plot. Interestingly, we see that neither DR-1 nor DR-2 has experienced a merger with a baryonic mass ratio greater than 0.1. We further find that none of the luminous comparison galaxies has experienced a major merger prior to 11. Although these results refer to galaxy merger events (as opposed to mergers between haloes which may potentially be devoid of stars), we confirm that 90% of the 11.1 halo mass growth of all plotted objects is driven by smooth accretion of systems below the halo mass resolution limit of our input N-body simulation (1.4 M☉).
Such quiescent merger histories are an important aspect of the successful growth of GN-z11 analogues in Meraxes. Within our model, and as suggested by hydrodynamical simulations (e.g. Cox et al., 2008; Powell et al., 2013; Kannan et al., 2015), major merger events induce shocks and instabilities which in turn result in efficient star formation events. Such events consume large fractions of the cold gas of both progenitors with the resulting supernova feedback ejecting even more material from the system. Although both DR-1 and 2 have plentiful and continuous replenishment of cold gas from the IGM, it is likely that numerous major merger events would have curtailed the eventual 11 stellar mass and would certainly have introduced more variability into the star formation histories of these objects, reducing their duty cycles and limiting their probability of detection.
4.2 Eventual fate
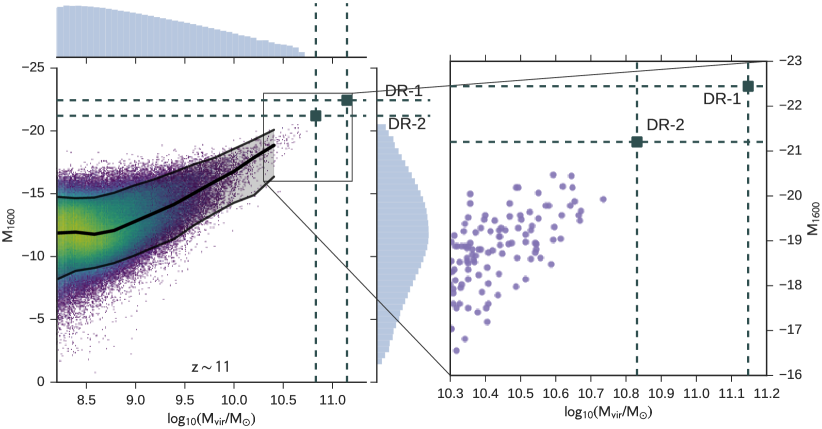
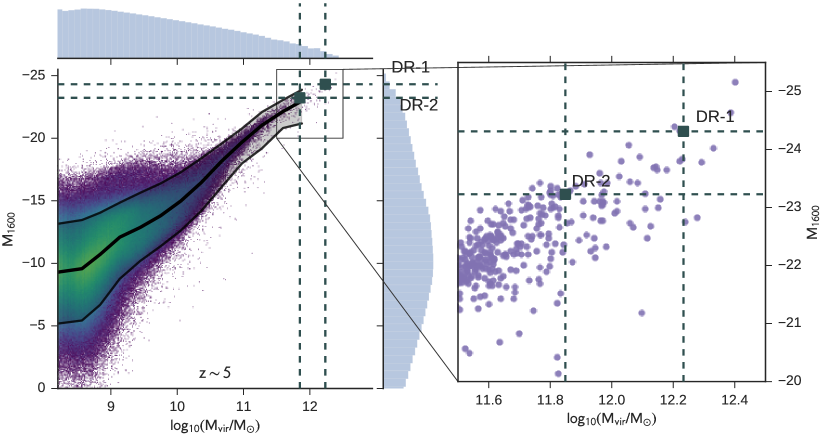
As well as using the DRAGONS framework to explore the origins of GN-z11 analogues, we can also exploit the realistic galaxy populations it provides to explore the eventual fate of these rare objects. From Fig. 4, we can see that the haloes which DR-1 and 2 occupy continue to grow steadily to =5. This steady growth brings with it fresh gas, allowing for a slowly increasing star formation rate and UV luminosity. As such, these galaxies remain the most luminous and massive of the twelve objects shown in the figure (selected to be the twelve most UV-luminous objects at =11.1). However, when compared to the full galaxy population at =5, our two GN-z11 analogues are no longer the brightest or most massive in the simulation volume. Such a regression of extreme objects towards the mean at later times is an expected feature of structure formation (Trenti et al., 2008).
In Fig. 5 we show the absolute UV magnitude versus subhalo mass distribution for the full galaxy population at =11.1 (top) and =5 (bottom). The panels on the right-hand side show a zoom in scatter plot of the highest (/) regions. As with Fig. 3 above, the thick black line indicates the median of the distribution, with the shaded region showing the 95 pc confidence intervals. Grey squares indicate the positions of DR-1 and DR-2. At 11 both galaxies lie in the most massive subhaloes and are clear outliers from the bulk of the galaxy population. At =5, this is no longer the case. Not only have both systems rejoined the tail of the main distribution, but there are several systems which are both more massive and luminous. Our model therefore predicts that although GN-z11 may be a highly biased, rare galaxy in the redshift 11 Universe, it is likely the progenitor of more common massive galaxies in the post-reionization epoch. For reference, we present the full =5 properties of DR-1 and DR-2 in Table 1.
5 Detectability and prospects for JWST
GN-z11 represents the highest redshift galaxy found to date, and pushes the boundaries of what is technically achievable using HST. JWST will possess the capability to go approximately two magnitudes deeper in the rest frame UV at high redshift, opening up the possibility of detecting more GN-z11 type systems at 11 (Waters et al., 2016b), as well as their progenitors at higher redshifts.
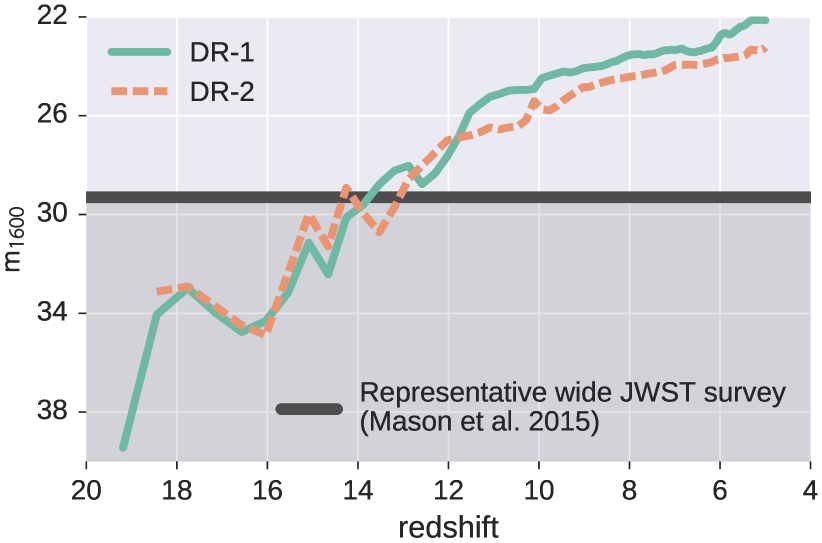
In Fig. 6 we present the rest-frame apparent UV magnitude histories of DR-1 and DR-2 from =5–20 (green and orange lines, respectively). No dust extinction has been included, in agreement with the observed blue UV continuum slope of GN-z11 (Oesch et al., 2016). The grey horizontal line indicates the 8 detection limit for the example wide-field JWST/NIRCAM survey presented in Mason et al. (2015). This survey design corresponds to a total of 800 hours of exposure time divided up amongst 400 pointings in 5 bands, and covering a total area of 4000 arcmin2. Further details can be found in Mason et al. (2015).
The total comoving volume of this example survey is (178.4 Mpc)3 at =11.1. This is approximately 6 times the volume of our Tiamat simulation, and 90% of that of the much larger BlueTides simulation (Feng et al., 2015), within which it has been recently shown that approximately 30 systems of similar or brighter luminosity than GN-z11 are found (Waters et al., 2016b). Such a survey should therefore provide both a volume and sensitivity to easily detect multiple GN-z11 analogue systems at 11. Our model further suggests that the progenitors of such systems may remain luminous enough to be detected out to 13–14, corresponding to the early stages of Reionization when the Universe was less than 10% ionized (e.g. Kuhlen & Faucher-Giguère, 2012; Mutch et al., 2016, Greig & Mesinger in prep.).
6 Conclusions
In this work, we identify two GN-z11 analogue systems from the results of the semi-analytic model, Meraxes, created as part of the DRAGONS programme. The presence of these two analogues in a simulated volume approximately equal to that of the observational survey volume supports claims by other authors (Waters et al., 2016b) that galaxies as luminous as GN-z11 are more common than extrapolations of 4–8 UV LFs would suggest (Oesch et al., 2016).
Using the detailed properties and full formation histories afforded to us by Meraxes, we have investigated the formation, evolution and fate of our two model analogue systems (DR-1 and 2). Our results can be summarized as follows.
-
•
Both DR-1 and 2 possess stellar masses, UV luminosities, star formation rates, sizes and SEDs, which are in close agreement with the measured values of GN-z11 (Section 3).
-
•
These analogues are the most UV-luminous and massive systems in our simulated volume at =11 and are rare outliers from the bulk of the galaxy population. However, despite their extreme nature, their properties are broadly consistent with extrapolations of the mean trends at lower masses (Section 3).
-
•
The extreme UV brightness of our analogues at is not a transient feature of their histories. Instead both their luminosities and stellar masses increase relatively smoothly, but extremely rapidly, from higher redshifts and continue to increase for the remainder of their evolution to =5 (Section 4.1).
-
•
The sustained and increasing SFRs of DR-1 and DR-2 are due to rapid growth of their host dark matter haloes, driven predominantly by smooth accretion of objects below the mass resolution limit of our simulation and bringing with it an ample supply of fresh cold gas to fuel star formation. Another important feature of these growth histories is a notable lack of major mergers which would have caused a significant star burst, ejecting a large amount of cold gas and temporarily stalling star formation (Section 4.1).
-
•
Despite being the most extreme and rare outliers of the full galaxy population at 11, by =5 neither analogue is the most massive nor UV-luminous system in the simulation (Section 4.2).
-
•
Future, wide-field surveys with JWST will likely be able to identify the progenitors of GN-z11 type galaxies out to 13–14 (Section 5).
The potential ability of JWST to detect GN-z11 progenitors all the way out to 14 will push the frontiers of galaxy-formation observations to the early phases of cosmic reionization and provide a valuable glimpse of the first galaxies to reionize the Universe on large scales.
Acknowledgements
This research was supported by the Victorian Life Sciences Computation Initiative (VLSCI), grant ref. UOM0005, on its Peak Computing Facility hosted at the University of Melbourne, an initiative of the Victorian Government, Australia. Part of this work was performed on the gSTAR national facility at Swinburne University of Technology. gSTAR is funded by Swinburne and the Australian Governments Education Investment Fund. AM acknowledges support from the European Research Council (ERC) under the European Union’s Horizon 2020 research and innovation programme (grant agreement No 638809 AIDA). PO and GDI acknowledge the support of NASA grant HST-GO-1387 awarded by the Space Telescope Science Institute, which is operated by the Association of Universities for Research in Astronomy, Inc., under NASA contract NAS 526555. The DRAGONS research programme is funded by the Australian Research Council through the ARC Laureate Fellowship FL110100072 awarded to JSBW.
References
- Angel et al. (2016) Angel P. W., Poole G. B., Ludlow A. D., Duffy A. R., Geil P. M., Mutch S. J., Mesinger A., Wyithe J. S. B., 2016, MNRAS, 459, 2106
- Bond et al. (1991) Bond J. R., Cole S., Efstathiou G., Kaiser N., 1991, ApJ, 379, 440
- Bouwens et al. (2015) Bouwens R. J., et al., 2015, ApJ, 803, 34
- Cox et al. (2008) Cox T. J., Jonsson P., Somerville R. S., Primack J. R., Dekel A., 2008, MNRAS, 384, 386
- Duncan et al. (2014) Duncan K., et al., 2014, MNRAS, 444, 2960
- Fall & Efstathiou (1980) Fall S. M., Efstathiou G., 1980, MNRAS, 193, 189
- Feng et al. (2015) Feng Y., Di Matteo T., Croft R., Tenneti A., Bird S., Battaglia N., Wilkins S., 2015, ApJ, 808, L17
- Finkelstein et al. (2015) Finkelstein S. L., et al., 2015, ApJ, 810, 71
- Geil et al. (2016) Geil P. M., Mutch S. J., Poole G. B., Angel P. W., Duffy A. R., Mesinger A., Wyithe J. S. B., 2016, MNRAS, 462, 804
- González et al. (2011) González V., Labbe I., Bouwens R. J., Illingworth G., Franx M., Kriek M., 2011, ApJ Letters, 735, L34
- Grazian et al. (2015) Grazian A., et al., 2015, A&A, 575, A96
- Kannan et al. (2015) Kannan R., Macciò A. V., Fontanot F., Moster B. P., Karman W., Somerville R. S., 2015, MNRAS, 452, 4347
- Kuhlen & Faucher-Giguère (2012) Kuhlen M., Faucher-Giguère C.-A., 2012, MNRAS, 423, 862
- Liu et al. (2016) Liu C., Mutch S. J., Angel P. W., Duffy A. R., Geil P. M., Poole G. B., Mesinger A., Wyithe J. S. B., 2016, MNRAS, 462, 235
- Mashian et al. (2016) Mashian N., Oesch P. A., Loeb A., 2016, MNRAS, 455, 2101
- Mason et al. (2015) Mason C. A., Trenti M., Treu T., 2015, ApJ, 813, 21
- Mesinger & Furlanetto (2007) Mesinger A., Furlanetto S., 2007, ApJ, 669, 663
- Mesinger et al. (2011) Mesinger A., Furlanetto S., Cen R., 2011, MNRAS, 411, 955
- Mo et al. (1998) Mo H. J., Mao S., White S. D. M., 1998, MNRAS, 295, 319
- Mutch et al. (2016) Mutch S. J., Geil P. M., Poole G. B., Angel P. W., Duffy A. R., Mesinger A., Wyithe J. S. B., 2016, MNRAS, 462, 250
- Oesch et al. (2016) Oesch P. A., et al., 2016, ApJ, 819, 129
- Planck Collaboration (2015) Planck Collaboration 2015, preprint, (arXiv:1502.01589)
- Poole et al. (2016) Poole G. B., Angel P. W., Mutch S. J., Power C., Duffy A. R., Geil P. M., Mesinger A., Wyithe S. B., 2016, MNRAS, 459, 3025
- Powell et al. (2013) Powell L. C., Bournaud F., Chapon D., Teyssier R., 2013, MNRAS, 434, 1028
- Song et al. (2016) Song M., et al., 2016, ApJ, 825, 5
- Tacchella et al. (2013) Tacchella S., Trenti M., Carollo C. M., 2013, ApJ, 768, L37
- Trac et al. (2015) Trac H., Cen R., Mansfield P., 2015, ApJ, 813, 54
- Trenti et al. (2008) Trenti M., Santos M. R., Stiavelli M., 2008, ApJ, 687, 1
- Trenti et al. (2010) Trenti M., Stiavelli M., Bouwens R. J., Oesch P., Shull J. M., Illingworth G. D., Bradley L. D., Carollo C. M., 2010, ApJ, 714, L202
- Trenti et al. (2015) Trenti M., Perna R., Jimenez R., 2015, ApJ, 802, 103
- Waters et al. (2016a) Waters D., Di Matteo T., Feng Y., Wilkins S. M., Croft R. A. C., 2016a, MNRAS,
- Waters et al. (2016b) Waters D., Wilkins S. M., Di Matteo T., Feng Y., Croft R., Nagai D., 2016b, MNRAS, 461, L51