Kinetic AGN feedback effects on cluster cool cores simulated using SPH
Abstract
We implement novel numerical models of AGN feedback in the SPH code GADGET-3, where the energy from a supermassive black hole (BH) is coupled to the surrounding gas in the kinetic form. Gas particles lying inside a bi-conical volume around the BH are imparted a one-time velocity ( km/s) increment. We perform hydrodynamical simulations of isolated cluster (total mass ), which is initially evolved to form a dense cool core, having central K. A BH resides at the cluster center, and ejects energy. The feedback-driven fast wind undergoes shock with the slower-moving gas, which causes the imparted kinetic energy to be thermalized. Bipolar bubble-like outflows form propagating radially outward to a distance of a few kpc. The radial profiles of median gas properties are influenced by BH feedback in the inner regions ( kpc). BH kinetic feedback, with a large value of the feedback efficiency, depletes the inner cool gas and reduces the hot gas content, such that the initial cool core of the cluster is heated up within a time Gyr, whereby the core median temperature rises to above K, and the central entropy flattens. Our implementation of BH thermal feedback (using the same efficiency as kinetic), within the star-formation model, cannot do this heating, where the cool core remains. The inclusion of cold gas accretion in the simulations produces naturally a duty cycle of the AGN with a periodicity of Myr.
keywords:
cosmology: theory – galaxies: clusters: general – galaxies: jets – (galaxies:) cooling flows – black hole physics – hydrodynamics1 Introduction
The enormous amounts of energy emitted by the centers of active galaxies are believed to be from accretion of matter onto supermassive black holes (SMBHs) lying there (e.g., Rees, 1984; Kormendy & Richstone, 1995; Ferrarese & Ford, 2005). Feedback from active galactic nuclei (AGN) strongly influences the formation and cosmological evolution of structures, whereby the overall properties of a galaxy can be regulated by its central SMBH, which also impacts the environment from pc to Mpc scales (e.g., Lynden-Bell, 1969; Richstone et al., 1998; King, 2003; Granato et al., 2004; Sazonov et al., 2005; Barai & Wiita, 2006; Croton et al., 2006; Barai, 2008; Fabian, 2012; Wagner, Umemura & Bicknell, 2013). The energy output is often observed as AGN outflows in a wide variety of forms (see Crenshaw, Kraemer & George, 2003; Everett, 2007, for reviews), e.g.: collimated relativistic jets and/or overpressured cocoons in radio (Nesvadba et al., 2008), blue-shifted broad absorption lines in the ultraviolet (UV) and optical (Reichard et al., 2003; Rupke & Veilleux, 2011), warm absorbers (Chartas, Brandt & Gallagher, 2003; Krongold et al., 2007) and ultra-fast outflows in X-rays (Tombesi et al., 2013; Feruglio et al., 2015), molecular gas in far-IR (Feruglio et al., 2010; Sturm et al., 2011; Cicone et al., 2014).
A major baryonic component pervading galaxy clusters is the diffuse hot (temperature K) gas present in between galaxies, called the intracluster medium (ICM). It emits copiously in the X-ray band, as it undergoes radiative cooling by losing energy through the bremsstrahlung process, and emission lines of keV energy associated to atomic transitions from metals. Observations of X-ray radial profiles of the so-called classical cool-core clusters show a sharp peak in the X-ray surface brightness at the core, which imply a low entropy, high density, hence a shorter cooling time of the central ICM. As the cluster core cools faster, the central gas pressure also decreases. The overpressured ICM from the surrounding cluster region should inflow toward the core, as a slow, subsonic cooling flow (Fabian, 1994) in the standard scenario; however observations find a lack of emission from cool gas in the cluster center (e.g., Tamura et al., 2001).
The core cooling times in of the clusters is much shorter than the cluster lifetimes, few Gyrs (Bauer et al., 2005; Cavagnolo et al., 2009). Therefore the dense ICM at cluster cores should cool and fragment to form self-gravitating objects like molecular clouds and stars. UV observations reveal recent star formation in the central brightest cluster galaxies of many cool-core clusters (O’Dea et al., 2004; Hicks, Mushotzky & Donahue, 2010). However, enough cold condensed material is not observed, which is called the cooling flow problem. The observed mass deposition rates of cooling and star-forming gas in the cores of galaxy clusters with strong cooling flows is much lower than that predicted from X-ray observed gas density profiles and simple radiative cooling models (Bohringer et al., 2002; Peterson & Fabian, 2006; O’Dea et al., 2008).
The above observations imply that the cooling flow ICM at cluster cores is being heated. The most favored mechanism is heating by energy feedback of outflows driven by AGN lying in brightest cluster galaxies (Young, Wilson & Mundell, 2002; Fabian et al., 2003; McNamara & Nulsen, 2007; Mittal et al., 2009; McDonald et al., 2015). Other possible heating mechanisms are: star-formation and supernovae-driven outflows, thermal conduction from the hot outer ICM to the center, cosmic rays, and magnetic fields. While X-ray observations reveal a standard pure cooling rate suppression (by less than ); at the same time residual cooling of at least a few percent is observed (e.g. Gaspari, 2015, and references therein). Hence the heating mechanisms at operation are avoiding overheating of cluster cores.
The majority () of cool-core clusters are observed to host radio sources (Burns, 1990; Dunn & Fabian, 2006). Radio-loud AGN drive relativistic jets on two opposite sides, surrounded by overpressured lobes, which expand supersonically and end in bow shocks (Blandford, 1976; Kaiser & Alexander, 1997; Barai & Wiita, 2007). Radio jets and lobes have complex interactions rising through the cluster atmosphere: heat the cooling flow, displace the X-ray emitting gas along the jet direction, and/or locally compress the ICM. Structures like cavities and bubbles as depressions (or holes) in X-ray surface brightness images are observed in many clusters, coincident with the radio jet/lobe emission (Carilli, Perley & Harris, 1994; Bohringer et al., 1995; McNamara et al., 2000; Fujita et al., 2002; Heinz et al., 2002; Birzan et al., 2004; Choi et al., 2004; Reynolds, Brenneman & Stocke, 2005a; Kirkpatrick & McNamara, 2015).
Numerical hydrodynamical simulations are performed to follow the propagation of radio jets and lobes injected from the central AGN into the ICM, and their subsequent evolution imparting energy and entropy to the gas. Several 2D and 3D simulations using Eulerian adaptive-mesh refinement codes have shown that mechanical, kinetic or thermal energy coupled from the AGN to surrounding ICM is able to offset its radiative cooling. Most of these use isolated cluster models, an initial isothermal spherically-symmetric analytical profile for the ICM (Bruggen & Kaiser, 2002; Basson & Alexander, 2003; Dalla Vecchia et al., 2004; Omma et al., 2004; Reynolds et al., 2005b; Alouani Bibi et al., 2007; Hillel & Soker, 2016). Few studies have included full jet dynamics and a gas feedback model (Vernaleo & Reynolds, 2006; Gaspari, Ruszkowski & Sharma, 2012), used cluster extracted from a cosmological volume (Bruggen et al., 2005), implemented momentum-driven jets in zoom-in cluster resimulation (Dubois et al., 2010). Mesh-code idealized simulations demonstrate that strong AGN heating can transform a cool-core cluster to a non cool-core state (Guo & Oh, 2009).
Lagrangian SPH code simulations are also done to study AGN feedback effects on ICM evolution, which usually does not consider the radio jet’s propagation. These SPH studies include additional gas physics; star-formation, supernova feedback, and AGN feedback as thermal heating: hot buoyant bubbles injected into the ICM during active AGN phases (Sijacki & Springel, 2006; Revaz, Combes & Salome, 2008); transition from quasar-mode to radio-mode feedback when the SMBH accretion rate goes below a given limit, and the feedback efficiency is increased by a factor of (Fabjan et al., 2010; Hirschmann et al., 2014). Recently, Richardson et al. (2016) compared between adaptive mesh refinement and SPH methods, performing cosmological zoom simulations of a galaxy cluster with AGN feedback.
AGN outbursts are fed by gas accretion from the ICM, so self-regulation may arise naturally. When an AGN is active for a period of time, its outflow heating stops the cooling flow. This also limits the gas accreting onto the SMBH, turning the AGN dead. Afterwards, the ICM cools again, cooling flow restarts, providing the central SMBH with fuel and might trigger another phase of AGN outburst. The result is a self-regulating cyclic process with cooling flow alternating with bursts of AGN activity. Idealized simulations have studied how AGN feedback can successfully self-regulate the cooling and heating cycles of the ICM at cluster cores (Cattaneo & Teyssier, 2007; Bruggen & Scannapieco, 2009; Gaspari et al., 2011a; Li et al., 2015; Prasad, Sharma & Babul, 2015). Explicitly simulations including AGN jets have revealed the trigger of a circulation of gas, that is crucial in stabilizing cool cores and creating self-regulation (e.g., Omma & Binney, 2004; Brighenti & Mathews, 2006).
The physical mechanisms of gas accreting onto SMBHs and resulting energy feedback is complex, with the surrounding gas likely accelerated by thermal pressure and/or radiation pressure. The relevant physical scales are orders of magnitude below the scales resolved in current galaxy formation simulations. Hence AGN accretion and feedback are incorporated in the simulations using sub-resolution numerical prescriptions (e.g., Springel, Di Matteo & Hernquist, 2005). The physics of the gas, on scales unresolved in cosmological simulations, is modelled using spatially averaged properties describing the medium on scales that are resolved. Galaxy formation simulations have investigated coupling of AGN feedback using both mechanisms: thermal (e.g., Di Matteo, Springel & Hernquist, 2005; Sijacki et al., 2007; Booth & Schaye, 2009; Gaspari et al., 2011b), and kinetic (e.g., Dubois et al., 2010; Ostriker et al., 2010; Barai, Martel & Germain, 2011; Gaspari, Brighenti & Temi, 2012; Vazza, Bruggen & Gheller, 2013).
Kinetic AGN feedback in SPH simulations has been implemented in a few previous work. Choi et al. (2012, 2014) studied radiative- and momentum-based mechanical AGN feedback in isolated and merging galaxies using the GADGET code, and Choi et al. (2015) performed zoom-in cosmological simulations. They implemented output of mass and mechanical momentum (in addition to energy output) from the BH to the ambient gas, by kicking each wind particle along the direction parallel or anti- parallel to its angular momentum.
More recently, a similar work was presented by Zubovas, Bourne & Nayakshin (2016). Our current study was developed completely independent of this; and their aims/setup are quite different from ours. They studied feedback from fixed-luminosity AGN affecting turbulent gas spheres, using an initial condition of gas distributed from pc to kpc. In addition to thermal feedback, there is momentum feedback, where each neighbour particle receives a fraction of the AGN wind momentum in a direction radially away from the SMBH. Their bi-conical model, where the thermal and kinetic feedback energy are injected in a bi-cone, produces a far more complex gas structure around the SMBH.
We investigate, in this paper, different sub-resolution models and implementations of AGN feedback in cluster simulations using the SPH technique. We implement novel numerical methods to couple the energy from a central SMBH to the surrounding gas, kinetic feedback - where the velocity (or momentum) of the gas is boosted. Here we present simulations of isolated clusters. Our goal is to explore the evolution of cluster cool cores, the properties of BH accretion, growth and feedback, especially its impact on the cooling ICM. We have not done any parameter tuning in this paper to match observations; but our aim here is to explore the results of the new implementation, especially the differences from our thermal feedback.
Our previous studies (Ragone-Figueroa et al., 2013; Planelles et al., 2014, and references therein) used only thermal feedback, where the feedback efficiency needed to be increased by a factor of in the radio-mode. Rasia et al. (2015) (following Steinborn et al. 2015) classified the power from AGN into two parts: radiative and mechanical; simulating both of them with thermal feedback. In this paper, we progressively build a model where the effect of radiative power of the AGN is simulated with thermal feedback, and the effect of mechanical power of the AGN is simulated with kinetic feedback. Thus we add to and improve the unified model of AGN feedback (§2.4), by integrating our new kinetic prescription with the mechanical outflow model of Steinborn et al. (2015). This renders an SPH code (including the full gas physics required for cosmological simulations) able to simulate both quasar-mode and radio-mode AGN, and generate bubble-like outflows in the radio-mode (c.f. §3) in a self-consistent way.
This paper is organised as follows: we describe our numerical code and simulation setup in §2, present, analyze and discuss our results in §3 and §4 (two sections for two categories of simulations), discuss the caveats of our study in §5, and in §6 we give a summary of our main findings and discuss future work.
2 Numerical Method
We use a modified version of the TreePM (particle mesh) - SPH (smoothed particle hydrodynamics) code GADGET-3 (Springel, 2005), which includes sub-resolution physics as described next. The initial cluster models are presented in §2.1, the BH modules including our new kinetic feedback prescription are detailed in §2.2-§2.5, and our simulations are outlined in §2.6.
Besides AGN feedback, the physical processes implemented in our simulations include: radiative physics, star-formation (SF), chemical evolution, and are the same as in Barai et al. (2013). As an exception in the simulations with no SF, radiative cooling and heating processes are followed for a primordial mix of hydrogen and helium with no metals (Tornatore et al., 2010), by adopting the cooling rates from Sutherland & Dopita (1993), including the effect of a UV background (Haardt & Madau, 1996).
SF is implemented following the multiphase effective sub-resolution model by Springel & Hernquist (2003). Gas particles with density above a limiting threshold, cm-3 (units of number density of hydrogen atoms), contain cold and hot phases, and are star-forming. Collisionless star particles are spawned from gas particles undergoing SF, based on the stochastic scheme by Katz, Weinberg & Hernquist (1996). We allow a gas particle to spawn up to four generations of stars.
Stellar evolution and chemical enrichment are followed for 11 different elements: H, He, C, Ca, O, N, Ne, Mg, S, Si, Fe, using the chemical evolution model of Tornatore et al. (2007). We include a fixed stellar initial mass function according to Chabrier (2003). There is no kinetic feedback from supernovae-driven galactic outflows in our simulations. Radiative cooling and heating is computed by adding metal-line cooling from Wiersma, Schaye & Smith (2009), accounting for the 11 species, and photoionizing radiation from the cosmic microwave background and the Haardt & Madau (2001) model for the UV/X-ray background are considered.
2.1 Initial Condition: Isolated Cluster Model
| Series | |||||
|---|---|---|---|---|---|
| Name | [] | [] | [] | (kpc/h) | |
| Fiducial (all other runs) | |||||
| High Resolution (run c10kHR) |

The initial condition (IC) is an isolated cluster in hydrostatic equilibrium (e.g., Viola et al., 2008). Our fiducial cluster has a total mass (including dark matter) of , and virial radius of Mpc. A Hubble parameter of km s-1 Mpc-1 or , and baryon density are adopted (e.g. Komatsu et al., 2011). Table 1 lists the relevant gas particle masses and force resolutions. The baryon fraction of the cluster is . We sample a sphere of more than times larger than the virial radius, in order to avoid void boundary conditions in the gas just at the virial radius, which makes the total gas mass to be . There are no stars in the IC. In the runs including SF, new star particles form during the simulation via star formation in the gas.
All the particles (gas, stars, BH) follow collisionless gravitational dynamics, while in addition the gas particles undergo hydrodynamical interactions. The Plummer-equivalent softening length for gravitational forces is set to kpc for all the particles, in our default resolution simulations. The SPH computations are carried out using a -spline kernel (Monaghan & Lattanzio, 1985), which is the standard one used in the GADGET code (Eq. 4 of Springel 2005). The number of neighbors for each gas particle is taken as . We set a minimum value of the SPH smoothing length to be times the gravitational softening. Note that, using isolated ICs, we could have reached much larger force and mass resolution. Instead, our choice here is to mimic the typical resolutions of cosmological, zoomed-in simulations of galaxy clusters.
The procedure of generating our IC consists of the following steps, which are described in detail in the next paragraphs. (a) Density profiles for dark matter and hydrostatic gas are computed analytically. (b) The gas density profile is sampled to produce the initial cluster. (c) The cluster is evolved with gravity and hydrodynamics, for several dynamical times, to reach true equilibrium and relaxation. (d) The cluster is then evolved with gravity, hydrodynamics and cooling, to develop a cool core.
The cluster dark matter halo is represented by a background fixed static potential, following the Navarro, Frenk & White (1997) (NFW) density profile,
| (1) |
where is a scale radius, is a characteristic (dimensionless) density, and is the critical cosmic density. Some studies (e.g. Ragone-Figueroa, Granato & Abadi, 2012) find an adiabatic de-contraction effect on the dark matter halo due to massive outflows generated by AGN. Nevertheless, we ignore any impact of AGN on the dark matter halo (by assuming it as a static potential); because the goal of our idealized simulations is to study the different forms of feedback effects on the cluster-central gas.
A spherical distribution of gas denotes the ICM, initially in hydrostatic equilibrium within the NFW potential. The equilibrium solution for the gas can be found (Suto et al., 1998), assuming that the baryonic fraction of the halo is negligible and the gas (of density , and pressure ) follows a polytropic equation of state with index : . The equation of hydrostatic equilibrium is:
| (2) |
Here is the halo mass within radius , which can be derived from the NFW profile. With these assumptions, Eq. (2) can be solved analytically (Komatsu & Seljak, 2001), as done by Viola et al. (2008), which we follow. The analytic profiles for dark matter and hydrostatic gas are thus computed, and sampled to produce the initial gas distribution.
This initially generated isolated cluster is processed to form a cool-core, as displayed in Fig. 1 showing the radial profiles of gas density (left panel), temperature (middle), and entropy (right). The first generated IC is the red curve with square plotting symbols; the cyan shaded area reveals the scatter (most prominent in the density profile) due to numerical noise. The IC is first allowed to evolve using hydrodynamical interactions only up to Gyr (corresponding to a few dynamical times for such a cluster), the result of which is shown by the black curve (triangles) with yellow shaded area. This process relaxes the IC while getting rid of the initial noise, and reaches an equilibrium. The initial noise decays rather quickly during the hydrodynamics-only evolution, within a time of Gyr, which is about of the dynamical time of the cluster.
The hydro-only result is subsequently evolved using cooling (primordial composition gas with no metals) and hydrodynamics, up to further Gyr, which produces the blue curve (asterisks) with grey shaded area. The cooling evolution forms a cold, dense core at the cluster center. The cluster at this stage (blue asterisks) is taken as the default IC of our simulation runs. The mass cooling rate (to temperature K, within kpc of the cluster) in our IC is /yr.
After this, rescaled as , one BH is created in our simulations residing at the center of cluster, at rest. It is a collisionless particle in the GADGET-3 code, having a dynamical mass () equal to a gas particle mass, given by simulation resolution. The BH outputs feedback energy: a fixed power in the first cases (§2.3), and next undergoing mass growth and resulting feedback (§2.4).
2.2 Kinetic AGN Feedback
Feedback from BH corresponds to an output power injected and coupled to the surrounding gas. It drives gas outward at a velocity and mass outflow rate . The energy-conservation equation, with the kinetic energy of the outflowing gas equated to the feedback energy from the BH, is,
| (3) |
This is similar to the energy-driven wind formalism of Barai et al. (2014). Typical AGN wind velocity values seen in observations is between km/s (e.g., Perna et al., 2015). We consider as a free model parameter. This is a simplified assumption of our model, which is intended to be applied to cosmological simulations, although more physically the AGN wind velocity should be self-regulated (e.g., Gaspari et al., 2011b).
2.3 First Case: Constant BH Energy
In the first set of runs, the central BH is considered to output a fixed energy (BH accretion is not taken into account here), i.e. = constant, at a fixed duty-cycle. These runs have only radiative cooling, and no SF, in order to easily isolate the effect of AGN energy injection on the gas.
The default BH power value that we explore is erg/s; with two runs having higher and lower powers. The BH activity is considered to be on for Myr when the energy is ejected, and then off for Myr when there is no energy output. Such a on/off fixed-power duty-cycle occurs periodically up to the end of the simulation, for a few Gyrs.
2.4 Second Case: BH Accretion and Energy Feedback
The second set of runs includes star-formation, and a BH undergoing gas accretion, mass growth and resulting feedback. The accretion of surrounding gas onto a SMBH of mass is parametrized by the Bondi-Hoyle-Lyttleton rate (Hoyle & Lyttleton, 1939; Bondi & Hoyle, 1944; Bondi, 1952):
| (4) |
Here, is the gas density, is the sound speed, and is the velocity of the BH relative to the gas. The Bondi radius () and sonic point (where the gas passes through Mach number , going from subsonic velocities at larger radii to supersonic at smaller radii) are of the order of ’s of pc, hence are unresolved in current galaxy formation simulations. The gas properties () are estimated by smoothing on the resolution scale (kpc to few ’s of pc) at the BH location. This results in artificially low densities compared to spatially resolving the Bondi radius scale. Furthermore, smaller-scale simulations (Barai, Proga & Nagamine, 2012; Gaspari, Ruszkowski & Oh, 2013; Gaspari, Brighenti & Temi, 2015) show that the cooling gas is multiphase, with a variable accretion rate. This cold phase of the ISM is not resolved in galaxy simulations.
As a numerical correction, the accretion rate is enhanced in the simulations by setting the multiplicative factor to (e.g., Springel, Di Matteo & Hernquist, 2005; Sijacki et al., 2007; Di Matteo et al., 2008; Khalatyan et al., 2008; Johansson, Naab & Burkert, 2009; Sijacki, Springel & Haehnelt, 2009; Dubois et al., 2013), which we adopt. Most of our simulations are done using a single mode of accretion considering all the gas (of any temperature) around BH. In one run we employ the cold accretion model by Steinborn et al. (2015), using for computing the accretion rate of the cold gas (temperature K), and for the hot gas ( K).
Accretion onto the BH is limited to the Eddington rate, making the resultant accretion rate,
| (5) |
Here, is the Eddington mass accretion rate, expressed in terms of the Eddington luminosity,
| (6) |
where, is the gravitational constant, is the mass of a proton, is the speed of light, and is the Thomson scattering cross-section for an electron.
A fraction of the accreted rest-mass energy is radiated away by the BH. The radiation luminosity is,
| (7) |
with being the radiative efficiency. We adopt the mean value for radiatively efficient accretion onto a Schwarzschild BH (Shakura & Sunyaev, 1973): , which is held at a fixed value. A fraction of this radiated energy is coupled to the surrounding gas as feedback energy from the BH:
| (8) |
We consider the feedback efficiency as a free parameter in our models.
We examine different ways by which the BH feedback energy can be coupled to the gas:
Thermal : We adopt the default scheme from Springel, Di Matteo & Hernquist (2005). The energy is distributed thermally to heat up the gas isotropically around the BH. The temperature of the neighboring gas particles (those contributing to Eq. 12 in §2.5, particles lying within the smoothing length of the BH) is incremented by an amount scaled by their SPH kernel weights.
Kinetic : The kinetic energy of the outflowing gas is derived from the BH radiation luminosity which is fed back. The energy-conservation equation becomes:
| (9) |
This gives the outflow rate in terms of the BH accretion rate,
| (10) |
There are two free parameters in our sub-resolution model of kinetic feedback: and . These parameters can be varied to obtain a closest match of the simulation versus observational relation (Barai et al., 2014). The best-fit and however depends strongly on the simulation characteristics (isolated galaxy/cluster, galaxy merger, cosmological box, etc). We decide not to attempt for obtaining any best-fit parameters in this isolated cluster work, which is a study of how kinetic BH feedback affects cluster cool cores.
Unified : The unified scheme is a combination of BH thermal and kinetic feedback, at every timestep. Following Steinborn et al. (2015), this model considers two components of AGN feedback (based on Churazov et al., 2005): outflow - mechanical feedback with outflow power , and radiation - radiative component with luminosity . The total feedback energy per unit time is then the sum (their Eqs. 7-9):
| (11) |
Steinborn et al. (2015) implemented both the components as thermal feedback. Here in our unified model, the mechanical outflow power is coupled to the gas by kinetic feedback.
2.5 Implementation in the GADGET-3 code
Quantities in the local environment around the BH are computed in a kernel-weighted way, by smoothing over neighboring gas particles. The kernel size, or the BH smoothing length , is determined at each timestep (in analogy to finding gas particle smoothing length) by implicit solution of the equation,
| (12) |
Here is the kernel estimate of the gas density at the position of the BH, and is the mass of neighboring gas particles. The BH particle has times more neighbors (e.g., Fabjan et al., 2010) than an SPH gas particle, in order to have more particles for computing the physical properties of the BH sub-resolution model.
We distribute the BH kinetic feedback energy to the gas lying inside a bi-cone around the BH, with a motivation to create a bipolar narrow-angled outflows. A bi-conical volume is defined with the BH at the apex, and two cones on opposite sides of the BH, having their axes along two diametrically opposed directions. The slant height of each cone is , and the total opening angle of a single cone is taken as . The cone-axes directions are considered as fixed in most of our runs, and we explore one case of varying this direction (as written in Table 2). The fixed direction is taken along -axis, for the BH located at the origin of our coordinate system. The gas particles lying within this bi-cone volume around the BH are tracked, and their total mass is computed.
The feedback energy is distributed to gas within a distance from the BH. In our simulations typically lies between kpc. Gas particles inside the bi-cone are stochastically selected and kicked into AGN wind, by imparting a one-time velocity boost. We use a probabilistic criterion (similar to other sub-resolution prescriptions in GADGET-3) for the implementation. A probability for being kicked is calculated in a timestep for ’th gas particle within bi-cone:
| (13) |
Here is the mass outflow rate obtained from Eq. (3). At a given timestep, all the gas particles within the bi-cone have the same probability to be ejected. A random number , uniformly distributed in the interval , is drawn and compared with . For , the gas particle is given a wind velocity kick.
The inverse proportionality of with ensures that the number of particles kicked does not depend on the geometry of the volume, but depends on only. The quantity is the mass of gas to be kicked. The probability is constructed such that the available particles (total mass within bi-cone) are sampled to reproduce kicking at the rate given by , on average. During a simulation, we always ensure that .
After receiving AGN wind kick, a gas particle’s velocity becomes:
| (14) |
The kick direction ( or ) is set along the axis of the cone inside which the gas particle lies, depending on the location of the particle w.r.t. the BH. Our choice represents a scenario where one BH injects kinetic energy along a fixed direction, chosen here as the -axis for numerical simplicity. Such a prescription allows the energy injected to be channelized most efficiently, creating bi-directional outflows originating from the central BH. In future cosmological simulations, the fixed direction for AGN kick would represent the spin of the BH.
Some studies (e.g., Barai et al., 2013) implement hydrodynamic decoupling of the gas particles kicked into wind by supernovae, to enable the outflow to escape without affecting star-formation in the galaxy. Here we perform runs considering both decoupling and coupling of the AGN wind particles from hydrodynamic interactions.
In the presence of BH accretion/growth (§2.4), the collisionless BH particle (§2.1) has a seed BH of initial mass . At each timestep , it grows according to the BH accretion rate (Eq. 5), its mass increases by an amount , with the dynamical mass (§2.1) remaining the same. After a BH has grown such that , it might accrete (or swallow) neighboring gas particles, using a stochastic methodology. When a gas particle is swallowed, it is removed from the simulation, and increases by the swallowed particle mass . This conserves dynamical mass within the computational volume. The probability of swallowing gas is set to ensure that and track each other closely.
Once the BH is created residing at the cluster center at (§2.1), it is free to move at subsequent times. We have checked that in our simulations, the BH remains within a displacement to kpc from the cluster center; which means that the BH does not advect away.
2.6 Simulations
| Run | AGN Accretion | AGN Feedback | Direction | Hydrodynamic coupling | |||
| Name | [erg/s] | [km/s] | |||||
| cooling-only, no-SF, constant energy output from BH at fixed duty-cycle | |||||||
| c5k | Constant energy | Fixed | Coupled | ||||
| c10k, c10kHR | Constant energy | Fixed | Coupled | ||||
| c5kDec | Constant energy | Fixed | Decoupled up to 50kpc | ||||
| c10kDec | Constant energy | Fixed | Decoupled up to 50kpc | ||||
| c10kDecHigh | Constant energy | Fixed | Decoupled up to 50kpc | ||||
| c10kLow | Constant energy | Fixed | Coupled | ||||
| c10kRand | Constant energy | Random | Coupled | ||||
| with cooling, SF and BH growth, energy output from BH accretion rate | |||||||
| SF | No BH | ||||||
| thr | All gas | Thermal | Isotropic | ||||
| kin10k | All gas | Kinetic | Fixed | Coupled | |||
| unf10k | All gas | Unified | Fixed | Coupled | |||
| unf5k | All gas | Unified | Fixed | Coupled | |||
| unf10kLo | All gas | Unified | Fixed | Coupled | |||
| unf10kHi | All gas | Unified | Fixed | Coupled | |||
| unf10kLoCA | Cold gas | Unified | Fixed | Coupled | |||
Table 2 lists the series of simulations we perform. They form two broad categories, as written below. Each category incorporate the same non-AGN sub-resolution physics, and the different runs in it investigate various AGN feedback models. The evolution is followed for a time to Gyr in the different runs.
-
•
Cooling only, no SF, constant energy output from BH at fixed duty-cycle, coupled as kinetic feedback (§2.3): The gas is considered to be of primordial composition, i.e., hydrogen and helium only, with no metals. The run names correspond to the variation of the model parameters as written in the following.
-
–
c5k : outflow velocity km/s.
-
–
c10k : km/s.
-
–
c10kHR : high-resolution run with km/s.
-
–
c5kDec, c10kDec : different- runs with the wind particles decoupled from hydrodynamic interactions up to a distance of kpc.
-
–
c10kDecHigh : wind-decoupled run, with a higher output BH power erg/s.
-
–
c10kLow : lower value of output BH power erg/s.
-
–
c10kRand : direction of kicking wind particles (bi-cone axis) changes randomly between duty cycles, i.e. from one activity cycle of BH to another.
-
–
-
•
With cooling, SF and BH growth, energy output from BH accretion rate (§2.4): Metals are generated according to the stellar evolution and chemical enrichment model described in §2. Six of our simulations have a single mode of accretion considering all the gas (of any temperature) around BH, using in the Bondi accretion rate. One run has the cold accretion model (Steinborn et al., 2015), using and .
-
–
SF : star-formation, stellar evolution, and chemical enrichment only (no BH).
-
–
thr : thermal feedback from BH, with .
-
–
kin10k : kinetic feedback from BH, with , km/s.
-
–
unf : unified feedback model (a combination of BH thermal and kinetic feedback), where the mechanical outflow power is coupled to the gas in the kinetic form.
-
*
unf10k : , km/s.
-
*
unf5k : , km/s.
-
*
unf10kLo : , km/s.
-
*
unf10kHi : , km/s.
-
*
unf10kLoCA : cold gas accretion model, unified feedback, with , and km/s.
-
*
-
–
Note that the escape velocity of our cluster halo is km/s. Therefore both the values of explored in our models are above the cluster escape speed.
3 Results: Constant-Energy Output from BH at Fixed Duty-Cycle
3.1 Formation of Bubble-like Outflows

Kinetic energy feedback imparted to the gas creates bipolar bubble-like outflows, originating from the central BH, and propagating radially outward up to a few kpc. The morphology and structure of a representative outflow for the constant-energy case is plotted in Fig. 2, showing the projected gas kinematics in the inner kpc region of run c5k at an evolution time Gyr. Gas is kicked with km/s in bi-cone volume around the BH along a fixed direction (revealed by the red outflowing velocity arrows in the bottom-right panel), and propagates outward. It shocks with the surrounding slower-moving gas, and leads to the formation of outflowing bubble-like structures. The developed outflowing bubbles are hot (visible as red areas in the temperature plot), in the face-on plane (middle-left panel) shaped as spherical-shell, and in the edge-on plane (middle-right panel) as extended bipolar terminated with an outer elliptical-shaped shock. The bubbles consist of low-density gas (first row).
The time of Gyr plotted in Fig. 2 corresponds to a part of the first outburst cycle of the BH. The dense core of the cluster (red areas in the density panels) is still cool at this time, visible as the blue central region in the temperature panels. However, the cool-core is destroyed within three or four activity cycles of the BH, and the center is heated up, as will be described later.

Fig. 3 presents the radial profiles of gas properties at three different time epochs in run c10k. The curves denote the median value of the relevant property in radial bins, and the shaded areas enclose the th percentiles above and below the median, showing the radial scatter. The median quantities at the three different times are indistinguishable from each other at larger radii: kpc. BH feedback imparted to the gas affects the median property at kpc, and the radial scatter up to further out kpc. The central gas kicked into wind with km/s thermalizes its kinetic energy in the form of shocks, and generates bubble-like structures propagating outward. The outflows are visible as rise in the radial scatter (shaded areas) in Fig. 3: hot (top-right panel) reaching temperature as high as K, high-entropy (bottom-right), low-density (top-left), and high-pressure (bottom-left).
The earliest time plotted: Gyr (black curve with square symbols) is an epoch of the first active period of the BH. The cyan shaded area shows the first outflow propagation, extending over kpc. During every AGN-on active period ( Myr), such a large outflow originates from the center and disperse out, moving up to a distance few kpc during the time the central AGN is off ( Myr); before another one starts at the next active cycle. The region kpc continues to accumulate these hot, high-entropy, low-density bubbles; visible as the yellow and grey shaded areas Fig. 3. The blue curve with triangles ( Gyr) is a later time AGN-on active epoch at the th cycle; the yellow shaded area displays both an originating bubble at s kpc, and the previous accumulated bubbles at s kpc. The red curve with asterisks ( Gyr) is an inactive epoch after the th cycle when the AGN is off; the grey shaded area displays the previous accumulated bubbles at s kpc. The bubble-like outflows propagate radially outward up to kpc, signalled by a reduction in the radial scatter at larger radii. The sharp drop of the radial scatter reveals the termination shock, where the outflowing gas motion slows down.
3.2 Evolution of the Cool Core
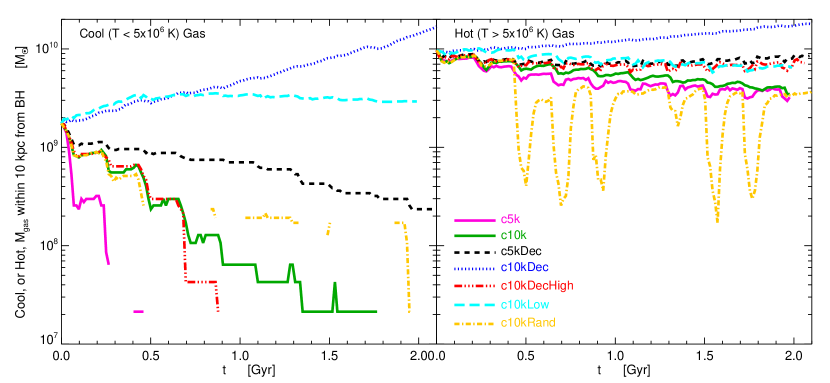
The initial cool core of the cluster is heated up in several simulations with constant-energy output from the BH, within a time-period depending on the parameter values of the kinetic feedback model. Fig. 4 presents the masses of cool and hot components of the gas at the cluster center, lying within distance kpc from the BH, versus evolution time, in the seven constant-energy runs. The different curves are for various AGN feedback models, distinguished by the colors and linestyles, as labelled and written in the caption. Here we define cool gas as that of temperature K which is shown in the left panel, and hot gas has K plotted in the right panel. Such a temperature was chosen for the cool/hot distinction based on the IC. As seen in Fig. 1 - blue curve with asterisks, the cool core has a median K in our initial cluster profiles, and the maximum median temperature is K at a larger radii.
The hot-phase is the dominating component at the center over the cool-phase in all the runs, except c10kDec where the cool-phase dominates after Gyr, reasons for which is elaborated below. According to the IC (§2.1), the cluster inner region consists of dense, cold, low-entropy gas (blue curve in Fig. 1), when the BH is created and allowed to eject feedback energy. At more gas cools, gets denser and sinks to the center, tending to enlarge the cool core in the absence of anything else.
Kinetic feedback from the BH acts as a heating source here. A fraction of gas selected from the cool-core reservoir, in particular particles within a bi-cone volume inside the smoothing length of the BH, kpc, are chosen and kicked to a higher velocity. This drives some of the innermost gas out, and ejects it to larger distances in the form of bubble-like outflows (§3.1). The mass kick out rate in our sub-resolution model, example for run c10k, is: /yr. When the AGN is on for Myr, a total mass of gas is kicked to a higher speed ( km/s). The total mass outflown from the central kpc is mostly cool gas. The hot (dominating phase), and consequently the total (cool hot) central gas mass remains almost constant with time.
The kicked fast wind undergoes shock with the slower-moving gas surrounding it, which are visible in Fig. 3 as the temperature jumps of the shaded areas, and were described in §3.1. The interactions cause the imparted kinetic energy to be thermalized, heating up the cluster cool core. It is revealed in the left panel of Fig. 4 by the decrease of cool gas mass with time. The default output BH power of erg/s is able to heat up the core in the cases where the kicked wind particles are always coupled to hydrodynamic interactions: c5k within Gyr, c10k and c10kRand by Gyr. For a constant output BH power, is proportional to (Eq. 3). So the mass outflow rate is times higher with km/s over km/s. This causes times more central gas mass to be kicked in runs c5k and c5kDec, than in c10k and c10kDec. This depletes the inner cool gas faster with km/s.
As the extreme opposite case, when wind particles are kicked with km/s and decoupled from hydrodynamic interactions up to kpc (run c10kDec, blue dotted curve), it produces increased cooling at the center, when the cool gas mass rises with time. This is because the imparted kinetic energy is thermalized at kpc, and does not have any effect at the center. The central dense gas continues to cool to K here. The gas is kicked into wind at the same rate in runs c10k and c10kDec, however the cool core remains in case c10kDec. This demonstrates that the hydrodynamical interactions of the kicked wind with the surrounding gas (occurring in the coupled wind case c10k) plays an important role in destroying the cool core.
A higher output BH power erg/s applied to the same wind-decoupled run (c10kDecHigh, red dash-dot-dot-dot curve) heats up the core completely within Gyr. The wind-decoupled case with default output BH power and lower velocity km/s (run c5kDec, black dashed curve) depletes the cool central gas ( times reduction in cool mass in Gyr), albeit rather slowly, since is times higher than in run c10kDec.

Fig. 5 shows the time evolution of mass (cooling - heating) rate of the gas in the constant-energy runs. In computing this net cooling rate, we consider gas lying inside distance kpc and of temperature K as cold. Positive values indicate net cooling of the gas, and negative values indicate net heating. The periodic negative spikes indicate the AGN outburst heating at the rate /yr. During AGN-off periods there is cooling at the rate /yr, except run c10kDec where the cooling rate is higher.
The lower output BH power erg/s having always coupled wind (run c10kLow, cyan long-dashed curve) maintains the cool core, with the inner cool gas mass (Fig. 4) remaining almost constant over time. In this case, the smaller amount of energy injected allows cooling to occur at a rate few /yr even after Gyr, which keeps the cluster core in nearly thermal equilibrium.
We find that if the direction of imparting kinetic feedback changes randomly from one activity cycle of BH to another (run c10kRand, yellow dash-dot curve), it has a significant impact on the central hot gas mass. It is revealed by the decrease of inner hot gas mass by times or more (large spikes in the right panel of Fig. 4) during certain activity cycles, while returning back to the original value after Myr. Here the hot gas is expelled outside kpc from the central BH, by strong kinetic feedback, which is much more efficient with the change of the feedback direction between duty cycles of BH.

Fig. 6 displays the radial profiles of gas properties in the constant-energy runs at an evolution time Gyr. The radius is computed by the distance from the BH location, and we have checked that the BH remains within kpc from the cluster center, which is the origin of our spherical coordinates. The profiles of the seven runs are indistinguishable from each other at larger radii: kpc for density (top-left panel) and pressure (bottom-left); kpc for temperature (top-right) and entropy (bottom-right). Kinetic feedback from the BH affects the gas properties at only the regions inner to these radii. It expels some central gas in the form of high-velocity outflows, which thermalize their energies and shock-heat the core. The core heating is exhibited by the median temperature remaining high K in the inner regions. This corresponds to a central entropy flattening, keV cm2.
The cluster core is heated to K and having a flat entropy profile, by a time Gyr in five runs: c5k, c10k, c5kDec, c10kDecHigh, and c10kRand. Kinetic feedback from the BH is less efficient in two runs, where the initial cool core ( K) remains: c10kDec (blue dotted curve in Fig. 6) where the kinetic energy is thermalized too far away from the center, and c10kLow (cyan long-dashed) where the low output power keeps the cluster core in nearly thermal equilibrium. These cool-core clusters have a times higher central density than the cases where the core is heated. The pressure variation between different models is smaller than the variations in other gas properties, because pressure mostly depends on the background potential which is static in our simulations.
3.3 Resolution Study

We perform a higher resolution simulation c10kHR with times more number of particles (Table 1) than our default resolution cases. We chose the constant-energy setup for our resolution study because it is the simplest with no star-formation (i.e. free from resolution dependence of the star-formation model), thus here the resolution effect of the AGN energy injection scheme can be better identified. c10kHR employs the same model parameters as run c10k. Fig. 7 shows the masses of cool and hot components of the gas at the cluster center, lying within distance kpc from the BH, versus evolution time, in these two different resolution runs. We find that the cluster cool core is heated up faster in the high-resolution case, as seen in the left panel of Fig. 7. The inner cool gas mass decreases with time and is depleted within Gyr in run c10kHR (red dashed curve), which is almost half the time needed in the lower resolution case c10k (green solid curve).

Fig. 8 presents the radial profiles of gas properties at two different epochs in runs c10k and c10kHR. The varying resolution brings a difference in the median profiles at kpc. Bubble-like outflows are visible as rise in the radial scatter (shaded areas): hot (middle panel) reaching temperature as high as K, high-entropy (right) and low-density (left). The pressure profile remains the same in the different resolution runs, and we do not show it here. The blue curves ( Gyr) depict an epoch of the first active period of the BH. The red curves ( Gyr) are a later time AGN-on active epoch. Comparing the cyan and grey shaded areas, we see that the inner bubble starts from a smaller radii at high-resolution, and extends up to a shorter distance. The outer bubble signatures, extending over kpc, remain the same when resolution is varied.
Comparing between the solid and dashed curves at each epoch in Fig. 8, we see that the cluster core is heated more at high-resolution, entropy is higher, and the density is lower. However the differences are not large and remain within a factor of . Moreover, the profiles at the two resolutions show an excellent degree of convergence at length scales larger than kpc.
We thus find that convergence is not reached strictly in our simulations. Our implementation of kinetic AGN feedback is more effective at higher resolution. Full convergence cannot be expected using the same parameter values within the framework of our sub-resolution models. This is because feedback energy is distributed to the local gas, and higher gas densities are resolved in the high-resolution case. As discussed in Barai et al. (2014) (§4, paragraph 9), the lack of convergence implies that different model parameters (e.g. ) are required at different resolution in cosmological simulations to have the same fit to observational correlations (e.g. BH mass versus host galaxy stellar velocity dispersion).
In a contemporary work investigating numerical resolution, Bourne, Zubovas & Nayakshin (2015) studied the behaviour of AGN feedback when force and mass resolution are varied. They found that an increase of resolution results in a less effective ejection of the gas by AGN feedback. The result we obtain here is at variance with theirs. We however note that both the resolution and coupling of the AGN energy to the gas is quite different in our work with respect to Bourne, Zubovas & Nayakshin (2015). They simulated the interaction of an AGN outflow with the clumpy turbulent gas in the inner part of the host galaxy on length scales from to kpc, which is smaller than ours ( kpc). Feedback-resistant high-density clumps are washed out at low effective resolutions in their simulations, whereas such clumps never form in our simulations. Our mass resolution is typical of that of a cosmological simulation of galaxy clusters, thus our gas particle mass is at least an order of magnitude higher than theirs. Moreover, in that paper the coupling of energy is done by injecting thermal energy. Hence in our opinion, the point of numerical convergence is still open, since it can easily depend on both the simulation force and length scales and on the precise scheme adopted for the energy deposition onto the gas.
4 Results: BH Growth and Energy Output from BH Accretion
A BH is seeded at the cluster center at according to our IC (§2.1), of initial mass (§2.5). In the next eight simulations with cooling, SF and BH accretion, the BH grows in mass by accreting gas from its surroundings, and consequently outputs feedback energy (§2.4). We find that kinetic feedback-induced gas outflows are created, at the times when the BH undergoes a high accretion rate. The cluster core is heated eventually when using higher values of the feedback efficiency parameter.
4.1 Black Hole Accretion and Mass Growth

The time evolution of BH mass accretion rate () is presented in Fig. 9, top panel. The middle panel displays the Eddington ratio . The eight runs with different AGN feedback models are distinguished by the colors and linestyles, as labelled in the bottom panel and caption. At , the /yr is very low and rises slowly with time. From Gyr, the has a power-law increase, corresponding to the Eddington-limited growth of the BH (where Eddington ratio ), up to a time Gyr, to reach a peak of . As an example, the peak of /yr in run unf10k occurs at Gyr.
Kinetic feedback (run kin10k, red dash-dot curve) produces a times larger peak than thermal feedback (thr, blue solid) using the same . After its peak, the reduces in the runs with kinetic feedback (kin10k and the unf cases), because significant amounts of gas are ejected from the center and/or heated up, limiting the gas feeding onto the BH. While in the thermal feedback run thr, the is almost constant after the peak, because cold gas remains at the center here, retaining the cool core.
There are fluctuations in the , whereby it increases or decreases by a factor of up to in Gyr. A noteworthy feature is the huge variability of in run unf10kLoCA at Gyr. Here the inclusion of cold gas accretion results in fluctuating by a factor of up to , with a periodicity of Myr.

The BH mass versus evolution time is plotted in Fig. 10, top-left panel. All the feedback models have the BH growing in a qualitatively similar manner. Starting from the given seed mass of , each BH has an exponential growth. Over the time range Gyr to Gyr, its mass increases by a factor to . After Gyr, comes to an almost steady state, having a very slow subsequent growth. The final reached at Gyr depends on the model: e.g. in run unf10k. is inversely proportional to in the unified feedback model (runs unf10kLo: yellow dash-dot-dot-dot curve, unf10k: black dashed, unf10kHi: purple dotted; using ). This is due to self regulation of the BH growth (see also e.g. Booth & Schaye, 2009), and is analytically expected when the BH feedback energy is derived from (Eq. 8). A higher imparts a stronger feedback ejecting out more central gas, and yields a less-massive BH than a lower .
The BH mass is also inversely proportional to the kick velocity for unified feedback (runs unf5k: green long-dashed, and unf10k: black dashed; using and km/s), which is contrary to naive expectations. Note that Barai et al. (2014) saw a direct proportionality of with , for kinetic feedback in isolated galaxies and mergers. This is analytically expected because on increasing , decreases (inverse proportionality in Eq. 10). The reduced mass outflow rate of kinetic feedback ejects out less gas. Hence, more gas is available for accreting onto the BH, which grows more massive. We posit that the discrepancy between the two studies arises from the simulation setup. Here the BH kicks out central gas within a cluster atmosphere, and at later times some of the ejected gas falls back in, after slowing down by interacting with the further-out intracluster gas. Whereas in Barai et al. (2014), once the kicked gas escaped the galaxy, it never came back.
4.2 Formation of Stars
Stars form in the isolated cluster from dense gas according to the SF prescription described in §2. The SF occurs within a few kpc region at the cluster center where the gas inflows and cools, forming an initial cool core. The presence of a BH decreases the central gas content, as some gas is accreted in, some gas is ejected by feedback, and some gas is heated; which consequently quenches SF.
The total star formation rate versus time is displayed in the bottom panel of Fig. 9, for eight runs with different AGN feedback models. At there is an initial burst of SF at a rate /yr, because of our simulation IC: the cluster already has substantial amounts of cold, dense gas in the form of a cool core, which readily form stars when SF is allowed in the model. It reduces by times soon afterward, because of reduced central gas, which has depleted by the initial SF burst. The SFR increases almost linearly with time from Gyr, as more gas cools, gets dense and is converted to stars. There are periodic fluctuations in the SFR, when it would decrease by a factor of , occurring because of supernovae feedback in the stellar evolution model. All the runs show this rising SFR initially, which continues to increase with time in the SF case without a BH.
The models start to deviate from Gyr onwards, when the BH has grown to a high-mass and generates enough feedback suppressing SF. Thermal feedback (run thr, blue solid curve) quenches SF at Gyr, the SFR is lower than the SF case (magenta solid curve) by up to a factor of . Kinetic feedback (kin10k and the unf cases) causes a greater suppression of SFR up to few times lower than the SF run, because significant amounts of gas are ejected from the center. As an example, in run unf10k (black dashed curve) the SFR is reduced from /yr at Gyr to /yr at Gyr.
Fig. 10, top-right panel displays the time evolution of mass of stars formed from gas via SF. Gas is continuously converted to stars by the rising SFR initially, for all the AGN models. The stellar mass hence increases with simulation time up to Gyr, by when a total of stars has been formed, an amount which is comparable to the hot gas mass in the central kpc of the cluster. After Gyr, continues to rise with time in the SF case. also increases with thermal feedback albeit with a smaller slope. While in the runs with kinetic feedback remains constant as no more new stars are formed by the hugely quenched SFR.
4.3 Evolution of the Cool Core by Growing BH Feedback
The initial cool core of the cluster is heated, by energy feedback from the growing BH, to different extents depending on the model parameter values. The bottom row of Fig. 10 presents the masses of cool and hot components of gas within a distance kpc from the BH location, versus evolution time. Here cool gas is that of temperature K shown in the bottom-left, and hot gas has K plotted in the bottom-right panel.
The hot phase dominates at the cluster center over the cool phase in all the runs, except SF (magenta solid curve) where the two phases become comparable after Gyr. The hot gas mass increases slowly with time, initially for all the models to reach at Gyr. This rising is caused by the inflow of hotter gas from the surroundings, because of gas depletion near the center by cooling-induced SF. continues to rise for three runs: SF, thr, unf10kLo, which has either no or low BH feedback. While reduces subsequently for five runs: kin10k, unf10k, unf5k, unf10kHi, unf10kLoCA, decreasing by times from Gyr to Gyr, showing the influence of strong kinetic feedback in these cases where significant amount of central gas outflows.
A fraction of gas cools with time, gets denser, and sinks to the cluster inner region, forming a cool core. Initially the BH is small and does not exert enough feedback to influence the gas. Therefore the cool gas mass within the inner kpc increases with time up to at Gyr. By this time the BH has grown to . Subsequently the BH exerts substantial kinetic feedback energy heating the cool core with some parameters, revealed in the bottom-left panel of Fig. 10 by the decrease of cool gas mass with time.
All the models with kinetic feedback (kin10k and unf runs) heat the core, reducing the cool gas to by Gyr. In the case unf10kLo (yellow dash-dot-dot-dot curve), increases again forming a local peak between the time range Gyr, because it uses the smallest and the low feedback allows some gas to cool at late times. With no BH feedback, run SF produces increased cooling at the center, when the cool gas mass monotonically rises with time. Thermal feedback (thr, blue solid curve) is able to deplete some of the cool central gas, which reduces by times at Gyr, but increases again later, showing that fraction of the cool core remains.
Run unf10kLoCA presents features similar to the variability of (§4.1) at Gyr. Cold gas accretion results in the cool and hot gas mass fluctuating by a factor of up to , with a periodicity of Myr.
Fig. 11 displays the radial profiles of gas properties in the simulations with cooling, SF and BH growth, at an evolution time Gyr. The profiles of the eight runs are indistinguishable from each other at larger radii kpc. BH accretion and feedback influence the gas properties in the inner regions ( kpc) only. Some central gas is expelled as high-velocity outflows by kinetic BH feedback, which thermalize their energies and shock heat the core. The core heating is exhibited by the median temperature (top-right panel) remaining high K in the inner regions. This corresponds to a central entropy flattening, keV cm2 (middle-right panel).
The cluster core is heated to K with a flat entropy profile, by a time Gyr in five runs: kin10k, unf10k, unf5k, unf10kHi, unf10kLoCA. The initial cool core (central K) remains in three runs: SF where there is no BH, thr since thermal feedback is less effective, and unf10kLo where the kinetic feedback power is low because of the smallest value used. These cool-core clusters have a times higher central density, and up to times higher central pressure, than the cases where the core is heated up.
We compute the total gas metallicity, , as the ratio of all metal mass to the total gas mass for each gas particle. Abundance ratios are expressed in terms of the Solar metallicity, which is (mass fraction of all metals in Sun) derived from the compilation by Asplund, Grevesse & Sauval (2005). The gas metallicity radial profiles are plotted in the bottom-left panel of Fig. 11. The metallicity profiles are very steep, since metals are produced in the star-forming gas, concentrated inside the central kpc. The median metal abundance at kpc reaches a few times Solar in runs thr and unf10kHi, and reduces by 4 orders of magnitude at kpc. We checked that the run SF (where there is no BH, and hence the largest star formation rate) generates the highest median metallicity among all the runs of at kpc.
The gas cooling time is: , where is the net cooling rate. We adopt the cooling rate from the analytical formula (Equation 9) in Fujita et al. (2016), which is a function of temperature and metallicity. It accounts for Bremsstrahlung () and metal line cooling () terms, and approximates the cooling function derived by Sutherland & Dopita (1993). The radial profiles are plotted in the bottom-right panel of Fig. 11. The cooling time becomes shorter than Gyr at kpc. At the same time we note that this estimate includes Bremsstrahlung and metal line cooling only, and does not include radiative heating from photoionizing radiation of the UV/X-ray background. The in run unf10kLoCA has a gently flattening core with no central abrupt fall, which are observationally favorable features. This affirms that both cold accretion and a low efficiency are crucial to produce a proper self-regulated AGN feedback loop.
5 Discussion
In this study we explore a distinct mode of AGN feedback: kinetic coupling of the energy output from the central BH. It is implemented within our larger suite of sub-resolution models: metal-dependent radiative cooling and heating, star-formation, stellar evolution and chemical enrichment. We perform simulations of isolated cool-core clusters, starting from an idealized set-up of a hydrostatic atmosphere with no stars. Our simulations produce a stellar mass of a few times after Gyr; since forming stars with our IC is a slow process, with timescale of Gyrs, slower than timescale for feedback onset.
We do not want to perform any comparison with observational data, because our initial condition do not resemble a real poor cluster, and hence have not done any parameter tuning here to match observations. Our aim is to explore the results of the new kinetic AGN feedback numerical implementation and assess its effectiveness, emphasising on the differences from our thermal feedback. The current work is also a step toward building a model of unified AGN feedback in cosmological simulations; which we will run in the future, and where we will do the relevant parameter tuning.
At our current resolution, we do not resolve the physical blast of thermal feedback. Also at our resolved scales, we are not simulating the real AGN jet propagation using our kinetic feedback numerical scheme. Here we only attempt to capture the effect of the energy deposition of the mechanical jets from AGN at large ( kpc) scales.
Our finding that the cool core is destroyed within duty cycles using a fixed BH power of erg/s, is inconsistent with observational X-ray data. The lower BH power erg/s is a more observationally consistent parameter value to maintain the cool core. Previous simulations (e.g., Gaspari et al., 2011a) have found that BHs, which output a fixed power with fixed duty cycles, are not properly self-regulated, thus they tend to produce overheating or overcooling of cluster cool cores in the long run.
Our results reveal the challenges of devising numerical schemes for sub-resolution models, which must capture the physical processes given the numerical resolution. With regard to implementing AGN feedback in galaxy-scale simulations, the AGN output power is injected to the gas located near to the BH. The gas in these central regions can be very dense, hence immediately and non-physically can radiate the injected energy away. Such problems are numerical in nature, which especially impacts our thermal feedback results.
We demonstrate that our kinetic AGN feedback is more effective than thermal AGN feedback, when implemented together with cooling, SF, stellar evolution and chemical enrichment. This statement might sound unphysical. But as Barai et al. (2014) discussed in detail, the implementation of BH thermal feedback is less efficient within the framework of the multiphase effective sub-resolution model of star-formation by Springel & Hernquist (2003), where SF is based on a density threshold only. The thermal energy deposited to the gas particles which are multiphase (and star-forming) is radiated away quickly, since they are dense. And they attain the effective equation-of-state temperature dictated by their density.
The feedback efficiency (Eq. 8) is an important parameter of AGN feedback models, which determines what fraction of the energy from the BH couples to the surrounding gas. Cosmological simulations generally calibrate its value to reproduce the BH mass versus host galaxy stellar bulge mass or velocity dispersion relations at (e.g., Magorrian et al., 1998). Various studies have used different values: together with (Springel, Di Matteo & Hernquist, 2005); increasing to during radio-mode when the BH accretion rate is smaller than times the Eddington rate (Fabjan et al., 2010); with in quasar-mode and in radio-mode (Ragone-Figueroa et al., 2013); (Booth & Schaye, 2009); in quasar-mode and in radio-mode (Dubois et al., 2013).
Using such high values of , on the other hand, leads to the overheating of the cool core (Fig. 10), which is in contrast to X-ray observations depicting a tight self-regulated balance between heating and cooling (e.g., preserving the observed positive X-ray temperature profile gradient for several Gyr). For instance, Gaspari et al. (2011a, b); Gaspari, Brighenti & Temi (2012); Gaspari, Ruszkowski & Sharma (2012) find, in high-resolution simulations of isolated clusters, that to quench cooling flows, at the same time avoiding both overheating and overcooling, the typical mechanical efficiency for poor clusters is . Prasad, Sharma & Babul (2015) saw that AGN feedback is able to suppress cooling/SF using a feedback efficiency as low as , and the simulations show cold gas and jet cycles even after several Gyr. Factoring out the , these efficiencies translate to , i.e., lower than that typically used in cosmological simulations. Such low can be analytically retrieved by equating the observed jet power to the core X-ray luminosity. Observationally, Merloni & Heinz (2008) solved the continuity equation for the black hole mass function using the locally detected one as boundary condition, and the hard X-ray luminosity function of the AGN growth rate distribution, and found that the kinetic efficiency is a few .
Our choice of default in this work is motivated by cosmological simulations, which uses similar order values, also we have explored and to cover the parameter space.
Supernovae-driven kinetic feedback is not included in our simulations, so that the central SMBH is the sole source of energy feedback, and to unambiguously infer any outflow as driven by AGN. In most of our second-series runs with cooling, SF and BH growth, the cool core is heated up by strong AGN feedback. The influence of supernovae feedback is expected to be sub-dominant at the cluster center.
The more efficient kinetic feedback that we find here compared to thermal feedback (used in all our cluster simulations before) is promising in helping to solve problems pointed out by Ragone-Figueroa et al. (2013), in particular the still too large mass and too big effective radius of the brightest cluster galaxies.
6 Summary and Conclusion
We investigate different models of AGN feedback in cluster simulations, using the SPH code GADGET-3. We implement novel methods to couple the feedback energy from a SMBH in the kinetic form, where the velocity of the neighbouring gas is incremented. Gas particles lying inside a bi-conical volume around the BH (cones of slant height and opening angle along two opposite directions) are stochastically selected and imparted a one-time velocity boost. This renders our code able to generate outflows driven by AGN feedback in a self-consistent way.
We perform simulations of isolated cluster of total mass , containing gas particles, using a gravitational softening length of kpc. The cluster is first evolved using hydrodynamical interactions only for Gyr, subsequently using cooling and hydrodynamics for further Gyr, which forms a dense cool core, which is taken as our initial condition. A collisionless BH particle is created at this time (renamed ), residing at the cluster center, having a seed BH mass of .
Our simulations form two broad series, each having the same non-AGN sub-resolution physics, and the runs in it explore different AGN feedback models. The first series includes simulations with cooling-only, no-SF, constant energy feedback from BH at fixed duty-cycle; the second series includes cooling, SF, BH undergoing gas accretion, mass growth and resulting feedback. In particular, five of our runs in the latter series employ the “unified” AGN model presented in Steinborn et al. (2015). Here, we use the mechanical outflow power as the source of energy for our kinetic feedback, and build an improved form of unified AGN feedback model.
Our main results are:
-
•
Bipolar bubble-like outflows form, originating from the BH, and propagating radially outward to a distance of a few kpc. The cluster cool core is shock heated in several runs, to a median temperature K, which corresponds to a central entropy flattening, keV cm2. A large outflow originates during each AGN-on active period.
-
•
The output BH power erg/s heats up the cool core in the runs where the kicked particles are always hydrodynamically coupled. Wind particles decoupled from hydrodynamics do not have any heating effect at the center, unless the power is increased by a factor of . BH feedback is less efficient in two runs (one with a lower BH power) where the initial cool core remains.
-
•
When allowing the BH to grow, the BH accretion rate has a power-law increase, to reach a peak of few times /yr (values depending on the feedback model). After the peak, the reduces times in the runs with kinetic feedback and remains almost constant with thermal feedback.
-
•
The total star formation rate increases with time initially; then the growing BH accretes in, heats up, and ejects out some central gas, quenching SF. The SFR is reduced times with thermal, and times by kinetic feedback. Thus, kinetic feedback is more efficient in quenching the SFR. The same is true for the inner cool gas mass.
-
•
Kinetic feedback is more effective and has a stronger impact on the cluster central gas than thermal feedback using the same feedback efficiency, within our implementation of star-formation model.
-
•
The inclusion of cold gas accretion in the simulations with BH growth shows huge variability of the and inner cool/hot gas masses, thus produces naturally a duty cycle of the AGN with a periodicity of Myr.
-
•
The unified feedback model, where we use our kinetic scheme to distribute the mechanical AGN power, is basically as good as the pure kinetic one in quenching the SFR, heating the cool core and raising its central entropy level. We emphasize again that the same result cannot be obtained using purely thermal feedback.
In this paper we have presented an implementation of AGN feedback in the kinetic form in an SPH code. The results presented here further demonstrate the relevance of explicitly describing the mechanical nature of the radio-mode AGN feedback to create a self-regulated cooling-heating cycle in the core regions of isolated halos having the size of a galaxy cluster. We consider this as quite encouraging in view of the forthcoming application of our implementation of mechanical AGN feedback in cosmological simulations.
Acknowledgments
We are most grateful to Volker Springel for allowing us to use the GADGET-3 code. We thank Lisa Steinborn, Klaus Dolag, and Alexander Beck for useful discussions. Simulations were run at the CINECA Supercomputing Center, with CPU time assigned through an ISCRA Class-C proposal, and through an INAF-CINECA grant. Data postprocessing and storage has been done on the CINECA facility PICO, granted to us thanks to our expression of interest. This work is supported by the PRIN-MIUR 201278X4FL “Evolution of cosmic baryons” funded by the Italian Ministry of Research, by the PRIN-INAF 2012 grant “The Universe in a Box: Multi-scale Simulations of Cosmic Structures”, by the INDARK INFN grant, and by Consorzio per la Fisica di Trieste. M.G. is supported by NASA through Einstein Postdoctoral Fellowship Award Number PF-160137 issued by the Chandra X-ray Observatory Center, which is operated by the Smithsonian Astrophysical Observatory for and on behalf of NASA under contract NAS8-03060.
References
- Alouani Bibi et al. (2007) Alouani Bibi, F., Binney, J., Blundell, K. & Omma, H. 2007, Ap&SS, 311, 317
- Asplund, Grevesse & Sauval (2005) Asplund, M., Grevesse, N. & Sauval, A. J. 2005, ASPC, 336, 25
- Barai & Wiita (2006) Barai, P. & Wiita, P. J. 2006, MNRAS, 372, 381
- Barai & Wiita (2007) Barai, P. & Wiita, P. J. 2007, ApJ, 658, 217
- Barai (2008) Barai, P. 2008, ApJ, 682, L17
- Barai, Martel & Germain (2011) Barai, P., Martel, H. & Germain, J. 2011, ApJ, 727, 54
- Barai, Proga & Nagamine (2012) Barai, P., Proga, D. & Nagamine, K. 2012, MNRAS, 424, 728
- Barai et al. (2013) Barai, P. et al. 2013, MNRAS, 430, 3213
- Barai et al. (2014) Barai, P., Viel, M., Murante, G., Gaspari, M. & Borgani, S. 2014, MNRAS, 437, 1456
- Basson & Alexander (2003) Basson, J. F. & Alexander, P. 2003, MNRAS, 339, 353
- Bauer et al. (2005) Bauer, F. E., Fabian, A. C., Sanders, J. S., Allen, S. W. & Johnstone, R. M. 2005, MNRAS, 359, 1481
- Birzan et al. (2004) Birzan, L., Rafferty, D. A., McNamara, B. R., Wise, M. W. & Nulsen, P. E. J. 2004, ApJ, 607, 800
- Blandford (1976) Blandford, R. D. 1976, MNRAS, 176, 465
- Bohringer et al. (1995) Bohringer, H., Nulsen, P. E. J., Braun, R. & Fabian, A. C. 1995, MNRAS, 274, L67
- Bohringer et al. (2002) Bohringer, H., Matsushita, K., Churazov, E., Ikebe, Y. & Chen, Y. 2002, A&A, 382, 804
- Bondi & Hoyle (1944) Bondi, H. & Hoyle, F. 1944, MNRAS, 104, 273
- Bondi (1952) Bondi, H. 1952, MNRAS, 112, 195
- Booth & Schaye (2009) Booth, C. M. & Schaye, J. 2009, MNRAS, 398, 53
- Bourne, Zubovas & Nayakshin (2015) Bourne, M. A., Zubovas, K. & Nayakshin, S. 2015, MNRAS, 453, 1829
- Brighenti & Mathews (2006) Brighenti, F. & Mathews, W. G. 2006, ApJ, 643, 120
- Bruggen & Kaiser (2002) Bruggen, M. & Kaiser, C. R. 2002, Nature, 418, 301
- Bruggen et al. (2005) Bruggen, M., Ruszkowski, M. & Hallman, E. 2005, ApJ, 630, 740
- Bruggen & Scannapieco (2009) Bruggen, M. & Scannapieco, E. 2009, MNRAS, 398, 548
- Burns (1990) Burns, J. O. 1990, AJ, 99, 14
- Carilli, Perley & Harris (1994) Carilli, C. L., Perley, R. A. & Harris, D. E. 1994, MNRAS, 270, 173
- Cattaneo & Teyssier (2007) Cattaneo, A. & Teyssier, R. 2007, MNRAS, 376, 1547
- Cavagnolo et al. (2009) Cavagnolo, K. W., Donahue, M., Voit, G. M. & Sun, M. 2009, ApJS, 182, 12
- Chabrier (2003) Chabrier, G. 2003, PASP, 115, 763
- Chartas, Brandt & Gallagher (2003) Chartas, G., Brandt, W. N., & Gallagher, S. C. 2003, ApJ, 595, 85
- Choi et al. (2004) Choi, Y.-Y., Reynolds, C. S., Heinz, S., Rosenberg, J. L., Perlman, E. S. & Yang, J. 2004, ApJ, 606, 185
- Choi et al. (2012) Choi, E., Ostriker, J. P., Naab, T. & Johansson, P. H. 2012, ApJ, 754, 125
- Choi et al. (2014) Choi, E., Naab, T., Ostriker, J. P., Johansson, P. H. & Moster, B. P. 2014, MNRAS, 442, 440
- Choi et al. (2015) Choi, E., Ostriker, J. P., Naab, T., Oser, L. & Moster, B. P. 2015, MNRAS, 449, 4105
- Churazov et al. (2005) Churazov, E., Sazonov, S., Sunyaev, R., Forman, W., Jones, C. & Bohringer, H. 2005, MNRAS, 363, L91
- Cicone et al. (2014) Cicone, C. et al. 2014, A&A, 562, A21
- Crenshaw, Kraemer & George (2003) Crenshaw, D. M., Kraemer, S. B., & George, I. M. 2003, ARA&A, 41, 117
- Croton et al. (2006) Croton, D. J. et al. 2006, MNRAS, 365, 11
- Dalla Vecchia et al. (2004) Dalla Vecchia, C., Bower, R. G., Theuns, T., Balogh, M. L.; Mazzotta, P. & Frenk, C. S. 2004, MNRAS, 355, 995
- Di Matteo, Springel & Hernquist (2005) Di Matteo, T., Springel, V. & Hernquist, L. 2005, Nature, 433, 604
- Di Matteo et al. (2008) Di Matteo, T., Colberg, J., Springel, V., Hernquist, L. & Sijacki, D. 2008, ApJ, 676, 33
- Dubois et al. (2010) Dubois, Y., Devriendt, J., Slyz, A. & Teyssier, R. 2010, MNRAS, 409, 985
- Dubois et al. (2013) Dubois, Y., Pichon, C., Devriendt, J., Silk, J., Haehnelt, M., Kimm, T. & Slyz, A. 2013, MNRAS, 428, 2885
- Dunn & Fabian (2006) Dunn, R. J. H. & Fabian, A. C. 2006, MNRAS, 373, 959
- Everett (2007) Everett, J. E. 2007, Ap&SS, 311, 269
- Fabian (1994) Fabian, A. C. 1994, ARA&A, 32, 277
- Fabian et al. (2003) Fabian, A. C., Sanders, J. S., Allen, S. W., Crawford, C. S., Iwasawa, K., Johnstone, R. M., Schmidt, R. W. & Taylor, G. B. 2003, MNRAS, 344, L43
- Fabian (2012) Fabian, A. C. 2012, ARA&A, 50, 455
- Fabjan et al. (2010) Fabjan, D., Borgani, S., Tornatore, L., Saro, A., Murante, G. & Dolag, K. 2010, MNRAS, 401, 1670
- Ferrarese & Ford (2005) Ferrarese, L., & Ford, H. 2005, SSRv, 116, 523
- Feruglio et al. (2010) Feruglio, C., Maiolino, R., Piconcelli, E., Menci, N., Aussel, H., Lamastra, A. & Fiore, F. 2010, A&A, 518, L155
- Feruglio et al. (2015) Feruglio, C. et al. 2015, A&A, 583, A99
- Fujita et al. (2002) Fujita, Y., Sarazin, C. L., Kempner, J. C., Rudnick, L., Slee, O. B., Roy, A. L., Andernach, H. & Ehle, M. 2002, ApJ, 575, 764
- Fujita et al. (2016) Fujita, Y., Kawakatu, N. & Shlosman, I. 2016, PASJ, 68, 26
- Gaspari et al. (2011a) Gaspari, M., Melioli, C., Brighenti, F. & D’Ercole, A. 2011a, MNRAS, 411, 349
- Gaspari et al. (2011b) Gaspari, M., Brighenti, F., D’Ercole, A. & Melioli, C. 2011b, MNRAS, 415, 1549
- Gaspari, Brighenti & Temi (2012) Gaspari, M., Brighenti, F. & Temi, P. 2012, MNRAS, 424, 190
- Gaspari, Ruszkowski & Sharma (2012) Gaspari, M., Ruszkowski, M. & Sharma, P. 2012, ApJ, 746, 94
- Gaspari, Ruszkowski & Oh (2013) Gaspari, M., Ruszkowski, M. & Oh, S. P. 2013, MNRAS, 432, 3401
- Gaspari (2015) Gaspari, M. 2015, MNRAS, 451, L60
- Gaspari, Brighenti & Temi (2015) Gaspari, M., Brighenti, F. & Temi, P. 2015, A&A, 579, A62
- Granato et al. (2004) Granato, G. L., De Zotti, G., Silva, L., Bressan, A., & Danese, L. 2004, ApJ, 600, 580
- Guo & Oh (2009) Guo, F. & Oh, S. P. 2009, MNRAS, 400, 1992
- Haardt & Madau (1996) Haardt, F. & Madau, P. 1996, ApJ, 461, 20
- Haardt & Madau (2001) Haardt, F. & Madau, P. 2001, XXXVIth Rencontres de Moriond, XXIst Moriond Astrophysics Meeting, Editors D.M.Neumann & J.T.T.Van, 64
- Heinz et al. (2002) Heinz, S., Choi, Y.-Y., Reynolds, C. S., Begelman, M. C. 2002, ApJ, 569, L79
- Hicks, Mushotzky & Donahue (2010) Hicks, A. K., Mushotzky, R. & Donahue, M. 2010, ApJ, 719, 1844
- Hillel & Soker (2016) Hillel, S. & Soker, N. 2016, MNRAS, 455, 2139
- Hirschmann et al. (2014) Hirschmann, M., Dolag, K., Saro, A., Bachmann, L., Borgani, S. & Burkert, A. 2014, MNRAS, 442, 2304
- Hoyle & Lyttleton (1939) Hoyle, F. & Lyttleton, R. A. 1939, Proc. Cam. Phil. Soc., 35, 405
- Johansson, Naab & Burkert (2009) Johansson, P. H., Naab, T. & Burkert, A. 2009, ApJ, 690, 802
- Kaiser & Alexander (1997) Kaiser, C. R. & Alexander, P. 1997, MNRAS, 286, 215
- Katz, Weinberg & Hernquist (1996) Katz, N., Weinberg, D. H. & Hernquist, L. 1996, ApJS, 105, 19
- Khalatyan et al. (2008) Khalatyan, A., Cattaneo, A., Schramm, M., Gottlober, S., Steinmetz, M. & Wisotzki, L. 2008, MNRAS, 387, 13
- Komatsu et al. (2011) Komatsu, E. et al. 2011, ApJS, 192, 18
- King (2003) King, A. 2003, ApJ, 596, L27
- Kirkpatrick & McNamara (2015) Kirkpatrick, C. C. & McNamara, B. R. 2015, MNRAS, 452, 4361
- Komatsu & Seljak (2001) Komatsu, E. & Seljak, U. 2001, MNRAS, 327, 1353
- Kormendy & Richstone (1995) Kormendy, J. & Richstone, D. 1995, ARA&A, 33, 581
- Krongold et al. (2007) Krongold, Y., Nicastro, F., Elvis, M., Brickhouse, N., Binette, L., Mathur, S., & Jimenez-Bailon, E. 2007, ApJ, 659, 1022
- Li et al. (2015) Li, Y., Bryan, G. L., Ruszkowski, M., Voit, G. M., O’Shea, B. W. & Donahue, M. 2015, ApJ, 811, 73
- Lynden-Bell (1969) Lynden-Bell, D. 1969, Nature, 223, 690
- Magorrian et al. (1998) Magorrian, J. et al. 1998, AJ, 115, 2285
- McDonald et al. (2015) McDonald, M. et al. 2015, ApJ, 811, 111
- McNamara et al. (2000) McNamara, B. R. et al. 2000, ApJ, 534, L135
- McNamara & Nulsen (2007) McNamara, B. R. & Nulsen, P. E. J. 2007, ARA&A, 45, 117
- Merloni & Heinz (2008) Merloni, A. & Heinz, S. 2008, MNRAS, 388, 1011
- Mittal et al. (2009) Mittal, R., Hudson, D. S., Reiprich, T. H. & Clarke, T. 2009, A&A, 501, 835
- Monaghan & Lattanzio (1985) Monaghan, J. J. & Lattanzio, J. C. 1985, A&A, 149, 135
- Navarro, Frenk & White (1997) Navarro, J. F., Frenk, C. S. & White, S. D. M. 1997, ApJ, 490, 493
- Nesvadba et al. (2008) Nesvadba, N. P. H., Lehnert, M. D., De Breuck, C., Gilbert, A. M. & van Breugel, W. 2008, A&A, 491, 407
- O’Dea et al. (2004) O’Dea, C. P., Baum, S. A., Mack, J., Koekemoer, A. M. & Laor, A. 2004, ApJ, 612, 131
- O’Dea et al. (2008) O’Dea, C. P. et al. 2008, ApJ, 681, 1035
- Omma & Binney (2004) Omma, H. & Binney, J. 2004, MNRAS, 350, L13
- Omma et al. (2004) Omma, H., Binney, J., Bryan, G. & Slyz, A. 2004, MNRAS, 348, 1105
- Ostriker et al. (2010) Ostriker, J. P., Choi, E., Ciotti, L., Novak, G. S. & Proga, D. 2010, ApJ, 722, 642
- Perna et al. (2015) Perna, M. et al. 2015, A&A, 583, A72
- Peterson & Fabian (2006) Peterson, J. R. & Fabian, A. C. 2006, Physics Reports, 427, 1
- Planelles et al. (2014) Planelles, S., Borgani, S., Fabjan, D., Killedar, M., Murante, G., Granato, G. L., Ragone-Figueroa, C. & Dolag, K. 2014, MNRAS, 438, 195
- Prasad, Sharma & Babul (2015) Prasad, D., Sharma, P. & Babul, A. 2015, ApJ, 811, 108
- Ragone-Figueroa, Granato & Abadi (2012) Ragone-Figueroa, C., Granato, G. L. & Abadi, M. G. 2012, MNRAS, 423, 3243
- Ragone-Figueroa et al. (2013) Ragone-Figueroa, C., Granato, G. L., Murante, G., Borgani, S. & Cui, W. 2013, MNRAS, 436, 1750
- Rasia et al. (2015) Rasia, E., Borgani, S., Murante, G., Planelles, S., Beck, A. M., Biffi, V., Ragone-Figueroa, C., Granato, G. L., Steinborn, L. K. & Dolag, K. 2015, ApJ, 813, L17
- Rees (1984) Rees, M. J. 1984, ARA&A, 22, 471
- Reichard et al. (2003) Reichard, T. A. et al. 2003, AJ, 126, 2594
- Revaz, Combes & Salome (2008) Revaz, Y., Combes, F. & Salome, P. 2008, A&A, 477, L33
- Reynolds, Brenneman & Stocke (2005a) Reynolds, C. S., Brenneman, L. W. & Stocke, J. T. 2005a, MNRAS, 357, 381
- Reynolds et al. (2005b) Reynolds, C. S., McKernan, B., Fabian, A. C., Stone, J. M. & Vernaleo, J. C. 2005b, MNRAS, 357, 242
- Richardson et al. (2016) Richardson, M. L. A., Scannapieco, E., Devriendt, J., Slyz, A., Thacker, R. J., Dubois, Y., Wurster, J. & Silk, J. 2016, accepted to ApJ, eprint arXiv:1605.03589
- Richstone et al. (1998) Richstone, D. et al. 1998, Nature, 395, A14
- Rupke & Veilleux (2011) Rupke, D. S. N. & Veilleux, S. 2011, ApJ, 729, L27
- Sazonov et al. (2005) Sazonov, S. Y., Ostriker, J. P., Ciotti, L., & Sunyaev, R. A. 2005, MNRAS, 358, 168
- Shakura & Sunyaev (1973) Shakura, N. I. & Sunyaev, R. A. 1973, A&A, 24, 337
- Sijacki & Springel (2006) Sijacki, D. & Springel, V. 2006, MNRAS, 366, 397
- Sijacki et al. (2007) Sijacki, D., Springel, V., Di Matteo, T. & Hernquist, L. 2007, MNRAS, 380, 877
- Sijacki, Springel & Haehnelt (2009) Sijacki, D., Springel, V. & Haehnelt, M. G. 2009, MNRAS, 400, 100
- Springel & Hernquist (2003) Springel, V. & Hernquist, L. 2003, MNRAS, 339, 289
- Springel (2005) Springel, V. 2005, MNRAS, 364, 1105
- Springel, Di Matteo & Hernquist (2005) Springel, V., Di Matteo, T. & Hernquist, L. 2005, MNRAS, 361, 776
- Steinborn et al. (2015) Steinborn, L. K., Dolag, K., Hirschmann, M., Prieto, M. A. & Remus, R.-S. 2015, MNRAS, 448, 1504
- Sturm et al. (2011) Sturm, E. et al. 2011, ApJ, 733, L16
- Sutherland & Dopita (1993) Sutherland, R. S. & Dopita, M. A. 1993, ApJS, 88, 253
- Suto et al. (1998) Suto, Y., Sasaki, S. & Makino, N. 1998, ApJ, 509, 544
- Tamura et al. (2001) Tamura, T. et al. 2001, A&A, 365, L87
- Tombesi et al. (2013) Tombesi, F., Cappi, M., Reeves, J. N., Nemmen, R. S., Braito, V., Gaspari, M. & Reynolds, C. S. 2013, MNRAS, 430, 1102
- Tornatore et al. (2007) Tornatore, L., Borgani, S., Dolag, K. & Matteucci, F. 2007, MNRAS, 382, 1050
- Tornatore et al. (2010) Tornatore, L., Borgani, S., Viel, M. & Springel, V. 2010, MNRAS, 402, 1911
- Vazza, Bruggen & Gheller (2013) Vazza, F., Bruggen, M. & Gheller, C. 2013, MNRAS, 428, 2366
- Vernaleo & Reynolds (2006) Vernaleo, J. C. & Reynolds, C. S. 2006, ApJ, 645, 83
- Viola et al. (2008) Viola, M., Monaco, P., Borgani, S., Murante, G. & Tornatore, L. 2008, MNRAS, 383, 777
- Wagner, Umemura & Bicknell (2013) Wagner, A. Y., Umemura, M. & Bicknell, G. V. 2013, ApJ, 763, L18
- Wiersma, Schaye & Smith (2009) Wiersma, R. P. C., Schaye, J. & Smith, B. D. 2009, MNRAS, 393, 99
- Young, Wilson & Mundell (2002) Young, A. J., Wilson, A. S. & Mundell, C. G. 2002, ApJ, 579, 560
- Zubovas, Bourne & Nayakshin (2016) Zubovas, K., Bourne, M. A. & Nayakshin, S. 2016, MNRAS, 457, 496