The impact of the financial crisis on the long-range memory of European corporate bond and stock markets
Abstract
This paper investigates the presence of long memory in corporate bond and stock indices of
six European Union countries from July 1998 to February 2015. We compute the Hurst
exponent by means of the DFA method and using a sliding window in order to measure long range dependence. We detect that Hurst exponents behave differently in the stock and bond
markets, being smoother in the stock indices than in the bond indices. We verify that the level
of informational efficiency is time-varying. Moreover we find an asymmetric impact of the 2008 financial crisis in the fixed income and the stock markets, affecting the former but not the latter. Similar results are obtained using the R/S method.
JEL classification: G14,C40.
Keywords: Hurst, DFA, corporate bond indices, stock indices, financial crisis.
1 Introduction
The efficient market hypothesis (EMH) is the cornerstone of financial economics. The origins can be trace back to Gibson, (1889), who wrote that prices of publicly traded shares “may be regarded as the judgment of the best intelligence regarding them”. Some years later Bachelier, (1900) developed the first mathematical model concerning the behavior of stock prices. Nevertheless, the study of informational efficiency begun to be studied systematically in the 1960s, when financial economics emerged as a new area within economics. The classical definition of Fama, (1976) says that a market is informationally efficient if it “fully reflect all available information”. Therefore, the key element in assessing efficiency is to determine the appropriate set of information that impels prices. Following Fama, (1970), informational efficiency can be divided into three categories: (i) weak efficiency, if prices reflect the information contained in the past series of prices, (ii) semi-strong efficiency, if prices reflect all public information and (iii) strong efficiency, if prices reflect all public and private information. As a corollary of the EMH, one cannot accept the presence of long memory in financial time series, since its existence would allow a riskless profitable trading strategy. If markets are informationally efficient, arbitrage prevent the possibility of such strategies.
An important part of the literature focused its attention on studying the long-range dependence in stock markets. In spite of the fact that the market for corporate bonds is very important in volume and is a reference for portfolio managers, who see in these bonds an attractive way of investment, it has been overlooked in empirical studies.
The aim of this paper is to analyze the evolution of the long memory in returns of corporate bonds indices and stock indices of six EU countries. This article contributes to the literature on EMH in four important aspects. First, we expand the empirical studies by analyzing the long memory of corporate bonds indices, since they have been less studied than other instruments of capital markets. Second, we perform a comparative analysis of the fixed income and stock markets, since both are complementary in strategic asset allocation. Third, we shed light on the asymmetric impact of the 2008 financial crisis on both markets. Fourth, the time series is long enough to reach consistent conclusions.
The paper is organized as follows. Section 2 presents a literature review on long memory of stock and bond markets. Section 3 introduces the Hurst exponent as a measure for long-range dependence. Section 4 presents the data and methodology that will be used in this paper. Section 5 exposes the empirical results. Finally, Section 6 draws the main conclusions.
2 Literature review
The vast majority of the studies on informational efficiency focused their attention on the analysis of stock markets, giving other financial assets less attention. The empirical literature is not conclusive regarding the existence of long-range memory in these markets.
There are several works that, using different methodologies and samples, find evidence of long-range dependence. In particular, Greene and Fielitz, (1977) and Mills, (1993) use the Hurst exponent to detect the presence of long memory in the US and the UK stock markets, respectively. In Fama and French, (1988) positive short term autocorrelation and negative long term autocorrelation is found, after examining the returns of a diversified portfolio of the NYSE. This result reinforces the idea of an underlying mean-reverting process. Long memory is also found in the Spanish stock market Blasco and Santamaría, (1996) and the Turkish stock market Kilic, (2004). In the same line, Barkoulas et al., (2000) find evidence of long memory in the weekly returns of the Athens Stock Exchange during the period 1981-1990, and suggest that the strength of the memory could be influenced by the market size. Also long memory behavior in the Greek market was found by Panas, (2001). Cajueiro and Tabak, 2004c find that developed markets are more informationally efficient than emerging markets and that the level of efficiency is influenced by market size and trading costs. Cajueiro and Tabak, (2005) relate long-range dependence with specific financial variables of the firms under examinations. Zunino et al., (2007) find that the long-range memory in seven Latin-American markets is time varying. In this line, Bariviera, (2011) finds evidence of a time varying long-range dependence in daily returns of Thai Stock Market during the period 1975-2010 and concludes that it is weakly influenced by the liquidity level and market size. Vodenska-Chitkushev et al., (2008) show that volatility clustering in the S & P 500 index produces memory in returns. La Spada et al., (2008) find long memory in the sign of transactions but not in the signs of returns. Ureche-Rangau and de Rorthays, (2009) investigate the presence of long memory in volatility and trading volume of the Chinese stock market.Cajueiro and Tabak, (2007) present empirical evidence of time-varying long-range dependence for US interest rates. They conclude that long memory has reduced over time. Moreover, Cajueiro and Tabak, (2010) find that this long-range dependence, is affected by the monetary policy. Similarly, Cajueiro and Tabak, (2009) find long range dependence in Brazilian interest rates and their volatility, providing important implications for monetary studies. Time-varying long range dependence in Libor interest rates is found in Bariviera et al., 2015a ; Bariviera et al., 2015b . The authors conclude that such behavior is consistent with the Libor rate rigging scandal.
Poterba and Summers, (1988) analyze 18 international stock markets and find negative autocorrelation in the long run. Also, Cheung and Lai, (1995) use the fractional differencing test for long memory by Geweke and Porter-Hudak, (1983) and find evidence of long memory in 5 out of the 18 markets under study. Using a different methodology, Barkoulas and Baum, (1996) applied spectral regression to time series of 30 firms, 7 sector indices and 2 broad stock indices at daily and monthly frequency, and find evidence of long memory only in 5 of the individual firms. Wright, (2001) compares the memory content of the time series in developed and emerging stock markets, finding that the latter exhibits short term serial correlation in addition to long-range memory. Henry, (2002) concludes that there is strong evidence of long-range memory in the Korean market and some weak evidence on the German, Japanese and Taiwanese markets, after analyzing monthly returns of nine stock markets. Also, Tolvi, (2003) uses a sample of 16 stock markets of OECD countries and finds evidence of long memory only in 3 of them and Kasman et al., (2009) find that among the four main central European countries (Czech Republic, Hungary, Poland and Slovak Republic), only the last one exhibits long memory. Cheong, (2010) compute the Hurst exponent by means of three heuristic methods and find evidence of long memory in the returns of five Malaysian equity market indices. This study finds that the Asian economic crisis affected the extent of long-range memory of the Malaysian stock market.
With respect to the fixed income market, Carbone et al., (2004) find local variability of the correlation exponent in the German stock and sovereign bond markets. Bariviera et al., (2012) find empirical evidence of long memory in corporate and sovereign bond markets and detect that the current financial crisis affects more the informational efficiency of the corporate than sovereign market. Zunino et al., (2012), using the complexity-entropy causality plane for a sample of thirty countries, find that informational efficiency is related to the degree of economic development. Recently, Bariviera et al., (2014) find that the long range memory of corporate bonds at European level are affected unevenly during the financial crisis. In particular, sectors closely related to financial activities were the first to exhibit a reduction in the informational efficiency.
There are some works that find no evidence of long memory in the financial time series. Among others we can cite Lo, (1991), in the returns of US stocks, and Grau-Carles, (2005) in the stock indices of US, UK, Japan and Spain.
As we can appreciate, the empirical studies on corporate bond markets are less abundant and more recent than those on stock markets. The importance of fixed income instruments in the composition of investment portfolios and in firm financing, gives a rationale for our study.
3 Long range dependence
One of the most common and classic measures of long-range dependence was proposed by Hurst, (1951). The Hurst’s exponent characterizes the scaling behavior of the range of cumulative departures of a time series from its mean. There are several methods (both parametric and non parametric) to calculate the Hurst exponent. For a survey on the different methods for estimating long range dependences see Taqqu et al., (1995) and Montanari et al., (1999). Among these methods there is the analysis, used in Hurst, (1951) and described in depth by Mandelbrot and Wallis, (1968) and Mandelbrot and Wallis, (1969). This method uses the range of the partial sums of deviations of a time series from its mean, rescaled by its standard deviation. If we have a sequence of continuous compounded returns , is the length of the estimation period and is the sample mean, the the statistic is given by
| (1) |
where is the standard deviation
| (2) |
Hurst Hurst, (1951), found that the following relation
| (3) |
is verified by many time series in natural phenomena. The use of the analysis in economic time series was pioneered by Mandelbrot, (1972), and became very popular with the development of econophysics.
Serinaldi, (2010) makes a critical review on the different estimation methods of the Hurst exponent, concluding that an inappropriate application of the estimation method could lead to incorrect conclusions about the persistence or anti-persistence of financial series. Although R/S method is probably one of the most extended methods to approximate long run memory in time series, it is not robust to departures from stationarity. Consequently, if the process under scrutiny exhibits short memory, the R/S statistic could indicate erroneously the presence of long memory. In this sense, Peng et al., (1994) develops the method called Detrended Fluctuation Analysis (DFA) that is more appropriate when dealing with nonstationary data. As recognized by Grau-Carles, (2000), this method avoids spurious detection of long-range dependence due to nonstationary data. Due to this reason we select the DFA method in order to assess the existence of long memory in this paper.
The algorithm, described in detail in Peng et al., (1995), begins by computing the mean of the stochastic time series , for . Then, an integrated time series , is obtained by subtracting mean and adding up to the element, . Then is divided into non overlapping subsamples and a polynomial fit is computed in order to determine the local trend of each subsample. Next the fluctuation function
| (4) |
is computed. This procedure is repeated for several values of . The fluctuation function behaves as a power-law of , , where is the Hurst exponent. Consequently, the exponent is computed by regressing onto . According to the literature the maximum block size to use in partitioning the data is , where window is the time series window vector. Consequently, in this paper we use six points to estimate the Hurst exponent. The points for regression estimation are: .
There are other methodologies to verify the presence of long-range memory. Rosso et al., (2007) introduced the complexity-causality plane in order to discriminate between Gaussian from non-Gaussian processes. Zunino et al., (2010) shows that this innovative approach could be used to rank stock markets according to their stage of development. In Zunino et al., (2011), the application of the complexity-entropy causality plane was extended to the study of the efficiency of commodity prices. This method reveals that it is not only useful to produce a ranking of efficiency of different commodities, but it also allows to identify periods of increasing and decreasing randomness in the price dynamics. Zunino et al., (2012) uses this representation space to establish an efficiency ranking of different markets and distinguish different bond market dynamics and conclude that the classification derived from the complexity-entropy causality plane is consistent with the qualifications assigned to sovereign instruments by major rating companies.
4 Data and methodology
We calculate the Hurst exponent for daily returns of corporate bond and stock market indices of six European Union countries: Austria, Belgium, Finland, France, Italy and Luxembourg. All data used in this paper was retrieved from DataStream. The details of the series codes are in Table 1. The corporate bond indices are constituted by corporate bonds that are investment grade, with at least one year remaining to maturity and a minimum outstanding of €300 million. The corporate sector consists of financial, industrial and utility companies. The stock indices are the most representative of each country.
| Country | Acronym | Bond Index | Stock Index |
|---|---|---|---|
| Austria | OE | LHAACIE | WBI |
| Belgium | BG | LHABCIE | BEL 20 |
| Finland | FN | LHAFCIE | OMXH |
| France | FR | LHAFRCE | CAC 40 |
| Italy | IT | LHAICIE | MIB |
| Luxembourg | LX | LHALCIE | LUXX |
The period under study goes from 05/01/1999 until 12/02/2015 with a total of 4203 datapoints. The continuous compounded return is computed as follows:
| (5) |
Tables 2 and 3 show the descriptive statistics of daily returns, which reflect the excess of kurtosis and non normality of the data, which is a stylized fact in many financial time series (see Cont, (2001)). As could be appreciate bonds redemption yield have been positive during the whole period of analysis, except for France. Austria bonds present the highest returns, followed by Belgium and Italy. Moreover, Luxemburg and Belgium show the highest variances of the period, which means that their performance are very volatile.
The stock market yields are positive during all observation period for Austria, Finland, and France, but negative for Belgium, Italy and Luxembourg. Moreover, Finland presents greater variance, such as Luxemburg, than others selected countries. Similarly to bonds yields, these variables are not normally distributed.
| OE | BG | FN | FR | IT | LX | |
|---|---|---|---|---|---|---|
| Observations | 4203 | 4203 | 4203 | 4203 | 4203 | 4203 |
| Mean | 0.0007 | 0.0005 | 0.0003 | -0.0001 | 0.0049 | 0.0023 |
| Median | 0.0000 | 0.0000 | 0.0000 | 0.0000 | 0.0089 | 0.0000 |
| Min | -2.2263 | -6.2986 | -6.6244 | -1.4573 | -5.8948 | -5.5124 |
| Max | 2.1667 | 12.1781 | 6.6709 | 1.3761 | 6.3251 | 8.1018 |
| Std. Deviation | 0.2095 | 0.3209 | 0.2871 | 0.1931 | 0.2798 | 0.3910 |
| Skewness | -0.2001 | 9.7405 | -0.0091 | -0.4428 | 0.5400 | 0.0846 |
| Kurtosis | 14.7352 | 551.7285 | 162.4596 | 6.8790 | 120.6734 | 88.0309 |
| Jarque Bera | 24145 | 52797118 | 4452965 | 2772 | 2425167 | 1266204 |
| OE | BG | FN | FR | IT | LX | |
|---|---|---|---|---|---|---|
| Observations | 4203 | 4203 | 4203 | 4203 | 4203 | 4203 |
| Mean | 0.0161 | -0.0005 | 0.0094 | 0.0031 | -0.0139 | -0.0024 |
| Median | 0.0000 | 0.0099 | 0.0000 | 0.0055 | 0.0096 | 0.0111 |
| Min | -8.6189 | -8.3193 | -17.4037 | -9.4715 | -8.5981 | -30.0534 |
| Max | 10.2799 | 9.3340 | 14.5631 | 10.5946 | 10.8769 | 33.2180 |
| Std. Deviation | 1.2038 | 1.2673 | 1.8640 | 1.4722 | 1.5055 | 1.7081 |
| Skewness | -0.3863 | 0.0354 | -0.3385 | 0.0042 | -0.0820 | 0.2241 |
| Kurtosis | 12.9508 | 9.0692 | 10.2167 | 7.8733 | 7.4665 | 63.3921 |
| Jarque Bera | 17445 | 6452 | 9201 | 4159 | 3498 | 638752 |
Departing from daily returns, we compute the Hurst exponent using the DFA method. Since we are interested in studying the dynamic behavior of the Hurst exponent along our period of study, and following Cajueiro and Tabak, 2004b ; Cajueiro and Tabak, 2004a , we estimate the Hurst exponent using a two year sliding window (500 datapoints). The selection this time-window is justified because it reflects changes in economic situation while still giving a reliable estimate of long range correlation. In order to check for the robustness of our findings we also used a 1024 datapoints sliding window, as it was previously used by Zunino et al., (2007) to study the dynamics of the Hurst exponent in Latin-American markets and by Bariviera, (2011) to analyze the evolution of long memory in the Thai stock market.
The rolling sample approach works as follows: we compute the Hurst exponent for the first 500 returns, then we move forward seven datapoints, compute the Hurst exponent, and continue this way until the end of data. Thus, each estimate is calculated from data samples of the same size. The last estimate covers the period from 06/03/2013 until 12/02/2015.
5 Results
We compute the Hurst exponent by means of the DFA method using a rolling sample. We obtain 529 Hurst exponents of each time series. Descriptive statistics are presented in Tables 4 and 5.
| OE | BG | FN | FR | IT | LX | |
|---|---|---|---|---|---|---|
| Observations | 529 | 529 | 529 | 529 | 529 | 529 |
| Mean | 0.5462 | 0.5446 | 0.5016 | 0.5549 | 0.5573 | 0.4652 |
| Median | 0.5448 | 0.5437 | 0.5040 | 0.5528 | 0.5504 | 0.4671 |
| Min | 0.3954 | 0.2616 | 0.2864 | 0.4126 | 0.3623 | 0.1653 |
| Max | 0.7306 | 0.7702 | 0.6326 | 0.7404 | 0.7672 | 0.7246 |
| Std. Deviation | 0.0659 | 0.0715 | 0.0539 | 0.0638 | 0.0906 | 0.0774 |
| Skewness | 0.2714 | -0.2445 | -0.5095 | 0.3398 | 0.2372 | -0.0323 |
| Kurtosis | 2.6587 | 3.8294 | 3.8137 | 2.6930 | 2.2301 | 3.8263 |
| Jarque Bera | 9.0616 | 20.4317 | 37.4816 | 12.2572 | 18.0238 | 15.1405 |
| OE | BG | FN | FR | IT | LX | |
|---|---|---|---|---|---|---|
| Observations | 529 | 529 | 529 | 529 | 529 | 529 |
| Mean | 0.5358 | 0.4891 | 0.5024 | 0.4552 | 0.4917 | 0.5317 |
| Median | 0.5438 | 0.4869 | 0.5066 | 0.4578 | 0.4989 | 0.5568 |
| Min | 0.3105 | 0.2853 | 0.3791 | 0.3026 | 0.3234 | 0.2456 |
| Max | 0.6824 | 0.6173 | 0.6716 | 0.5625 | 0.6199 | 0.7383 |
| Std. Deviation | 0.0692 | 0.0689 | 0.0436 | 0.0401 | 0.0464 | 0.1022 |
| Skewness | -0.3504 | -0.2419 | -0.0217 | -0.5316 | -0.5388 | -0.6774 |
| Kurtosis | 2.5193 | 2.6021 | 3.5265 | 3.5550 | 3.5099 | 2.7689 |
| Jarque Bera | 15.9208 | 8.6495 | 6.1506 | 31.7088 | 31.3288 | 41.6362 |
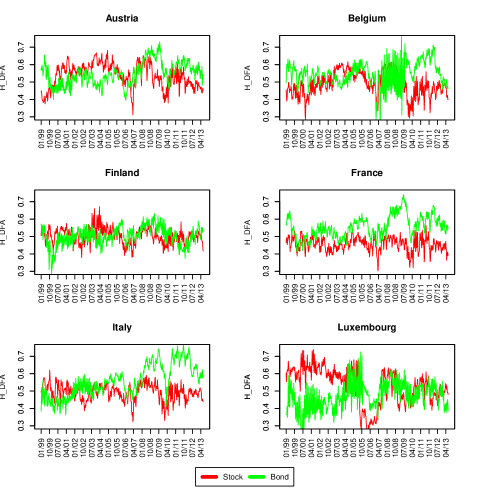
Figure 1 presents the evolution of the Hurst estimates of stocks and bonds for the six selected countries. As it could be observed, the lines of the former are smoother than the lines corresponding to the latter. We also observe that in almost all countries there is an increase in Hurst exponents around the window that begins in October 2005. Considering that the period of estimation of each Hurst exponent is approximately 2 years (500 datapoints), those estimates that begin in October 2005, include in their sample returns of years 2007 and after. This finding could indicate that Hurst exponents behave differently before and during the financial turmoil. A similar result is shown in Cheong, (2010) during the Asian crisis in the Malaysian market.
In order to verify this hypothesis we divide the sample into two subperiods. The division is set the day Lehman Brothers filed bankruptcy, on 15/09/2008, as it is frequently used in the literature Bariviera et al., (2014); Barrios et al., (2009); Bernoth and Erdogan, (2012); Grammatikos and Vermeulen, (2012); Martinez et al., (2013).
We carried out two analysis. First, we test the equality of the parameters of two subsamples. Second, we test if the subsamples changes in their memory endowment.
Table 6 shows the results of the Mann-Whitney test in order to assess whether the two subsamples have equal means. Either in bond or stock indices, the results leads to a rejection of the null hypothesis in all countries, except for corporate bonds in Finland. According to our results, the subsamples are statistically different in means, which lead us to hypothesize that the times series informational efficiency is different before and during the financial crisis.
| OE | BG | FN | FR | IT | LX | |
| Bond | ||||||
| Mean before crisis | 0.5247 | 0.5294 | 0.4986 | 0.5342 | 0.5153 | 0.4552 |
| Mean after crisis | 0.5919 | 0.5769 | 0.5080 | 0.5991 | 0.6468 | 0.4865 |
| WilcoxonMannWhitney test | 11740 | 19168 | 27800 | 12991 | 5284 | 22198 |
| p-value | 0.0000 | 0.0000 | 0.1100 | 0.0000 | 0.0000 | 0.0000 |
| Stock | ||||||
| Mean before crisis | 0.5546 | 0.5083 | 0.5098 | 0.4604 | 0.4981 | 0.5521 |
| Mean after crisis | 0.4956 | 0.4480 | 0.4868 | 0.4441 | 0.4780 | 0.4883 |
| WilcoxonMannWhitney test | 47306 | 45638 | 41382 | 37242 | 38175 | 46600 |
| p-value | 0.0000 | 0.0000 | 0.0000 | 0.0000 | 0.0000 | 0.0000 |
Table 7 shows the results of the Levene test of Hurst estimates’ homogeneity of variance. Regarding to the Hurst exponents of bond indices, we reject the null hypothesis of homogeneity of variances, for Belgium and Luxembourg. Regarding to the Hurst exponents of stock indices, the equality of variances is rejected in the time series, except in Italy.
| OE | BG | FN | FR | IT | LX | |
|---|---|---|---|---|---|---|
| Bond | ||||||
| Std.Dev. before crisis | 0.0598 | 0.0613 | 0.0528 | 0.0548 | 0.0666 | 0.0846 |
| Std.Dev. after crisis | 0.0539 | 0.0806 | 0.0557 | 0.0592 | 0.0669 | 0.0532 |
| Levene test | 1.5071 | 26.4315 | 2.9708 | 1.1316 | 0.1499 | 25.0381 |
| p-value | 0.2201 | 0.0000 | 0.0854 | 0.2879 | 0.6988 | 0.0000 |
| Stock | ||||||
| Std.Dev. before crisis | 0.0702 | 0.0660 | 0.0463 | 0.0371 | 0.0453 | 0.1135 |
| Std.Dev. after crisis | 0.0461 | 0.0557 | 0.0322 | 0.0439 | 0.0460 | 0.0501 |
| Levene test | 26.1964 | 12.3452 | 16.9376 | 4.1442 | 0.0035 | 68.9006 |
| p-value | 0.0000 | 0.0005 | 0.0000 | 0.0423 | 0.9528 | 0.0000 |
Subsequently, we propose to expand the analysis, by comparing the memory content in the two subperiods. Given that we estimate Hurst exponents using sliding windows, we have a set of estimates, each of them from a sample of size 500. Consequently we can compute the confidence interval of our estimations using the t-distribution. We present the 0.999 upper and lower bounds in Table 8 and Table 9.
The results for the corporate bonds market are shown in Table 8. If we consider the whole period we observe that the Hurst exponents are higher than 0.5 using a 0.999 confidence interval, except for Finland and Luxembourg. These results indicate that the time series does not follow a random walk. When we split the time series into two subperiods, we find different memory dynamics. In the first subperiod, the conclusions are the same to the whole period. However, in the second subperiod we find that the mean of the Hurst exponents increased significantly. This indicates that the time series become more persistent during the financial crisis, even in Finland. Luxembourg is the only market that has .
The results for the stock indices are shown in Table 9. Looking at the whole period, the mean of the Hurst estimates are closer to 0.5, than in bond indices. Consequently, the market behaves more or less consistently with a random walk. Before the crisis, the time series were slightly persistent , whereas, after the crisis, the time series became anti-persistent . According to our results, the financial distress does not seem to affect equally the informational efficiency of the stock and the bond markets.
The memory content of stock indices, at first glance, changed from persistent to antipersistent, considering the Hurst exponent. This result could indicate a general contraction of the European stock markets, and probably, a path towards a more efficient behavior. Nontheless, with respect to the corporate bonds indices all of them have changed their informational efficiency towards an even more persistent series. This change could have been induced by the arising of a general financial turmoil in 2008. The impact of this crisis was different in the fixed income vis-à-vis the stock markets. In particular, the corporate bond market was more affected by the new financial scenario, since the departure from the benchmark is larger in corporate bond market.
A special mention is devoted to the Belgian bond market. This market is rather small compared with the rest under analysis in this paper. In particular, the Belgian financial system is bank-based, which hamper the development of alternative financial instruments, such as corporate bonds or other fixed income instruments. On the other hand, the small corporate bond market is dominated by few players, including the so-called universal banks (i.e. big banks that acts as both investment and commercial banks), which induce to a very small corporate bond outstanding, and the trading focuses on the few large banks. Hurst exponent measures long term correlations in a time series. If a market is of reduced size, or if it has very few operating agents, individual behavior could be amplified. Previous studies related informational efficiency with market size, e.g. Barkoulas et al., (2000). Consequently, herd behavior, or sudden movements in the market, could contaminate the price signal with significant noise. As a result, DFA method could have problems in filtering the long range correlations. This is probably the explanation of the errant behavior in the time series of Hurst exponent in the Belgian bond market.
| OE | BG | FN | FR | IT | LX | |
| Whole period | ||||||
| Observations | 529 | 529 | 529 | 529 | 529 | 529 |
| Mean | 0.5462 | 0.5446 | 0.5016 | 0.5549 | 0.5573 | 0.4652 |
| Std. Deviation | 0.0659 | 0.0715 | 0.0539 | 0.0638 | 0.0906 | 0.0774 |
| Std. Error | 0.0029 | 0.0032 | 0.0024 | 0.0029 | 0.0041 | 0.0035 |
| 0.999 conf. upper bound | 0.5553 | 0.5545 | 0.5091 | 0.5638 | 0.5699 | 0.4759 |
| 0.999 conf. lower bound | 0.5370 | 0.5346 | 0.4941 | 0.5461 | 0.5447 | 0.4544 |
| Before crisis | ||||||
| Observations | 360 | 360 | 360 | 360 | 360 | 360 |
| Mean | 0.5247 | 0.5294 | 0.4986 | 0.5342 | 0.5153 | 0.4552 |
| Std. Deviation | 0.0598 | 0.0613 | 0.0528 | 0.0548 | 0.0666 | 0.0846 |
| Std. Error | 0.0027 | 0.0027 | 0.0024 | 0.0024 | 0.0030 | 0.0038 |
| 0.999 conf. upper bound | 0.5330 | 0.5379 | 0.5059 | 0.5418 | 0.5245 | 0.4669 |
| 0.999 conf. lower bound | 0.5164 | 0.5209 | 0.4913 | 0.5266 | 0.5060 | 0.4434 |
| After crisis | ||||||
| Observations | 169 | 169 | 169 | 169 | 169 | 169 |
| Mean | 0.5919 | 0.5769 | 0.5080 | 0.5991 | 0.6468 | 0.4865 |
| Std. Deviation | 0.0539 | 0.0806 | 0.0557 | 0.0592 | 0.0669 | 0.0532 |
| Std. Error | 0.0024 | 0.0036 | 0.0025 | 0.0026 | 0.0030 | 0.0024 |
| 0.999 conf. upper bound | 0.5994 | 0.5881 | 0.5158 | 0.6073 | 0.6561 | 0.4939 |
| 0.999 conf. lower bound | 0.5844 | 0.5657 | 0.5003 | 0.5909 | 0.6375 | 0.4791 |
| OE | BG | FN | FR | IT | LX | |
| Whole period | ||||||
| Observations | 529 | 529 | 529 | 529 | 529 | 529 |
| Mean | 0.5358 | 0.4891 | 0.5024 | 0.4552 | 0.4917 | 0.5317 |
| Std. Deviation | 0.0692 | 0.0689 | 0.0436 | 0.0401 | 0.0464 | 0.1022 |
| Std. Error | 0.0031 | 0.0031 | 0.0020 | 0.0018 | 0.0021 | 0.0046 |
| 0.999 conf. upper bound | 0.5454 | 0.4986 | 0.5085 | 0.4607 | 0.4981 | 0.5459 |
| 0.999 conf. lower bound | 0.5261 | 0.4795 | 0.4964 | 0.4496 | 0.4852 | 0.5175 |
| Before crisis | ||||||
| Observations | 360 | 360 | 360 | 360 | 360 | 360 |
| Mean | 0.5546 | 0.5083 | 0.5098 | 0.4604 | 0.4981 | 0.5521 |
| Std. Deviation | 0.0702 | 0.0660 | 0.0463 | 0.0371 | 0.0453 | 0.1135 |
| Std. Error | 0.0031 | 0.0030 | 0.0021 | 0.0017 | 0.0020 | 0.0051 |
| 0.999 conf. upper bound | 0.5644 | 0.5175 | 0.5162 | 0.4655 | 0.5044 | 0.5679 |
| 0.999 conf. lower bound | 0.5449 | 0.4992 | 0.5034 | 0.4552 | 0.4918 | 0.5364 |
| After crisis | ||||||
| Observations | 169 | 169 | 169 | 169 | 169 | 169 |
| Mean | 0.4956 | 0.4480 | 0.4868 | 0.4441 | 0.4780 | 0.4883 |
| Std. Deviation | 0.0461 | 0.0557 | 0.0322 | 0.0439 | 0.0460 | 0.0501 |
| Std. Error | 0.0021 | 0.0025 | 0.0014 | 0.0020 | 0.0021 | 0.0022 |
| 0.999 conf. upper bound | 0.5020 | 0.4557 | 0.4912 | 0.4502 | 0.4844 | 0.4953 |
| 0.999 conf. lower bound | 0.4892 | 0.4402 | 0.4823 | 0.4380 | 0.4717 | 0.4813 |
6 Conclusions
This paper sheds light on the informational efficiency of the corporate bond and stock markets of six EU countries. In particular, we study the evolution over time of the Hurst exponent as a measure of long-range memory using the DFA method. We detect different memory dynamics in stock and bond series. First, the Hurst exponents series are smoother in the stock indices than in the bond indices. Second, the impact of the financial crisis affected more deeply fixed income markets than equity markets. This results could be a consequence of market participants behavior during the financial turmoil. In particular, investors increase their risk aversion, changing their asset allocation. This effect is commonly known as flight to quality and flight to liquidity, i.e. investors prefer safer and more liquid financial instruments. In this case stocks are more liquid than corporate bonds and sovereign bonds are safer than either corporate bonds and stocks. This reaction could generate herd effect that could be reflected in a more persistent time series (). In spite of the fact that our results cannot be extrapolated to other markets, they have important implications for defining prudential regulation of financial and stock markets. We understand that more research on this topic should be conducted for different markets in order to validate the possible causes of long-range dependence.
References
- Bachelier, [1900] Bachelier, L. (1900). Théorie de la spéculation. Annales scientifiques de l’École Normale Supérieure, Paris.
- [2] Bariviera, A., Guercio, M., Martinez, L., and Rosso, O. (2015a). The (in)visible hand in the libor market: an information theory approach. The European Physical Journal B, 88(8):208.
- [3] Bariviera, A., Guercio, M., Martinez, L., and Rosso, O. (2015b). A permutation information theory tour through different interest rate maturities: the libor case. Philosophical Transactions of the Royal Society of London A: Mathematical, Physical and Engineering Sciences, 373:20150119.
- Bariviera, [2011] Bariviera, A. F. (2011). The influence of liquidity on informational efficiency: The case of the thai stock market. Physica A: Statistical Mechanics and its Applications, 390(23-24):4426–4432.
- Bariviera et al., [2012] Bariviera, A. F., Belén Guercio, M., and Martinez, L. B. (2012). A comparative analysis of the informational efficiency of the fixed income market in seven european countries. Economics Letters, 116(3):426–428.
- Bariviera et al., [2014] Bariviera, A. F., Guercio, M. B., and Martinez, L. B. (2014). Informational efficiency in distressed markets: The case of european corporate bonds. The Economic and Social Review, 45(3):349–369.
- Barkoulas and Baum, [1996] Barkoulas, J. T. and Baum, C. F. (1996). Long-term dependence in stock returns. Economics Letters, 53(3):253–259.
- Barkoulas et al., [2000] Barkoulas, J. T., Baum, C. F., and Travlos, N. (2000). Long memory in the greek stock market. Applied Financial Economics, 10(2):177–184.
- Barrios et al., [2009] Barrios, S., Iversen, P., Lewandowska, M., and Setzer, R. (2009). Determinants of intra-euro area government bond spreads during the financial crisis. European economy - economic papers, Directorate General Economic and Monetary Affairs, European Commission.
- Bernoth and Erdogan, [2012] Bernoth, K. and Erdogan, B. (2012). Sovereign bond yield spreads: A time-varying coefficient approach. Journal of International Money and Finance, 31(3):639 – 656.
- Blasco and Santamaría, [1996] Blasco, N. and Santamaría, R. (1996). Testing memory patterns in the spanish stock market. Applied Financial Economics, 6(5):401–411.
- Cajueiro and Tabak, [2010] Cajueiro, D. and Tabak, B. (2010). Fluctuation dynamics in us interest rates and the role of monetary policy. Finance Research Letters, 7(3):163–169.
- [13] Cajueiro, D. O. and Tabak, B. M. (2004a). Evidence of long range dependence in asian equity markets: the role of liquidity and market restrictions. Physica A: Statistical Mechanics and its Applications, 342(3-4):656–664.
- [14] Cajueiro, D. O. and Tabak, B. M. (2004b). The hurst exponent over time: testing the assertion that emerging markets are becoming more efficient. Physica A: Statistical and Theoretical Physics, 336(3-4):521–537.
- [15] Cajueiro, D. O. and Tabak, B. M. (2004c). Ranking efficiency for emerging markets. Chaos, Solitons and Fractals, 22(2):349–352.
- Cajueiro and Tabak, [2005] Cajueiro, D. O. and Tabak, B. M. (2005). Possible causes of long-range dependence in the brazilian stock market. Physica A: Statistical Mechanics and its Applications, 345(3-4):635–645.
- Cajueiro and Tabak, [2007] Cajueiro, D. O. and Tabak, B. M. (2007). Time-varying long-range dependence in us interest rates. Chaos, Solitons & Fractals, 34(2):360 – 367.
- Cajueiro and Tabak, [2009] Cajueiro, D. O. and Tabak, B. M. (2009). Testing for long-range dependence in the brazilian term structure of interest rates. Chaos, Solitons & Fractals, 40(4):1559 – 1573.
- Carbone et al., [2004] Carbone, A., Castelli, G., and Stanley, H. E. (2004). Time-dependent hurst exponent in financial time series. Physica A: Statistical Mechanics and its Applications, 344(1-2):267–271.
- Cheong, [2010] Cheong, C. (2010). Estimating the hurst parameter in financial time series via heuristic approaches. Journal of Applied Statistics, 37(2):201–214.
- Cheung and Lai, [1995] Cheung, Y. . and Lai, K. S. (1995). A search for long memory in international stock market returns. Journal of International Money and Finance, 14(4):597–615.
- Cont, [2001] Cont, R. (2001). Empirical properties of asset returns: stylized facts and statistical issues. Quantitative Finance, 1(2):223–236.
- Fama, [1970] Fama, E. F. (1970). Efficient capital markets: A review of theory and empirical work. The Journal of Finance, 25(2, Papers and Proceedings of the Twenty-Eighth Annual Meeting of the American Finance Association New York, N.Y. December, 28-30, 1969):pp. 383–417.
- Fama, [1976] Fama, E. F. (1976). Foundations of finance : portfolio decisions and securities prices. Basic Books, New York.
- Fama and French, [1988] Fama, E. F. and French, K. R. (1988). Dividend yields and expected stock returns. Journal of Financial Economics, 22(1):3–25.
- Geweke and Porter-Hudak, [1983] Geweke, J. and Porter-Hudak, S. (1983). The estimation and application of long memory time series models. Journal of Time Series Analysis, 4:221–238.
- Gibson, [1889] Gibson, G. R. (1889). The stock exchanges of London, Paris, and New York : a comparison. G.P. Putnam, New York.
- Grammatikos and Vermeulen, [2012] Grammatikos, T. and Vermeulen, R. (2012). Transmission of the financial and sovereign debt crises to the emu: Stock prices, cds spreads and exchange rates. Journal of International Money and Finance, 31(3):517 – 533.
- Grau-Carles, [2000] Grau-Carles, P. (2000). Empirical evidence of long-range correlations in stock returns. Physica A: Statistical Mechanics and its Applications, 287(3-4):396–404.
- Grau-Carles, [2005] Grau-Carles, P. (2005). Tests of long memory: A bootstrap approach. Computational Economics, 25(1-2):103–113.
- Greene and Fielitz, [1977] Greene, M. T. and Fielitz, B. D. (1977). Long-term dependence in common stock returns. Journal of Financial Economics, 4(3):339–349.
- Henry, [2002] Henry, lan, T. (2002). Long memory in stock returns: Some international evidence. Applied Financial Economics, 12(10):725–729.
- Hurst, [1951] Hurst, H. E. (1951). Long-term storage capacity of reservoirs. Transactions of the American Society of Civil Engineers, 116:770–808.
- Kasman et al., [2009] Kasman, S., Turgutlu, E., and Ayhan, A. D. (2009). Long memory in stock returns: Evidence from the major emerging central european stock markets. Applied Economics Letters, 16(17):1763–1768.
- Kilic, [2004] Kilic, R. (2004). On the long memory properties of emerging capital markets: Evidence from istanbul stock exchange. Applied Financial Economics, 14(13):915–922.
- La Spada et al., [2008] La Spada, G., Farmer, J., and Lillo, F. (2008). The non-random walk of stock prices: the long-term correlation between signs and sizes. The European Physical Journal B - Condensed Matter and Complex Systems, 64(3):607 – 614.
- Lo, [1991] Lo, A. (1991). Long-term memory in stock market prices. Econometrica, 59:1279–1313.
- Mandelbrot, [1972] Mandelbrot, B. B. (1972). Statistical methodology for nonperiodic cycles: From the covariance to rs analysis. In Annals of Economic and Social Measurement, Volume 1, number 3, NBER Chapters, pages 259–290. National Bureau of Economic Research, Inc.
- Mandelbrot and Wallis, [1968] Mandelbrot, B. B. and Wallis, J. R. (1968). Noah, joseph, and operational hydrology. Water Resources Research, 4(5):909–918.
- Mandelbrot and Wallis, [1969] Mandelbrot, B. B. and Wallis, J. R. (1969). Computer experiments with fractional gaussian noises: Part 2, rescaled ranges and spectra. Water Resources Research, 5(1):242–259.
- Martinez et al., [2013] Martinez, L. B., Terceño, A., and Teruel, M. (2013). Sovereign bond spreads determinants in latin american countries: Before and during the XXI financial crisis. Emerging Markets Review, 17(0):60 – 75.
- Mills, [1993] Mills, T. C. (1993). Is there long-term memory in uk stock returns? Applied Financial Economics, 3:303–306.
- Montanari et al., [1999] Montanari, A., Taqqu, M. S., and Teverovsky, V. (1999). Estimating long-range dependence in the presence of periodicity: An empirical study. Mathematical and Computer Modelling, 29(10-12):217–228.
- Panas, [2001] Panas, E. (2001). Estimating fractal dimension using stable distributions and exploring long memory through arfima models in athens stock exchange. Applied Financial Economics, 11(4):395–402.
- Peng et al., [1994] Peng, C.-K., Buldyrev, S. V., Havlin, S., Simons, M., Stanley, H. E., and Goldberger, A. L. (1994). Mosaic organization of dna nucleotides. Physical Review E, 49(2):1685–1689.
- Peng et al., [1995] Peng, C.-K., Havlin, S., Stanley, H. E., and Goldberger, A. L. (1995). Quantification of scaling exponents and crossover phenomena in nonstationary heartbeat time series. Chaos: An Interdisciplinary Journal of Nonlinear Science, 5(1):82–87.
- Poterba and Summers, [1988] Poterba, J. M. and Summers, L. H. (1988). Mean reversion in stock prices. evidence and implications. Journal of Financial Economics, 22(1):27–59.
- Rosso et al., [2007] Rosso, O. A., Larrondo, H. A., Martin, M. T., Plastino, A., and Fuentes, M. A. (2007). Distinguishing noise from chaos. Phys. Rev. Lett., 99(15):154102.
- Serinaldi, [2010] Serinaldi, F. (2010). Use and misuse of some hurst parameter estimators applied to stationary and non-stationary financial time series. Physica A: Statistical Mechanics and its Applications, 389(14):2770–2781.
- Taqqu et al., [1995] Taqqu, M. S., Teverovsky, V., and Willinger, W. (1995). Estimators for long-range dependence: An empirical study. Fractals, 3:785–798.
- Tolvi, [2003] Tolvi, J. (2003). Long memory and outliers in stock market returns. Applied Financial Economics, 13(7):495–502.
- Ureche-Rangau and de Rorthays, [2009] Ureche-Rangau, L. and de Rorthays, Q. (2009). More on the volatility-trading volume relationship in emerging markets: The chinese stock market. Journal of Applied Statistics, 36(7):779–799.
- Vodenska-Chitkushev et al., [2008] Vodenska-Chitkushev, I., Wang, F. Z., Weber, P., Yamasaki, K., Havlin, S., and Stanley, H. E. (2008). Comparison between volatility return intervals of the s & p 500 index and two common models. The European Physical Journal B - Condensed Matter and Complex Systems, 61(2):217 – 223.
- Wright, [2001] Wright, J. (2001). Long memory in emerging market stock returns. Emerging Markets Quarterly, 5:50–55.
- Zunino et al., [2012] Zunino, L., Bariviera, A. F., Guercio, M. B., Martinez, L. B., and Rosso, O. A. (2012). On the efficiency of sovereign bond markets. Physica A: Statistical Mechanics and its Applications, 391(18):4342–4349.
- Zunino et al., [2007] Zunino, L., Tabak, B. M., Pérez, D. G., Garavaglia, M., and Rosso, O. A. (2007). Inefficiency in latin-american market indices. The European Physical Journal B - Condensed Matter and Complex Systems, 60:111–121.
- Zunino et al., [2011] Zunino, L., Tabak, B. M., Serinaldi, F., Zanin, M., Pérez, D. G., and Rosso, O. A. (2011). Commodity predictability analysis with a permutation information theory approach. Physica A: Statistical Mechanics and its Applications, 390(5):876–890.
- Zunino et al., [2010] Zunino, L., Zanin, M., Tabak, B. M., Pérez, D. G., and Rosso, O. A. (2010). Complexity-entropy causality plane: A useful approach to quantify the stock market inefficiency. Physica A: Statistical Mechanics and its Applications, 389(9):1891–1901.