Opaque Service Virtualisation: A Practical Tool for Emulating Endpoint Systems
Abstract
Large enterprise software systems make many complex interactions with other services in their environment. Developing and testing for production-like conditions is therefore a very challenging task. Current approaches include emulation of dependent services using either explicit modelling or record-and-replay approaches. Models require deep knowledge of the target services while record-and-replay is limited in accuracy. Both face developmental and scaling issues. We present a new technique that improves the accuracy of record-and-replay approaches, without requiring prior knowledge of the service protocols. The approach uses Multiple Sequence Alignment to derive message prototypes from recorded system interactions and a scheme to match incoming request messages against prototypes to generate response messages. We use a modified Needleman-Wunsch algorithm for distance calculation during message matching. Our approach has shown greater than 99% accuracy for four evaluated enterprise system messaging protocols. The approach has been successfully integrated into the CA Service Virtualization commercial product to complement its existing techniques.
1 Introduction
Large enterprise software systems must be rigorously tested before deployment. However, modern software systems are becoming ever increasingly inter-connected. In a typical deployment scenario, an enterprise system might interact with many other disparate systems, such as mainframes, directory servers, databases, and other types of software services. In order to check whether the enterprise system will function correctly in terms of its interactions with these services, it is necessary to test it in as realistic an environment as possible, prior to the updated system’s actual deployment. In the increasingly popular DevOps (Development-Operations) environments [1] where changes are continuously pushed out to users, this testing needs to be carried out both rigorously but also quickly and often repeatedly in a short period.
Getting access to the actual production environment for testing is not possible due to the risk of disruption. Large organisations often have a test environment, which is a close replication of their production environment, but this is both very expensive to set up and use. Furthermore the test environment is in high demand, so software developers will have only limited access to it, which may greatly slow releases. Enabling developers to have continuous access to production-like conditions to test their application is an important part of DevOps but is as yet an unsolved problem. One popular approach, to test an application’s dependence on other systems, is to install the other systems on virtual machines (such as VMware) [2]. However, virtual machines are time consuming to configure and maintain. Furthermore, the configuration of the systems running on the virtual machine is likely to be different to the production environment.
An alternative that is gaining traction is service emulation (also called service virtualisation), where models of services are emulated to provide more realistic scale and less complicated configuration[3]. However, existing approaches to service emulation require detailed knowledge of the target service’s protocol and message structure. Emulation tools provide data protocol handlers for built-in support of commonly used protocols, but it is not possible to support every protocol used by every application. Where a target service uses a protocol not supported by the emulation tool, then system experts need to explicitly model the target services. This is often infeasible if the required knowledge is unavailable for the wide range of services in a real deployment environment, especially legacy services, [4], and is very time consuming and error-prone.
In this paper we describe our work in developing a practical, scalable and fully automated approach to service emulation which uses no explicit knowledge of the services, their message protocols and structures, and yet can simulate – to a high degree of accuracy and scale – a realistic enterprise system deployment environment. The approach achieves very high assurance, real-time performance, and is robust under varying message encodings, operation types and payloads. Our focus is on generating service responses to enterprise system requests, not models of the target services, unlike most other work in this domain [3]. Our approach can very often successfully emulate a response to a system-under-test request, to support its testing under realistic deployment conditions. The technique thus compliments rather than replaces other conformance and integration testing techniques.
Our approach, called opaque service virtualisation, is based on analysing message traces. The method extracts the descriptive prototypes for each type of protocol operation. These prototypes form the basis of an opaque service model which can be used at runtime to send back the real-time responses to live requests coming from a system-under-test.
We describe our experience in taking our research proof-of-concept implementation and re-engineering it for incorporation into the CA Technologies’ commercial product, CA Service Virtualization. Our technique has been successfully integrated into Service Virtualization and deployed to thousands of users.
2 Related Work
The most common approach to providing a testing environment for enterprise systems using such a messaging protocol is to use virtual machines [5]. Implementations of the services are deployed on virtual machines and communicated with by the system under test. Major challenges with this approach include configuration complexity [6] and the need to maintain instances of each and every service type in multiple configurations [7]. Recently, cloud-based testing environments [8] as well as containerisation [9] have emerged to mitigate some of these issues.
Emulated testing environments for enterprise systems, relying on service models, is another approach. When sent messages by the system under test, the emulation responds with approximations of “real” service response messages [10]. Kaluta [3] is proposed to provision emulated testing environments. Challenges with these approaches include developing the models, lack of precision in the models, especially for complex protocols, and ensuring robustness of the models under diverse load conditions [11]. To assist developing reusable service models, approaches either reverse engineer message structures [12], or discover processes [13]. While these allow engineers to develop more precise models, none of them can automate the creation of executable interactive models of the communication between a system under test and the dependency services.
Recording and replaying message traces is an alternative approach. This involves recording request messages sent by the system under test to real services and response messages from these services, and then using these message traces to ‘mimic’ the real service response messages in the emulation environment [14]. Some approaches combine record-and-replay with reverse-engineered service models. CA Service Virtualization [15] is a commercial software tool, which can emulate the behaviour of services. The tool uses built-in knowledge of some protocol message structures to model services and mimic interactions automatically. However, current approaches have limited robustness, accuracy and performance.
In contrast, our goal is to produce an emulation environment for enterprise system testing that uses message trace recordings collected a priori to produce a response on behalf of a service when invoked by a system-under-test at runtime that is fast, accurate and has no knowledge of the underlying protocols.
3 Approach
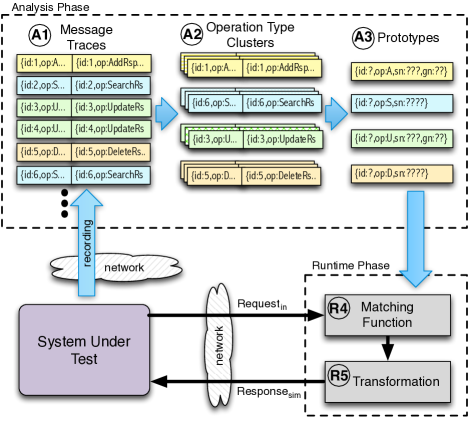
The approach we take is to cluster the trace recordings into groups of similar messages and then formulate a single representation – a prototype capturing the common features – for the request messages of each cluster. This accelerates runtime performance by enabling incoming requests from the system under test to be compared only to the prototypes rather than every recorded request. Our approach (see Figure 1) consists of two stages: an analysis phase which is performed offline, and a runtime (or playback) phase.
The analysis phase includes three steps:
- A1
-
We collect message traces of communications be- tween a client and the real target service and store them in a transaction library.
- A2
-
We cluster the transaction library, with the goal of grouping transactions (request-response pairs) by operation type. We do not consider the state of service under which the requests are issued. (This may give lower accuracy but is still useful in many cases as discussed in Section 7)
- A3
-
We derive a request prototype for each operation type cluster by performing a multiple sequence alignment and extracting common patterns.
A further two steps are performed at runtime:
- R4
-
For an incoming live request message received from the system-under-test, we use a matching distance calculation technique to select the nearest matching request prototype.
- R5
-
We perform dynamic substitutions on a specifically chosen response message from the identified operation type cluster to generate a modified response message sent back to the system-under-test.
3.1 Needleman-Wunsch
The Needleman-Wunsch algorithm [16] is a dynamic programming algorithm for computing the edit distance between two sequences. We use it at different steps during both the analysis and runtime phases. Needleman-Wunsch finds the globally optimal alignment for two sequences of symbols in time, where and are the lengths of the sequences. The algorithm uses a progressive scoring function , which gives an incremental score for each pair of symbols in the alignment. A different score will be given depending on whether the symbols are identical, different, or a gap has been inserted.
3.2 Capturing Message Traces (Step A1)
| Index | Request | Response |
|---|---|---|
| 1 | {id:1,op:S,sn:Du} | {id:1,op:SearchRsp,result:Ok,gn:Miao,sn:Du,mobile:5362634} |
| 13 | {id:13,op:S,sn:Versteeg} | {id:13,op:SearchRsp,result:Ok,gn:Steve,sn:Versteeg,mobile:9374723} |
| 24 | {id:24,op:A,sn:Schneider,mobile:123456} | {id:24,op:AddRsp,result:Ok} |
| 275 | {id:275,op:S,sn:Han} | {id:275,op:SearchRsp,result:Ok,gn:Jun,sn:Han,mobile:33333333} |
| 490 | {id:490,op:S,sn:Grundy} | {id:490,op:SearchRsp,result:Ok,gn:John,sn:Grundy,mobile:44444444} |
| 2273 | {id:2273,op:S,sn:Schneider} | {id:2273,op:SearchRsp,result:Ok,sn:Schneider,mobile:123456} |
| 2487 | {id:2487,op:A,sn:Will} | {id:2487,op:AddRsp,result:Ok} |
| 3106 | {id:3106,op:A,sn:Hine,gn:Cam,Postcode:33589} | {id:3106,op:AddRsp,result:Ok} |
The first step is to record real message exchanges between a client (such as a previous version of the system under test) and the service we aim to emulate, and store them in a transaction library. A transaction records a request sent by the client and the responses (zero or more) returned by the service. We capture transactions at the network level (using a tool such as Wireshark) to record the bytes in TCP packet payloads. We thereby make no assumptions about the service message format. Table 1 shows a small example transaction library which we use in the following sections to illustrate how our method works. It is from a fictional directory service protocol that has some similarities to the widely used LDAP protocol [17], but is simplified to make our running example easier to follow. Our example protocol uses a JSON encoding. The transaction library contains two kinds of operations: add and search. Add requests contain the field ‘op:A’, whereas search requests have ‘op:S’. The add and search response operations are specified with the fields ‘op:AddRsp’ and ‘op:SearchRsp’, respectively.
3.3 Clustering Transactions (Step A2)
Having recorded our transaction library, the next step is to group the transactions by operation type, but again without assuming any knowledge of the message format. To achieve this we use a distance function-based clustering technique. In our previous work [18] we considered multiple cluster distance functions and found that the response similarity (as measured by edit distance, calculated using the Needleman-Wunsch algorithm [16]) was the most effective method for grouping transactions of the same operation type. We therefore use the same technique in this work, grouping transactions by the similarity of their response messages. The clustering algorithm used was VAT [19], one among many alternatives, as it was effective in our previous work [18].
Clustering the example transaction library yields two clusters, as shown in tables 2 and 3, corresponding to the add and search operations, respectively.
| Index | Request | Response |
|---|---|---|
| 1 | {id:1,op:S,sn:Du} | {id:1,op:SearchRsp,result:Ok,gn:Miao,sn:Du,mobile:5362634} |
| 13 | {id:13,op:S,sn:Versteeg} | {id:13,op:SearchRsp,result:Ok,gn:Steve,sn:Versteeg,mobile:9374723} |
| 275 | {id:275,op:S,sn:Han} | {id:275,op:SearchRsp,result:Ok,gn:Jun,sn:Han,mobile:33333333} |
| 490 | {id:490,op:S,sn:Grundy} | {id:490,op:SearchRsp,result:Ok,gn:John,sn:Grundy,mobile:44444444} |
| 2273 | {id:2273,op:S,sn:Schneider} | {id:2273,op:SearchRsp,result:Ok,sn:Schneider,mobile:123456} |
| Index | Request | Response |
|---|---|---|
| 24 | {id:24,op:A,sn:Schneider,mobile:123456} | {id:24,op:AddRsp,result:Ok} |
| 2487 | {id:2487,op:A,sn:Will} | {id:2487,op:AddRsp,result:Ok} |
| 3106 | {id:3106,op:A,sn:Hine,gn:Cam,postalCode:33589} | {Id:3106,Msg:AddRsp,result:Ok} |
3.4 The Request Prototype (Step A3)
The core contribution of our approach is a method to formulate representative prototypes. This step consists of three major subparts: (i) aligning the common features of the request messages in a cluster, (ii) extracting the common features while accommodating variations to derive the prototype, and (iii) weighting sections of the prototype according to their relative importance through an entropy analysis.
3.4.1 Multiple Sequence Alignment
In aligning the request messages of a cluster, we adopt the multiple sequence alignment (MSA) technique [20] originated from bioinformatics. MSA was first used to align three or more biological sequences to reveal their structural commonalities [21]111For this reason this technique has also been widely used to reverse-engineer protocol message structures [22].. Specifically, we adopt ClustalW [23], a widely used heuristic technique for MSA. It is memory efficient and is shown to produce high accuracy alignments in polynomial computation time for empirical datasets (in contrast to the original NP-complete MSA technique [20]).
Figure 2 shows the multiple sequence alignment results of applying the algorithm to the example clusters from tables 2 and 3. The MSA results are known as profiles. Gaps which were inserted during the alignment process are denoted by the ‘’ symbol.
{id:1,op:S,sn:Du} {id:13,op:S,sn:Versteeg}
{id:2273,op:S,sn:Schneider}
{id:275,op:S,sn:Han}
{id:490,op:S,sn:Grundy}
{id:24,op:A,sn:Schneider,mobile:123456} {id:2487,op:A,sn:Will} {id:3106,op:A,sn:Hine,gn:Cameron,postalCode:33589}
3.4.2 Formulating the Request Prototype
Having derived the MSA profile for the request messages of each cluster, the next step is to extract the common features from the MSA profile into a single character sequence, which we call the request prototype, to facilitate efficient runtime comparison with an incoming request message.
From all the aligned request messages in a cluster, we derive a byte (or character) occurrence count table. Figure 3 graphically depicts byte frequencies at each position for the example alignment in Figure 2. Each column represents a position in the alignment result. The frequencies of the different bytes occurring at each position are displayed as a stacked bar graph.
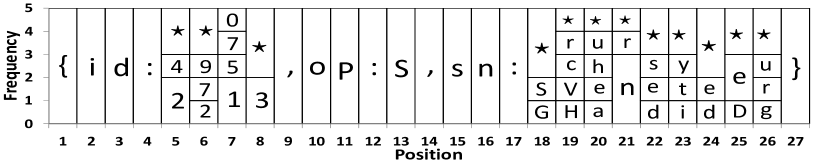
Based on the byte occurrence table, we formulate the request prototype by extending the concept of a consensus sequence [24] commonly used in summarising a MSA profile. A consensus sequence can be viewed as a sequence of consensus symbols, where the consensus symbol is the most commonly occurring byte at the position . In our extension, a request prototype, , is calculated by iterating each byte position of the MSA profile, to calculate a prototype symbol, , at each position, according to Equation 1
| (1) |
where denotes the relative frequency at position of the consensus symbol , the relative frequency threshold, ‘’ a gap, ‘’ the ‘wildcard’ symbol, and ‘’ represents a truncation. After calculating the prototype symbol for each position, any truncation symbols are then deleted from the request prototype.
Introducing wildcards and truncations into the prototypes allows us to distinguish between gaps and where there is no consensus. If the relative frequency is at or above the threshold , we insert the consensus symbol into our prototype (unless the consensus symbol is a gap). If the relative frequency is below the threshold, then we insert a wildcard. If the consensus symbol is a gap and it is in the majority, then we leave that position as empty (i.e. deleted). Wildcards allow us to encode where there are high variability sections of the message. Our experiments have shown that without truncation, consensus sequences became artificially long as there are generally many gaps. By truncating the gaps, the lengths of the prototypes become similar to the typical lengths of messages in the cluster. The prototype for a cluster of request messages can differentiate stable positions from variant positions. Moreover, it can identify consensus symbols that can be utilised for matching.
Applying our request prototype method, using a frequency threshold , to the example clusters in tables 2 and 3 yield the following results:
Request prototype for the search cluster:
{id:,op:S,sn:}
Request prototype for the add cluster:
{id:,op:A,sn:l}
Please note that the add prototype contains an ‘l’ from coincidentally aligning ‘l’s from ‘mobile’, ‘Will’ and ‘postalCode’.
3.4.3 Deriving Entropy-Based Positional Weightings
The final substep of the offline analysis is to estimate the importance of different sections of the prototype to be used as weights during the matching at runtime. Our aim is to give a greater weight to the bytes that correspond to the operation type. We make use of the observation that structure information (such as operation type) is more stable than payload information. We use entropy, as defined by the Shannon Index [25], as an estimation of instability. Using the aligned messages for each cluster, we calculate the inverse entropy at each byte position aligned to the prototype, to derive a weightings array, , of the same length as the prototype . Full details of the calculation method are given in [26].
3.5 Live Request Runtime Matching (Step R4)
At runtime, the formulated request prototypes are used to match incoming requests from the system under test. We adapt the Needleman-Wunsch algorithm to calculate the matching distance between an incoming request and the request prototype for each operation type (or cluster). We modify the Needleman-Wunsch scoring function, (see equation 2), by giving a special score for alignments with wildcard characters and multiplying all scores by their corresponding positional entropy weights (from equation 2).
| (2) |
where denotes the th character in the prototype, the th character in the incoming request, the weighting value (cf. 3.4.3), and and denote constants of the Needleman-Wunsch identical score and difference penalty, respectively, and finally denotes the wildcard matching constant. In our experiments we used standard values for the Needleman-Wunsch constants: , and used .
Using the modified scoring equation 2, we apply Needleman-Wunsch to align the consensus prototype with an incoming request, calculating an absolute alignment score, .
The relative distance, denoted as , is calculated from the absolute alignment score to normalise for consensus prototypes of different lengths, different entropy weights and different numbers of wildcards. The relative distance is in the range 0 to 1, inclusive, where 0 signifies the best possible match with the consensus, and 1 represents the furthest possible distance. It is calculated according to Equation 3:
| (3) |
where denotes the maximum possible alignment score and the minimum possible alignment score for the given prototype as defined by equations 4 and 5, respectively.
| (4) |
| (5) |
denotes a special symbol different to all characters in the prototype.
The prototype with the least distance to the incoming message is selected as the matching prototype, therefore identifying the matching transaction cluster.
As an example, consider an incoming add request with the byte sequence {id:37,op:A,sn:Durand}. Aligning the request against the search prototype yields
| request: | {id:37,op:A,sn:Durand} |
|---|---|
| prototype: | {id:???,op:S,sn:???????} |
Using Equation 3, the weighted relative distance is calculated to be 0.0715. In comparison, the add consensus prototype produces the alignment below with a relative distance of 0.068.
| request: | {id:37,op:A,sn:Durand} |
|---|---|
| prototype: | {id:????,op:A,sn:?????????????l???????} |
Consequently, the add prototype is the closest matching, causing the add cluster to be selected.
3.6 Response Transformation (Step R5)
The final step in our approach is to send a customised response for the incoming request by performing some dynamic substitutions on a response message from the matched cluster. Here we use the symmetric field technique described in [27], where character sequences which occur in both the request and response messages of the chosen transaction are substituted with the corresponding characters from the live request in the generated response. We take the response from the centroid transaction [18] of the selected cluster and apply the symmetric field substitution.
In our example, the centroid transaction from the add cluster is given below. There is one symmetric field (boxed).
| request: | {id:24,op:A,sn:Schneider,mobile:123456} |
| response: | {id:24,op:AddRsp,result:Ok} |
After performing the symmetric field substitution the final generated response is {id:37,op:AddRsp,result:Ok}
4 Experimental Evaluation
We wanted to assess two key characteristics of our request prototype approach: accuracy and efficiency, aiming to answer the following research questions:
-
1.
RQ1 (Accuracy): having request prototypes formulated at the pre-processing stage, is our approach able to generate accurate, protocol-conformant responses?
-
2.
RQ2 (Efficiency): is our technique efficient enough to generate timely responses, even for large transaction libraries?
A more fine-grained evaluation of the approach and its sensitivity to parameter values used in the algorithms is available in [26].
4.1 Case Study Protocols and Traces
| Protocol | Binary/Text | Fields | #Ops. | #Transactions |
|---|---|---|---|---|
| IMS | binary | fixed length | 5 | 800 |
| LDAP | binary | length-encoded | 10 | 2177 |
| SOAP | text | delimited | 6 | 1000 |
| Twitter (REST) | text | delimited | 6 | 1825 |
In order to answer these questions, we applied our technique on message trace datasets from 4 case study protocols: IMS [28] (a binary mainframe protocol), LDAP [17] (a binary directory service protocol), SOAP [29] (a textual protocol, with an Enterprise Resource Planning (ERP) system messaging system services), and RESTful Twitter [30] (a JSON protocol for the Twitter social media service). We chose these 4 protocols because: (i) they are widely used in enterprise environments, (ii) they represent a good mix of text-based protocols (SOAP and RESTful Twitter) and binary protocols (IMS and LDAP), (iii) they use either fixed length, length encoding or delimiters to structure protocol messages,222Given a protocol message, length fields or delimiters are used to convert its structure into a sequence of bytes that can be transmitted over the wire. Specifically, a length field is a number of bytes that show the length of another field, while a delimiter is a byte (or byte sequence) with a known value that indicates the end of a field. and (iv) each of them includes a diverse number of operation types, as indicated by the Ops column. The number of request-response interactions for each test case is shown as column #Transactions in Table 4.
Our message trace datasets are available for download at http://quoll.ict.swin.edu.au/doc/message_traces.html
| Incoming Request | {id:15,op:S,sn:Du} |
|---|---|
| Expected Response | {id:15,op:SearchRsp,result:Ok,gn:Miao,sn:Du} |
| Valid Responses | {id:15,op:SearchRsp,result:Ok,gn:Miao,sn:Du} |
| {id:15,op:SearchRsp,result:Ok,gn:Menka,sn:Du} | |
| Invalid Responses | {id:15,op:AddRsp,result:Ok} |
| {id:15,op:SearchRsp,result:Ok,gn:Miao},sn:Du |
4.2 Compared Techniques
We compared the proposed Prototype method with two other methods. The baseline for comparison was a hash lookup. If the hash code of an incoming request matched the hash code of a request in the transaction library, then the associated response was replayed (without any transformation). This approach can only work when a request identical to the live request occurred in the recording. It is a standard record-and-replay approach used for situations where nothing is known about the protocol. Our second compared technique is the Whole Library [27] approach, an earlier version of opaque service virtualisation which does not have an analysis phase. It compares an incoming request to the raw requests in the entire transaction library, and for the nearest matching request, the associated response is transformed, using the same method as described in Section 3.6. Its weaknesses are that it cannot generate responses in real-time for large transaction libraries, and it is susceptible to sending back responses of the wrong operation type if the transaction library contains a recorded request of a different operation but with similar payload information.
4.3 Accuracy Evaluation (RQ1)
4.3.1 Methodology
Cross-validation is a popular model validation method for assessing how accurately a predictive model will perform in practice. For the purpose of our evaluation, we applied the commonly used 10-fold cross-validation approach [31] to all 4 case study datasets.
We randomly partitioned each of the original interaction datasets into 10 groups. Of these 10 groups, one group is considered to be the evaluation group for testing our approach, and the remaining 9 groups constitute the training set. This process is then repeated 10 times (the same as the number of groups), so that each of the 10 groups will be used as the evaluation group once. When running each experiment with each trace dataset, we applied our approach to each request message in the evaluation group, referred to as the incoming request, to generate an emulated response. The entire cross validation process was repeated ten times for each experiment using different random seeds.
Having generated a response for each incoming request, we then used a validation script to assess the accuracy. The script used a protocol decoder to parse the emulated response and then compared it to the original recorded response (the expected response) from the evaluation group. The emulated response was classified as valid or invalid, according to the following definitions:
-
1.
Valid: the emulated response conformed to the protocol message format (i.e. was successfully parsed by the decoder) and the operation type of the emulated response was the same as the expected response. Note that contents of the emulated response payload may differ to the expected response and still be considered valid.
-
2.
Invalid: the emulated response was not structured according to the expected message format of the protocol, or the operation type of the emulated response was different to the expected response.
Table 5 shows some example valid and invalid responses to a given request.
4.3.2 Results
Table 6 summarises the accuracy of the consensus prototype approach versus the whole library approach for the 4 datasets evaluated. We defined accuracy as the ratio of valid responses generated versus the total size of the dataset.
The Prototype approach has a high accuracy for all 4 protocols tested. It produces 100% accuracy for the IMS and SOAP datasets, and greater than 99% accuracy for LDAP and Twitter. The Prototype approach is also significantly more accurate than the Whole Library approach for two of the four protocols tested (IMS and LDAP). It is equally accurate for the SOAP dataset (both 100%) and marginally less accurate for Twitter. Overall, the Prototype approach outperforms the Whole Library approach with regards to accuracy. This is despite the latter approach accessing all the available data points in the recording when matching requests, whereas the Prototype method only makes use of a compressed representation during the matching process. The reason for the higher accuracy is that the prototype abstracts away the message payload information sections (using wildcards), so is less susceptible to matching a request to the wrong operation type but with the right payload information, whereas the Whole Library approach is susceptible to this type of error (note the well-formed but invalid responses for the Whole Library approach in Table 6). The hash lookup approach had low accuracy: although it produced 50% accuracy for the IMS dataset, this was only for the IMS acknowledgements as these messages are all identical.
| Hash Lookup | Whole Library | Prototype | |
|---|---|---|---|
| IMS | 50.0% | 75.25% | 100% |
| LDAP | 5.36% | 94.12 % | 99.95% |
| SOAP | 0.5% | 100% | 100% |
| 30.1% | 99.56% | 99.34% |
4.4 Efficiency (RQ2)
4.4.1 Methodology
We instrumented the response generation calls made during the cross validation evaluation to log the response times. We then calculated the average response generation time for each approach and protocol. Tests were run on an Intel Xeon E5440 2.83GHz CPUs with 24GB of main memory available. For comparison we also logged the actual response generation times of the real services during the message trace recording process.
| No. | Hash Lookup | Whole Library | Prototype | Real System | |
|---|---|---|---|---|---|
| IMS | 800 | 0.11 | 470.99 | 3.24 | 518 |
| LDAP | 2177 | 0.11 | 835.91 | 2.88 | 28 |
| SOAP | 1000 | 0.11 | 380.24 | 3.35 | 65 |
| 1825 | 0.11 | 464.09 | 36.62 | 417 |
4.4.2 Results
Table 7 compares the average response generation time of the Whole Library and Prototype approaches. Also shown are average response times of the real services. The results show that the Prototype approach is very efficient at generating responses. The approach is about two orders of magnitude faster than the Whole Library approach. The Prototype approach is also significantly faster than the real services being emulated. This is crucial for supporting testing of an enterprise system under test under realistic performance conditions (delays can be added to slow down the emulated response, but not the other way around.)
It should be noted that the LDAP and SOAP services ran on the local network, whereas IMS and Twitter were remote services. To compensate for the remote access network latency, we subtracted this (around 15 milliseconds) from the response times. Even allowing for network latency, the Prototype method was still faster than the real services. For comparison, we included response times of the hash lookup method. The response retrieval time was near instant (less than 0.005 milliseconds). Local network latency was the major component of total response generation time, about 0.11 milliseconds.
5 Product Integration
Opaque service virtualisation has recently been integrated into CA Technologies’ commercial product: CA Service Virtualization, as a new feature named “Opaque Data Processing” (ODP). ODP was initially included in CA Service Virtualization version 8.0, released in January 2015, and has been sold to customers [32]. The implementation of ODP in version 8.0 followed the Whole Library approach [27]. The prototype approach proposed in this paper was released in version 9.1 of CA Service Virtualization. We describe some of the implementation details to industrialise the approach and key lessons learned.
5.1 Implementation Architecture
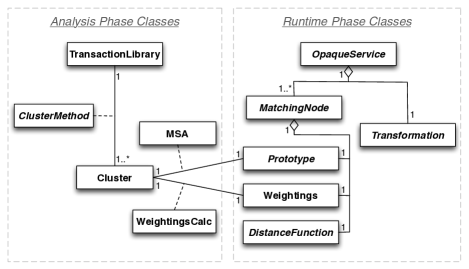
We implemented our approach (see section 3) as a Java package codenamed ‘Bilby’. Due to commercial agreements we are unable to release the source code but we will describe the key aspects of the implementation. Figure 4 shows a UML diagram of the key Bilby classes. The implementation consists of two parts: classes to support the analysis phase and classes to support the runtime (playback) phase.
For the analysis phase, the transactions collected during the network recording are stored in an TransactionLibrary class. The clustering is done via a ClusterMethod, returning a list of Cluster classes. Each cluster is then used to derive a Prototype and a Weightings class, via the algorithms encoded in the MSA and WeightingsCalc classes, respectively.
For the runtime phase, the top level interface is given by an OpaqueService class, which is composed of a list of MatchingNodes and a Transformation class. A MatchingNode is realised by aggregating a Prototype and the associated Weightings with a DistanceFunction (the method for calculating the distance between two messages).
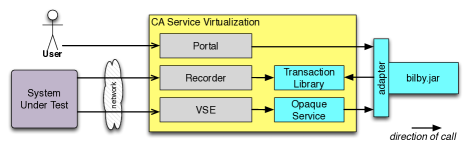
The Bilby package is a jar (Java Archive) and is integrated into the CA Service Virtualization product. An adapter was written to convert between the internal data structures used by CA Service Virtualization and Bilby, specifically for requests and responses. CA Service Virtualization has a component called the Virtual Service Environment (VSE), which is a platform for deploying virtual service models. The VSE routes all the network communications between external systems (i.e. systems-under-test) and the service models. The VSE supports different kinds of service models. A new type of VSE model was written to support opaque services, which acts as a wrapper to invoke the Bilby classes. Figure 6 schematically depicts the key elements of the integration.
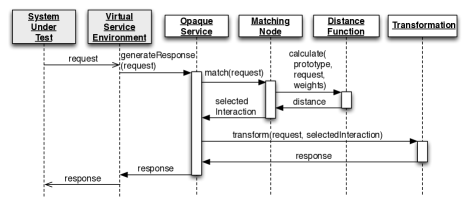
Figure 5 depicts a UML sequence diagram of a playback event. A request from the system-under-test is received by the VSE. The VSE invokes the OpaqueService class to generate a response. The OpaqueService class queries all of its MatchingNodes to find the best matching prototype and the associated interaction. The Transformation class is then invoked to perform the symmetric field substitutions to obtain the final response. The response is then passed back up the call stack and sent back to the system-under-test.
Extending the CA Service Virtualization user interface portal to support opaque services was the final integration task. Creating an opaque service has three stages in the user interface: Record, Configure and Save. Record is where interactions between the target service and a system-under-test are captured. Configure is where the analysis phase is performed. The user supervises the clustering process and is allowed to tune the parameters that will be used for message matching. Once the opaque service is saved it may be deployed in the VSE like any other virtual service.
5.2 Challenges and Lessons Learned
Opaque service virtualization invalidated one of the initial assumptions of the CA Service Virtualization’s architecture – that all protocol handlers require a parsing step. The CA Service Virtualization architecture supports multi-layers of protocol handlers: one layer for a transport protocol handler and one or more layers for data protocol handlers. The data protocol handler architecture makes the assumption that the message structure will be parsed and message fields will be extracted. However, the opaque service virtualization does not conform to this pattern, as no fields are explicitly extracted from the messages and the matching is done on the raw bytes. For the initial integration performed in the 8.0 release, a workaround to the architectural constraints was to make ODP an extension of the TCP transport protocol handler. The limitation of this approach was that ODP was explicitly tied to TCP and could not be used in conjunction with any other protocol handler. For the 9.0 release integration, the CA Service Virtualization’s overall architecture was rethought to accommodate ODP, allowing it to be combined with any transport protocol handler.
The user interface for the opaque service virtualization also posed challenges. ODP deploys some sophisticated algorithms which are not necessarily easy for users to understand. We therefore carefully considered which of the algorithms’ parameters should be exposed to the user, and had to provide robust default settings. An example of this was the clustering algorithm used. Rather than requiring the user to interactively select clusters (as is required with VAT) we switched to an automated clustering process which only requires the user to estimate the number of operation types [33].
Strong collaboration between the research team, the engineering product team and product management (located in Australia and the United States) was key to successful productisation. This required open mindedness on all sides. Monthly teleconferences between the researchers and product team helped develop a joint understanding of the practical problems, identify research topics, and facilitate an exchange of ideas. There is also a big gap between a research prototype and a commercial quality software application. The initial implementation was redesigned and rewritten from scratch, jointly by the researchers and software engineers from the product team. To enable this collaboration a git repository was set up, accessible to both the university and CA Technologies staff. A representative of the research team travelled to the product team’s development site for key stages of the integration work.
6 Three End User Experiences
We illustrate the ODP’s utility with three deployment examples from end user organisations. The case studies are based on information provided by technical services staff working at the end user organisation sites. Due to confidentiality agreements, the specifics and names of the organisations cannot be given, but we will describe them in general terms. For the three case studies we examine the number of transactions recorded and used for validation, the accuracy and whether or not the service virtualisation was ultimately successful. Table 8 summarises this information.
| Protocol | Recording #Trans. | Validation #Trans. | #Ops. | Accuracy | Success |
|---|---|---|---|---|---|
| IMS | 10 | 10 | 5 | 100% | Yes |
| HL7 | 1000 | 1000 | 5 | 100% | n/a |
| Tuxedo | 18 | 18 | 9 | 83% | No |
The first use case example was at a bank. The bank was undertaking a service virtualisation project to facilitate rapid application deployment. One of the dependent systems that needed to be virtualised was a mainframe application which used the IMS protocol. Although IMS is supported by CA Service Virtualization, the target dependency system used an extension to IMS not supported by the data protocol handler. Without using ODP this would have meant rebuilding the model for this IMS end point at great time and effort.
For the IMS service, communications with the system-under-test were recorded, with two sample transactions for each of the five operation types. An Opaque Service model was then created from the recording. The system-under-test then connected to the opaque virtual service model and sent a series of requests to the model, which sent back valid responses to the system-under-test. ODP enabled a successful virtualisation of the IMS service that would otherwise have been much more time-consuming and difficult.
The second example use case was at a health service provider. The provider used a domain specific protocol, called HL7 [34], for applications to communicate to the patient database. There are different versions of the HL7 protocol, with the healthcare provider using an older version. HL7 was not supported by CA Service Virtualization. It was also considered uneconomic to write a specialised data protocol handler for an older version of a protocol used by only one customer. ODP was therefore used to create a virtual service model of the target HL7 services.
HL7 is a textual format which uses special characters to delimit fields and records. We recorded a sample of 1000 requests and responses and applied a cross validation experiment (following the method in cf. 4) to measure the accuracy of ODP on the HL7 protocol. The experimental results showed that ODP produced valid responses with 100% accuracy for the sample data. These results show that ODP can be used to support protocols not handled by the built-in data protocol handlers. At the time of writing the opaque service model has not yet been deployed at the health care provider’s site.
The third example is at a car rental company, which was undertaking a service virtualisation. One of the target services used Oracle Tuxedo, a middleware protocol, which CA Service Virtualization has no built-in data protocol handler for. The technical staff therefore tried ODP to virtualise the service. The service used nine different operation types. For each operation type two sample transactions were recorded. When the system-under-test connected to the opaque service model, after an initial exchange of messages, the system-under-test would hang. An examination of the message logs revealed that the conversations between the Tuxedo service and system-under-test were invoked bidirectionally, i.e. the Tuxedo service sometimes sent requests to the system-under-test. During model playback, the system-under-test would hang while waiting to receive a request from the model service. ODP does not currently support message bus style communication. ODP was therefore not successful for this use case.
Overall the analysis of the use of opaque service virtualisation at end user organisations shows that it can successfully build service models where no data protocol handler exists. It is not successful in all cases. In particular the Tuxedo use case shows that there is a need to expand functionality to support message bus-style and other middleware protocols in addition to client-server protocols.
7 Discussion and Future Work
We have developed an approach, opaque service virtualisation, for automatically generating service responses from message traces which requires no prior knowledge of message structure or decoders or message schemas. Our approach of using multiple sequence alignment to automatically generate prototypes for the purpose of matching request messages is shown to be accurate, efficient and robust. Wildcards in the prototypes allow the stable and unstable parts of the request messages for the various operation types to be separated. Rather than using the prototypes directly for strict matching (such as using it as a regular expression) we instead calculate matching distance through a modified Needleman-Wunsch alignment algorithm. Since we look for the closest matching prototype, the method is robust even if the prototypes are imperfect. Moreover, this process can match requests which are slightly different to the prototypes, or are of different length to the prototypes. This allows the system to handle requests which are outside of the cases directly observed in the trace recordings.
Opaque service virtualisation was integrated with a commercial product and has been used at customer sites, where protocols not supported by existing tools were successfully emulated. Protocol models did not need to be manually developed, making it quicker, and more robust, to deploy opaque service virtualisation than using explicitly modelled protocols.
Further challenges need to be addressed. The number of transactions used in recordings at customer sites are typically much smaller than used in our experiments, and this may affect the response accuracy. We will need to retest our approach with smaller transaction libraries and possibly refine our technique accordingly, or propose a method for customers to easily obtain larger recordings. There are also user experience considerations. There is a need to enable human intervention, particularly to correct the automated process where mistakes occur, since some scenarios require 100% accuracy. Our approach uses algorithms not easily understandable by end users. A balance needs to be struck between enabling user control versus not overwhelming the user with the algorithm details. The customer use cases also demonstrated the need to support message bus protocols. Efficiency can also be further improved, particularly for matching long messages. Using an approximate measure of edit distance is an avenue for exploration [35].
Our approach does not consider the service state history in formulating responses. Somewhat surprisingly, in practice a stateless model is sufficient in many cases for emulating a deployment environment. For example: (i) when the emulation target service is stateless, or (ii) when the testing scenario does not contain two equivalent requests, requiring different state affected responses, or (iii) where the testing scenario does not require highly accurate responses (e.g. performance and reliability testing rather than conformance testing). To address this limitation, an avenue of future exploration is to process mine the operation sequences to discover stateful models and produce stateful responses. Future work will address stateful modelling, such that writes and updates affect future responses. A method for doing this is to use finite state machine models for the service state as well the state of individual data records.
8 Summary
We have described a novel technique for emulating large scale deployments of complex service-based systems. Our opaque service virtualisation technique has been integrated into a commercial product, CA Service Virtualization, and successfully deployed on customer sites demonstrating its industrial utility. The growing practice of DevOps needs more tools to support production-like test conditions at all stages of the software development lifecycle. Opaque service virtualisation is a promising new tool to help support emulation of complex service-based environments via more accurate request/response trace capture and replay with no knowledge of protocols and no need to construct models of protocols.
9 Acknowledgments
This research was supported by ARC grant LP150100892.
References
- [1] L. Bass, I. Weber, and L. Zhu, DevOps: A Software Architect’s Perspective. Addison-Wesley Professional, 2015.
- [2] J. Sugerman, G. Venkitachalam, and B.-H. Lim, “Virtualizing i/o devices on vmware workstation’s hosted virtual machine monitor,” in Proceedings of the General Track: 2001 USENIX Annual Technical Conference (USENIX 2001), USA, 2001, pp. 1–14.
- [3] C. Hine, “Emulating enterprise software environments,” PhD thesis, Swinburne University of Technology, Faculty of Information and Communication Technologies, 2012. [Online]. Available: http://quoll.ict.swin.edu.au/doc/cmh-phd-thesis.pdf
- [4] S. Ghosh and A. P. Mathur, “Issues in Testing Distributed Component-Based Systems,” in 1st International ICSE Workshop on Testing Distributed Component-Based Systems (ICSE 1999), USA, 1999.
- [5] P. Li, “Selecting and Using Virtualization Solutions: our Experiences with VMware and VirtualBox,” Journal of Computing Sciences in Colleges, vol. 25, no. 3, pp. 11–17, 2010.
- [6] P. Godefroid, “Micro execution,” in 36th International Conference on Software Engineering (ICSE 2014), Hyderabad, India, 2014, pp. 539–549.
- [7] J. Grundy, Y. Cai, and A. Liu, “Softarch/mte: Generating distributed system test-beds from high-level software architecture descriptions,” Automated Software Engineering, vol. 12, no. 1, pp. 5–39, Jan. 2005.
- [8] T. Banzai, H. Koizumi, R. Kanbayashi, T. Imada, T. Hanawa, and M. Sato, “D-cloud: Design of a software testing environment for reliable distributed systems using cloud computing technology,” in 10th IEEE/ACM International Conference on Cluster, Cloud and Grid Computing (CCGrid 2010), Melbourne, Australia, 2010, pp. 631–636.
- [9] Docker Inc. (2015) Docker. [Online]. Available: http://docker.com
- [10] A. Bertolino, G. De Angelis, L. Frantzen, and A. Polini, “Model-based generation of testbeds for web services,” in Testing of Software and Communicating Systems, 2008, vol. 5047, pp. 266–282.
- [11] J. Sun and T. Mannisto, “Usefulness evaluation of simulation in server system testing,” in 36th IEEE Computer Software and Applications Conference (COMPSAC 2012), Izmir, Turkey, 2012, pp. 158–163.
- [12] W. Cui, J. Kannan, and H. J. Wang, “Discoverer: Automatic protocol reverse engineering from network traces,” in 16th USENIX Security Symposium (Security 2007), Boston, MA, USA, 2007, pp. 199–212.
- [13] J. De Weerdt, J. Vanthienen, B. Baesens et al., “Active trace clustering for improved process discovery,” IEEE Transactions on Knowledge and Data Engineering, vol. 25, no. 12, pp. 2708–2720, 2013.
- [14] W. Cui, V. Paxson, N. C. Weaver, and R. H. Katz, “Protocol-independent adaptive replay of application dialog,” in 13th Annual Network and Distributed System Security Symposium (NDSS 2006), San Diego, California, USA, 2006, pp. 1–15.
- [15] J. Michelsen and J. English, Service Virtualization: Reality is Overrated. Apress, September 2012.
- [16] S. B. Needleman and C. D. Wunsch, “A general method applicable to the search for similarities in the amino acid sequence of two proteins,” Journal of Molecular Biology, vol. 48, no. 3, pp. 443–453, 1970.
- [17] J. Sermersheim, “Lightweight Directory Access Protocol (LDAP): The Protocol,” 6 2006, RFC 4511.
- [18] M. Du, S. Versteeg, J.-G. Schneider, J. Han, and J. Grundy, “Interaction traces mining for efficient system responses generation,” in Proceedings of the 2nd International Workshop on Software Mining (SoftMine 2013), Palo Alto, CA, USA, 2013, pp. 1–8.
- [19] J. C. Bezdek and R. J. Hathaway, “Vat: A tool for visual assessment of (cluster) tendency,” in 2002 International Joint Conference on Neural Networks (IJCNN 2002), Honolulu, Hawaii, USA, 2002, pp. 2225–2230.
- [20] L. Wang and T. Jiang, “On the complexity of multiple sequence alignment,” Journal of computational biology, vol. 1, no. 4, pp. 337–348, 1994.
- [21] R. Durbin, Biological sequence analysis: probabilistic models of proteins and nucleic acids. Cambridge university press, 1998.
- [22] P. M. Comparetti, G. Wondracek, C. Kruegel, and E. Kirda, “Prospex: Protocol Specification Extraction,” in 30th IEEE Symposium on Security and Privacy (S&P 2009), Oakland, CA, USA, 2009, pp. 110–125.
- [23] J. D. Thompson, D. G. Higgins, and T. J. Gibson, “ClustalW: improving the sensitivity of progressive multiple sequence alignment through sequence weighting, position-specific gap penalties and weight matrix choice,” Nucleic Acids Research, vol. 22, no. 22, pp. 4673–4680, 1994.
- [24] W. H. Day and F. McMorris, “Critical comparison of consensus methods for molecular sequences,” Nucleic Acids Research, vol. 20, no. 5, pp. 1093–1099, 1992.
- [25] C. E. Shannon, “A mathematical theory of communication,” The Bell System Technical Journal, vol. 27, pp. 379–423,623–656, 1948.
- [26] M. Du, S. Versteeg, J.-G. Schneider, J. Grundy, and J. Han, “From network traces to system responses: Opaquely emulating software services,” Swinburne University of Technology, Faculty of Information and Technology, Tech. Rep., October 2015, arXiv preprint arXiv:1510.01421. [Online]. Available: http://arxiv.org/abs/1510.01421
- [27] M. Du, J.-G. Schneider, C. Hine, J. Grundy, and S. Versteeg, “Generating service models by trace subsequence substitution,” in Proceedings of the 9th International ACM Sigsoft Conference on Quality of Software Architectures (QoSA 2013), Vancouver, British Columbia, Canada, 2013, pp. 123–132.
- [28] R. Long, M. Harrington, R. Hain, and G. Nicholls, IMS Primer. IBM International Technical Support Organisation, 2000.
- [29] D. Box, D. Ehnebuske, G. Kakivaya, A. Layman, N. Mendelsohn, H. F. Nielsen, S. Thatte, and D. Winer, “Simple Object Access Protocol (SOAP) 1.1,” 5 2000, w3C Note 08 May 2000.
- [30] Twitter, “The Twitter REST API,” 2014. [Online]. Available: https://dev.twitter.com/docs/api
- [31] G. J. McLachlan, K.-A. Do, and C. Ambroise, Analyzing Microarray Gene Expression Data. Wiley-Interscience, 2004.
- [32] D. Swan, “Swinburne, CA Technologies in virtualisation breakthrough,” The Australian, December 16 2014. [Online]. Available: http://www.theaustralian.com.au/business/latest/swinburne-ca-technologies-in-virtualisation-breakthrough/story-e6frg90f-1227158041554
- [33] L. Wang, C. Leckie, K. Ramamohanarao, and J. Bezdek, “Automatically determining the number of clusters in unlabeled data sets,” Knowledge and Data Engineering, IEEE Transactions on, vol. 21, no. 3, pp. 335–350, 2009.
- [34] Health Level Seven International, “Introduction to HL7 standards,” 2015. [Online]. Available: http://www.hl7.org/implement/standards
- [35] J.-G. Schneider, P. Mandile, and S. Versteeg, “Generalized Suffix Tree based Multiple Sequence Alignment for Service Virtualization,” in 24th Australasian Software Engineering Conference (ASWEC ’15), Adelaide, Australia, Sep. 2015, pp. 48–57.