The Spectral Energy Distribution of the Coldest Known Brown Dwarf11affiliation: Based on observations made with the Spitzer Space Telescope, the NASA/ESA Hubble Space Telescope, Gemini Observatory, and the ESO Telescopes at Paranal Observatory.
Abstract
WISE J085510.83071442.5 (hereafter WISE 08550714) is the coldest known brown dwarf ( K) and the fourth closest known system to the Sun (2.2 pc). It has been previously detected only in the band and two mid-IR bands. To better measure its spectral energy distribution (SED), we have performed deep imaging of WISE 08550714 in six optical and near-IR bands with Gemini Observatory, the Very Large Telescope, and the Hubble Space Telescope. Five of the bands show detections, although one detection is marginal (S/N3). We also have obtained two epochs of images with the Spitzer Space Telescope for use in refining the parallax of the brown dwarf. By combining astrometry from this work and previous studies, we have derived a parallax of (2.230.04 pc). We have compared our photometry for WISE 08550714 to data for known Y dwarfs and to the predictions of three suites of models by Saumon et al. (2012) and Morley et al. (2012, 2014a) that are defined by the presence or absence of clouds and non-equilibrium chemistry. Our estimates of and for WISE 08550714 are redder than colors of other Y dwarfs, confirming a predicted reversal of near-IR colors to redder values at temperatures below 300–400 K. In color-magnitude diagrams, no single suite of models provides a clearly superior match to the sequence formed by WISE 08550714 and other Y dwarfs. Instead, the best fitting model changes from one diagram to the next. Similarly, all of the models have substantial differences from the SED of WISE 08550714. As a result, we are currently unable to constrain the presence of clouds or non-equilibrium chemistry in its atmosphere.
Subject headings:
brown dwarfs — infrared: stars — solar neighborhood — stars: low-mass — planets and satellites: atmospheres1. Introduction
With the discovery of the brown dwarf Gl 229 B (Nakajima et al., 1995; Oppenheimer et al., 1995), it became possible to begin testing atmospheric models within the temperature gap of 100–2000 K between the Jovian planets and low-mass stars (Allard et al., 1996; Marley et al., 1996). Large variations in atmospheric properties (e.g., gas abundances, opacity sources, presence and composition of clouds) are expected across that temperature range (Burrows et al., 2001; Marley & Robinson, 2015). As a result, brown dwarfs have been sought at progressively lower temperatures to more fully test models of cool atmospheres. Most of the recent progress in surveys for the coldest brown dwarfs has been enabled by the Wide-field Infrared Survey Explorer (WISE, Wright et al., 2010), which obtained mid-infrared (IR) images of the entire sky. Those data have been used to greatly expand samples of late-T dwarfs (500–800 K) and to discover members of a new, cooler spectral class, the Y dwarfs ( K, Cushing et al., 2011, 2014; Kirkpatrick et al., 2012, 2013; Tinney et al., 2012; Pinfield et al., 2014; Schneider et al., 2015). A few additional brown dwarfs that are likely members of the Y class have been found as companions through near-IR adaptive optics imaging (Liu et al., 2011, 2012) and mid-IR imaging (Luhman et al., 2011) with the Spitzer Space Telescope (Werner et al., 2004). Because the optical and near-IR fluxes of brown dwarfs decrease rapidly with lower temperatures at spectral types later than T6 (1000 K, Cushing et al., 2011; Kirkpatrick et al., 2011), it is challenging to measure the spectral energy distributions (SEDs) of Y dwarfs for comparison to the predictions of atmospheric models.
The coldest known brown dwarf is WISE J085510.83071442.5 (hereafter WISE 08550714), which has a temperature of 250 K based on its absolute magnitude at 4.5 µm (Luhman, 2014). It has a distance of slightly more than 2 pc, which makes it the fourth closest known system to the Sun. Because of the combination of its close proximity and low temperature, WISE 08550714 is a uniquely appealing target for studies of cool atmospheres. In Luhman (2014), the detections of WISE 08550714 were limited to broad-band filters at 3–4 and 4–5 µm from WISE and Spitzer. It was not detected in moderately deep near-IR images (). Additional limits were subsequently placed on its flux in the , , and bands (Beamin et al., 2014; Kopytova et al., 2014; Wright et al., 2014). Faherty et al. (2014) reported a 2.6 detection () in a custom filter within the band, and they interpreted the resulting color between and 4.5 µm as evidence of water ice clouds based on a comparison to models of brown dwarfs with and without clouds (Saumon et al., 2012; Morley et al., 2012, 2014a). However, Luhman & Esplin (2014) found that those data were best matched by cloudless models that employed non-equilibrium chemistry.
Deeper images of WISE 08550714 in multiple bands are needed to better constrain its SED. Because of its exceptional sensitivity, the Hubble Space Telescope () has been used for much of the near-IR imaging and spectroscopy of Y dwarfs (Cushing et al., 2011, 2014; Kirkpatrick et al., 2012, 2013; Luhman et al., 2014; Schneider et al., 2015). In this paper, we present observations of WISE 08550714 that we have performed in F850LP (), F105W (wide ), F110W (wide ), and F127M (narrow ). We also have obtained images in the band with Gemini Observatory and in a filter encompassing the -band continuum of brown dwarfs with the Very Large Telescope (VLT). Finally, we have observed WISE 08550714 at additional epochs with Spitzer to refine its parallax.
2. Observations
In Table 1, we have compiled the telescopes, instruments, filters, exposure times, dates, and program identifications for our imaging of WISE 08550714. We have also included all previous Spitzer observations of the object (Luhman, 2014; Luhman & Esplin, 2014; Melso et al., 2015) and two photometric monitoring campaigns with Spitzer that will be presented by T. Esplin (in preparation).
2.1. Selection of Filters
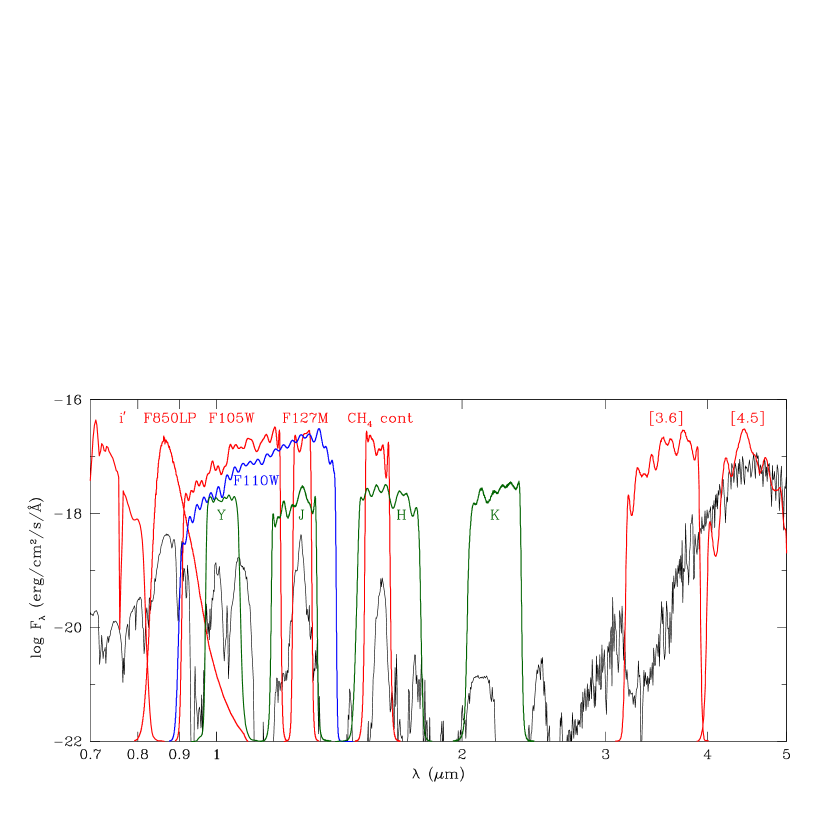
We have observed WISE 08550714 in six optical and near-IR filters to better characterize its SED and in a mid-IR band at 4.5 µm with Spitzer to provide additional astrometry for refining its parallax. We also have measured photometry from previous images in a second Spitzer band at 3.6 µm. To illustrate how the bandpasses of these filters align with the expected spectral features of WISE 08550714, we plot in Figure 1 the filter transmission profiles and an example of a model spectrum for a 250 K brown dwarf at a distance of 2 pc (Morley et al., 2014a). When possible, we selected filters that primarily encompassed continuum emission rather than deep absorption bands, as in the case of F127M on and the CH4 continuum filter on VLT. For reference, we include in Figure 1 the filters from the Mauna Kea Observatories photometric system (Tokunaga et al., 2002).
2.2. Spitzer IRAC Images
WISE 08550714 has been observed on multiple occasions by Spitzer’s Infrared Array Camera (IRAC; Fazio et al., 2004). It contains two arrays that are currently operating, each with a plate scale of pixel-1 and a field of view of . The two arrays cover adjacent areas on the sky in different filters that are centered at 3.6 and 4.5 µm (denoted as [3.6] and [4.5]). Point sources in these bands exhibit FWHM.
All IRAC observations of WISE 08550714 are listed in Table 1. Luhman (2014) obtained the data on the first two dates, which were in 2013 and 2014. On the first date, WISE 08550714 was imaged in both [3.6] and [4.5]. The primary purpose of the second observation was the measurement of astrometry for WISE 08550714, so it was observed only in the band in which it is brightest, namely [4.5]. The next two epochs of data were collected in 2014 by Luhman & Esplin (2014), which were used to measure additional astrometry. The second of those observations consisted of a large map () rather than a single field of view of the camera. Melso et al. (2015) performed a second map of the same size in 2015, corresponding to the fifth epoch overall. They searched for companions to WISE 08550714 in those two maps based on common proper motions. During all of the observations of WISE 08550714 in [4.5], images of a flanking field were taken in [3.6]. As a result, when the two maps were obtained in [4.5], the flanking fields in [3.6] produced maps that encompassed WISE 08550714. To continue the astrometric monitoring, we have obtained images in [4.5] on two additional dates in 2015. T. Esplin et al. (in preparation) also have performed continuous imaging of WISE 08550714 in [3.6] and [4.5] during two 23 hour periods to characterize its variability.
We have measured astrometry for WISE 08550714 from all epochs of [4.5] images except the two photometric monitoring campaigns. During the monitoring for a given filter, WISE 08550714 was placed in one corner of the array and held at a fixed location without dithering, which optimizes photometric precision over the course of an observation but produces larger astrometric errors than the standard observing strategy of dithering the target near the center of the array. To measure astrometry for WISE 08550714 from the other seven epochs, we applied the methods described in Luhman & Esplin (2014) and the distortion corrections from Esplin & Luhman (2016). The resulting astrometric measurements are presented in Table 2.
We also have measured photometry for WISE 08550714 in [3.6] and [4.5] from all of the data except the monitoring campaigns and the second epoch in [3.6]. The latter set of data was excluded because WISE 08550714 was slightly blended with a brighter star. WISE 08550714 is much brighter in [4.5], so its photometry was unaffected by the neighboring star. For the monitoring campaigns, we have adopted the mean photometry measured by T. Esplin et al. (in preparation). We have measured photometry from the other data with the methods from Luhman et al. (2012). The resulting photometric data are listed in Table The Spectral Energy Distribution of the Coldest Known Brown Dwarf11affiliation: Based on observations made with the Spitzer Space Telescope, the NASA/ESA Hubble Space Telescope, Gemini Observatory, and the ESO Telescopes at Paranal Observatory..
2.3. VLT HAWK-I Images
We obtained images of WISE 08550714 with the High Acuity Wide-field K-band Imager (HAWK-I) on the Unit Telescope 4 of the VLT. The camera contains four 20482048 HAWAII-2RG arrays and has a plate scale of pixel-1 (Kissler-Patig et al., 2008). For these observations, we selected a medium-band filter that encompasses the -band continuum that separates two bands of CH4 and H2O absorption (see Fig. 1). Images of WISE 08550714 in that filter were taken during portions of six nights across a period of nearly two months (see Table 1). The total exposure time was 6.4 hours. Based on its proper motion and parallax (Section 3.1), WISE 08550714 moved between the first and last nights. Therefore, when registering and combining the individual frames from the six nights, we applied offsets to sections of the images surrounding the expected positions of WISE 08550714 that compensated for the proper and parallactic motions. Point sources in the final combined image exhibited FWHM. We aligned the world coordinate system (WCS) of the image to that of the IRAC images using offsets in right ascension, declination, and rotation that were derived from sources detected in both sets of data.
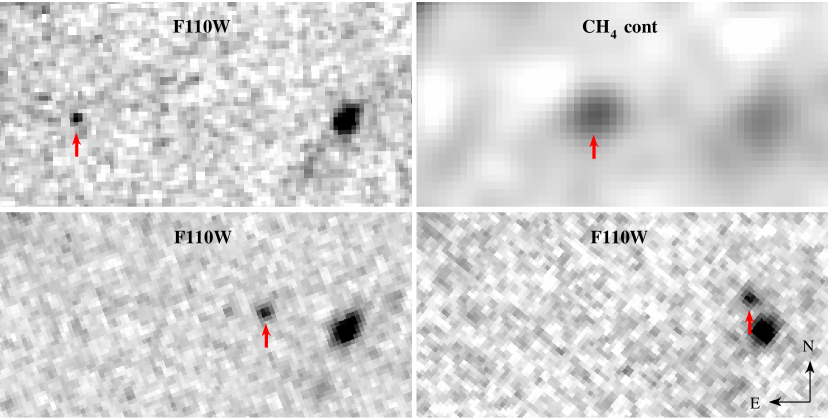
A source appears at the expected position of WISE 08550714 in the reduced image. A section of the HAWK-I image surrounding that position is shown in Figure 2. The image has been smoothed to a lower resolution of to facilitate visual identification of the detection. We conclude that this source is WISE 08550714 since no (stationary) object is detected at that location in the images, which are deeper than the HAWK-I data. We derived the flux calibration with -band photometry from the Point Source Catalog of the Two-Micron All-Sky Survey (2MASS, Skrutskie et al., 2006) for sources in the image under the assumption that they have . Aperture photometry was then measured for WISE 08550714 using an aperture radius of 5 pixels and radii of 7 and 11 pixels for the inner and outer boundaries of the sky annulus, respectively. The photometry for WISE 08550714 is in Table The Spectral Energy Distribution of the Coldest Known Brown Dwarf11affiliation: Based on observations made with the Spitzer Space Telescope, the NASA/ESA Hubble Space Telescope, Gemini Observatory, and the ESO Telescopes at Paranal Observatory.. We have not used the HAWK-I image to measure astrometry for WISE 08550714 because the errors would be larger than those from the IRAC and images, which offer higher a signal-to-noise ratio (S/N) and higher resolution, respectively.
2.4. ACS and WFC3 Images
At the time of the planning of our initial observations with , WISE 08550714 had been detected only at mid-IR wavelengths. Therefore, we began by observing it in the filter on that appeared to offer the greatest sensitivity to cold brown dwarfs, F110W on Wide Field Camera 3 (WFC3, Kimble et al., 2008). The same approach was taken by Luhman et al. (2014) in seeking the first near-IR detection of the brown dwarf WD 0806-661 B. After detecting WISE 08550714 in F110W, we pursued imaging with in three additional bands that are aligned with the wavelengths at which much of the near-IR flux is predicted to emerge, consisting of F850LP on the Advanced Camera for Surveys (ACS) and F105W and F127M on WFC3 (see Fig. 1).
We observed WISE 08550714 with the IR channel of WFC3 and the Wide Field Channel (WFC) of ACS. WFC3/IR contains a HgCdTe array in which the pixels have dimensions of . ACS/WFC contains two SITe CCD arrays with plate scales of pixel-1. For each of the four filters that we selected, WISE 08550714 was observed during six orbits that were divided into three two-orbit visits. In a given orbit, one exposure was taken at each position in a three-point dither pattern. The dither patterns in the two orbits in each visit were offset by 3.5 pixels along the x-axis of the array. The position of WISE 08550714 predicted by its proper motion and parallax was placed at the IR and WFC1-CTE apertures in WFC3 and ACS, respectively. The WFC1-CTE aperture was selected because it is near one of the readout amplifiers, which minimizes photometric losses due to imperfect charge transfer efficiency. The dates and exposure times for the visits are listed in Table 1.
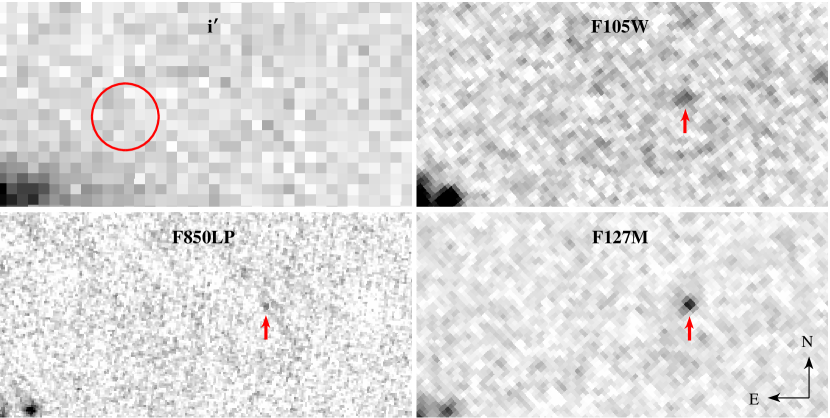
The WFC3 and ACS images were registered and combined using the tasks tweakreg and astrodrizzle within the DrizzlePac software package. We adopted drop sizes of 0.85 native pixels and resampled plate scales of pixel-1 and pixel-1 for WFC3 and ACS, respectively. For F110W and F127M, we combined the six exposures within each two-orbit visit, resulting in one reduced images for each of the three visits. WISE 08550714 is well-detected in each of those images, as shown in Figures 2 and 3. Because the F127M visits spanned only one week, the movement of WISE 08550714 among those visits was very small. As a result, we have included an image from only one of the three F127M visits in Figure 3. Because the S/N of WISE 08550714 is low in F850LP and F105W, we combined all exposures from the three visits for each of those filters. As done with the HAWK-I data, we corrected for the expected motion of WISE 08550714 among the visits within a small area () surrounding its expected location when registering and combining the images in F850LP and F105W. The reduced images for those filters are shown in Figure 3. WISE 08550714 is clearly detected in F105W, but only a marginal detection (S/N3) is present in F850LP. Because the F850LP data were taken within a few days of two of the F127M visits, the expected position of the brown dwarf in F850LP is known precisely, and that position does coincide with the weak source indicated in Figure 3.
To measure astrometry for WISE 08550714, we began by aligning the WCS of the image from the first F110W visit to that of the HAWK-I image, which was aligned to IRAC (Section 2.3). We then aligned the WCS’s of the other WFC3 and ACS images to the new WCS for the first F110W visit. The astrometry for WISE 08550714 from each of the visits in F110W and F127M is provided in Table 2. We do not report astrometry from the F850LP and F105W images because of the large errors that result from the low S/N. As with the IRAC astrometry (see Luhman & Esplin, 2014), we have estimated the astrometric errors based on the differences in right ascension and declination between different visits for stars with similar magnitudes as WISE 08550714.
Aperture photometry was measured for WISE 08550714 from each of the reduced images using an aperture radius of four pixels and radii of four and 10 pixels for the inner and outer boundaries of the sky annulus, respectively. For the WFC3 images, we measured aperture corrections of 0.097 (F105W), 0.097 (F110W), and 0.125 mag (F127M) between those apertures and radii of using bright stars in the images. We then applied those corrections and the zero-point Vega magnitudes of 25.4523 (F105W), 25.8829 (F110W), and 23.4932 (F127M) for apertures111http://www.stsci.edu/hst/wfc3/phot_zp_lbn to the photometry of WISE 08550714. To calibrate the F850LP photometry, we computed the zero-point STMAG magnitude for a aperture from the image header keyword photflam and converted it the Vega system with the transformation from Sirianni et al. (2005), arriving at a value of 24.316. Because the aperture correction in F850LP is significantly larger for redder objects, we used the software package synphot to estimate a correction of 0.68 mag between the aperture applied to WISE 08550714 and a aperture. Drizzled images can contain correlated noise, which would lead to an underestimate of the photometric errors. Therefore, to estimate reliable values for the errors, we created separate versions of the reduced images that used drop sizes of 0.1 native pixels, which should minimize the correlated noise. We then adopted the errors produced by aperture photometry on those images. The photometry in F850LP, F105W, F110W, and F127M is presented in Table The Spectral Energy Distribution of the Coldest Known Brown Dwarf11affiliation: Based on observations made with the Spitzer Space Telescope, the NASA/ESA Hubble Space Telescope, Gemini Observatory, and the ESO Telescopes at Paranal Observatory., where separate measurements are reported for each of the three visits in F110W and F127M.
2.5. Gemini GMOS Images
We obtained images of WISE 08550714 in the filter with Gemini Multi-Object Spectrograph (GMOS) at the Gemini South telescope. We originally proposed to conduct these observations in the filter, but we selected after deeper imaging in F850LP () with was approved. GMOS contains three 20484096 Hamamatsu CCD arrays that have plate scales of pixel-1. WISE 08550714 was observed during portions of four nights that spanned nearly two months with a total exposure time of 6.8 hours (see Table 1). The FWHM of point sources in the images ranged from 0.4–. As done with other data, when registering and combining the individual frames, we compensated for the parallactic and proper motions of WISE 08550714 within a section surrounding its expected location. It was not detected in the final combined image (see Figure 3). In Table The Spectral Energy Distribution of the Coldest Known Brown Dwarf11affiliation: Based on observations made with the Spitzer Space Telescope, the NASA/ESA Hubble Space Telescope, Gemini Observatory, and the ESO Telescopes at Paranal Observatory., we provide the magnitude limit in that corresponds to S/N=3.
3. Analysis
3.1. Proper Motion and Parallax
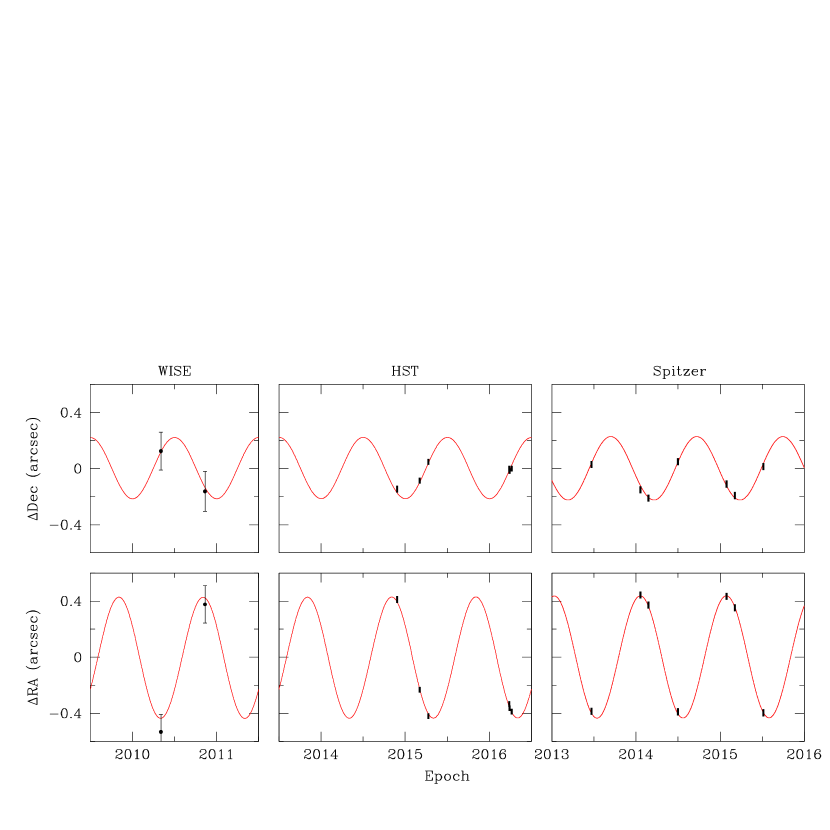
The proper motion and parallax of WISE 08550714 have been previously measured by Luhman (2014), Wright et al. (2014), and Luhman & Esplin (2014). For the most recent measurements, Luhman & Esplin (2014) combined four epochs of astrometry from Spitzer with three epochs from WISE during its initial survey and after reactivation (NEOWISE, Mainzer et al., 2014) that were derived by Wright et al. (2014). Luhman & Esplin (2014) arrived at a proper motion of ( cos , ) =(, yr-1) and a parallax of 0.015. We can further refine those parameters with the new astrometry from our IRAC and images. To do that, we employ the two epochs of astrometry from WISE (Wright et al., 2014) after the adjustments by Luhman & Esplin (2014), the astrometry that we have measured from all seven epochs of Spitzer [4.5] images in which WISE 08550714 was near the center of the array (i.e., excluding the photometric monitoring campaigns), and our astrometry from the six visits in F127M and F110W. Those data are compiled in Table 2. As mentioned in Sections 2.2 and 2.3, we have not measured astrometry from the F850LP, F105W, and HAWK-I images because the errors would be much larger than those for the other data that we are utilizing. We also exclude the NEOWISE astrometry for the same reason. Although the WISE data have fairly large errors, we retain them because they significantly extend the baseline of the astrometry.
We performed least-squares fitting of proper and parallactic motion to the 15 epochs of astrometry for WISE 08550714 in Table 2 with the IDL program MPFIT. The reduced for the resulting fit was 0.4. To verify the errors produced by the fitting, we created 10,000 sets of astrometry that consisted of the sum of the measured astrometry and Gaussian noise. We then fitted parallactic and proper motion to each set. The resulting standard deviations of , , and parallax were similar to the errors from MPFIT. The proper motion and parallax are presented in Table 4. They are consistent with all of the previous estimates. In Figure 4, we plot the relative coordinates among the 15 epochs after subtraction of the best-fit proper motion.
3.2. Comparison of Observed and Model Photometry
We wish to compare the available photometry for WISE 08550714 to the predictions from models of the atmospheres and interiors of brown dwarfs. A comparison of a given magnitude or color for a brown dwarf to the model predictions can serve as a test of the validity of the model if the defining properties of the brown dwarf are assumed, or it can constrain the properties of the brown dwarf if the model photometry is assumed to be accurate. If several photometric measurements (or a spectrum) are available, then one can pursue both a test of the models and a constraint on the brown dwarf’s properties by checking whether one suite of models (e.g., cloudless with equilibrium chemistry) produces a clearly superior fit, and then adopting the properties of the best-fit model from that suite. Such comparisons of data and models can be performed for a single object or for a population. In this section, we summarize previous comparisons of photometry for WISE 08550714 to model predictions, compare it and other known Y dwarfs to the models on color-magnitude diagrams (CMDs), and perform a comparison to the full SED that we have measured for WISE 08550714.
3.2.1 Previous Studies of WISE 08550714
Luhman (2014) compared and a limit on for WISE 08550714 to the predictions of multiple suites of models and identified the temperature constraint implied by each suite for each of those measurements. A comparison was not performed with because theoretical values differ greatly from the observed colors of T and Y dwarfs (Leggett et al., 2010; Beichman et al., 2014). The models considered by Luhman (2014) were defined primarily by the following features: water clouds and chemical equilibrium (Burrows et al., 2003), cloudless and chemical equilibrium (Saumon & Marley, 2008; Saumon et al., 2012), cloudless and non-equilibrium chemistry (Saumon & Marley, 2008; Saumon et al., 2012), and 50% coverage of water, chloride, and sulfide clouds and chemical equilibrium (Morley et al., 2012, 2014a). In our study, we employ the same models except for those from Burrows et al. (2003), which are omitted because of their poorer agreement with the data for WISE 08550714 and other Y dwarfs (Liu et al., 2012; Luhman et al., 2014).
Faherty et al. (2014) obtained images of WISE 08550714 in a medium-band filter within the band, achieving a possible 2.6 detection. They used their photometry to estimate the magnitude of WISE 08550714 and place it on a diagram of versus , where is a WISE band that is similar to [4.5] from Spitzer. In that diagram, the brown dwarf appeared closer to the cloudy models from Morley et al. (2012, 2014a) than the cloudless/chemical equilibrium models from Saumon et al. (2012), which they cited as evidence of water ice clouds. However, using the estimate from that study, Luhman & Esplin (2014) found that WISE 08550714 was roughly midway between the cloudless and cloudy models that assume chemical equilibrium in a diagram of versus , and that it agreed with cloudless models that invoke non-equilibrium chemistry (Saumon & Marley, 2008; Saumon et al., 2012). In general, to draw a definitive conclusion regarding the physical properties of a brown dwarf (e.g., presence of clouds) from a single CMD, one must assume that each suite of models produces colors that are accurate for the physical conditions in question. Such an assumption is not warranted given the untested nature of those colors near the temperature of WISE 08550714. Indeed, the suite of models that best matches the data for WISE 08550714 and other Y dwarfs varies among different CMDs, as shown in the next section.
Beamin et al. (2014) measured a limit on the -band magnitude of WISE 08550714. They compared the updated SED to their new version of the BT-Settl models and the cloudy models from Morley et al. (2014a). The best fit models had temperatures of 240 and 250 K, respectively, both with log . The -band limit from Beamin et al. (2014) is similar to the brightest fluxes predicted at the observed value of for WISE 08550714 from among the suites of models that we consider.
Kopytova et al. (2014) obtained -band images of WISE 08550714 that did not show a detection. They compared the SED that included their limit to models of cloudy brown dwarfs from Burrows et al. (2003) and Morley et al. (2014a) for a range of temperatures and surface gravities. During the comparison, each model SED was scaled to match the observed fluxes in [3.6] and [4.5], which was equivalent to scaling the radius. However, that approach can lead to radii that differ significantly from those predicted by evolutionary models for a given temperature and surface gravity (Burrows et al., 2003; Saumon & Marley, 2008), and thus are unphysical. Indeed, among the eight best-fit models that they presented, Kopytova et al. (2014) noted that five models exhibited unphysical values of radius (0.4–0.5 ) or surface gravity (log ). In fact, the gravity and radius of one of their models (log , 1.4 ) corresponded to a stellar mass (0.23 ). We find that the best-fit radii of two of their three remaining models also differ from those predicted by evolutionary models by 30–50%. Based on their comparison to the theoretical SEDs, Kopytova et al. (2014) concluded that no models reproduced the color of WISE 08550714, which was previously known to apply to T and Y dwarfs in general (Leggett et al., 2010; Beichman et al., 2014).
3.2.2 Color-Magnitude Diagrams
We can use CMDs to place the photometry of WISE 08550714 in the context of data for other brown dwarfs and to compare trends within this population to model predictions. Because few data are available for Y dwarfs in optical bands (Lodieu et al., 2013; Kopytova et al., 2014; Leggett et al., 2015), we have not constructed CMDs with and F850LP (). Previous data for F105W, F110W, F127M, and the CH4 continuum filter are also limited, but most known Y dwarfs have been observed in the overlapping bands of , , and (see Fig. 1). Therefore, we select the latter three bands and the two Spitzer filters for our CMDs. We plot on the vertical axis of each diagram because it encompasses less absorption and exhibits higher S/N for Y dwarfs than the other filters, and because it captures most of the flux of Y dwarfs at µm.
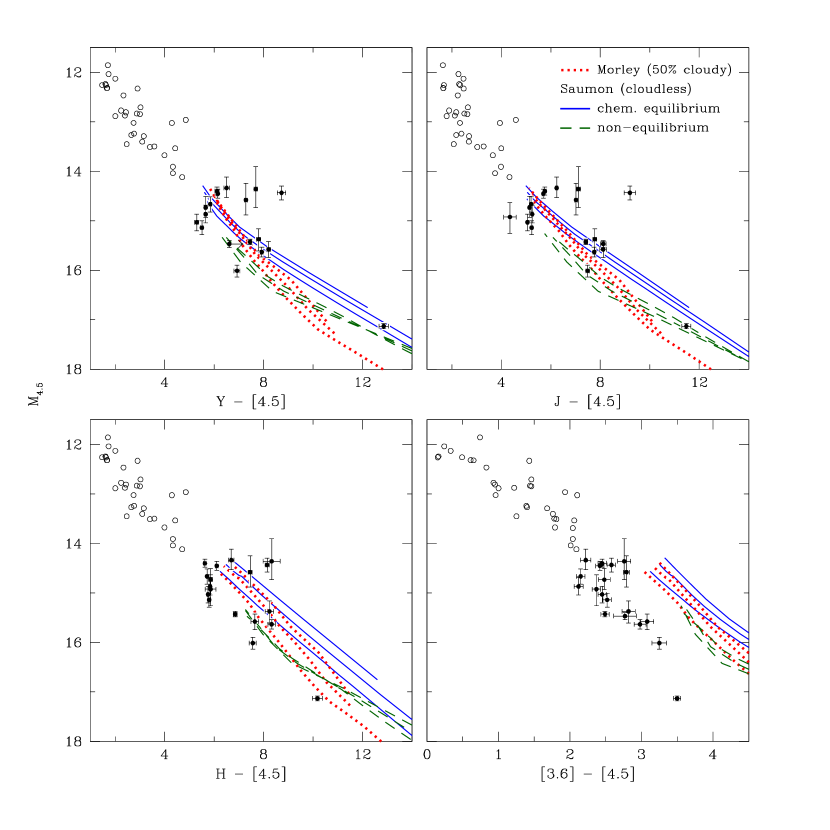
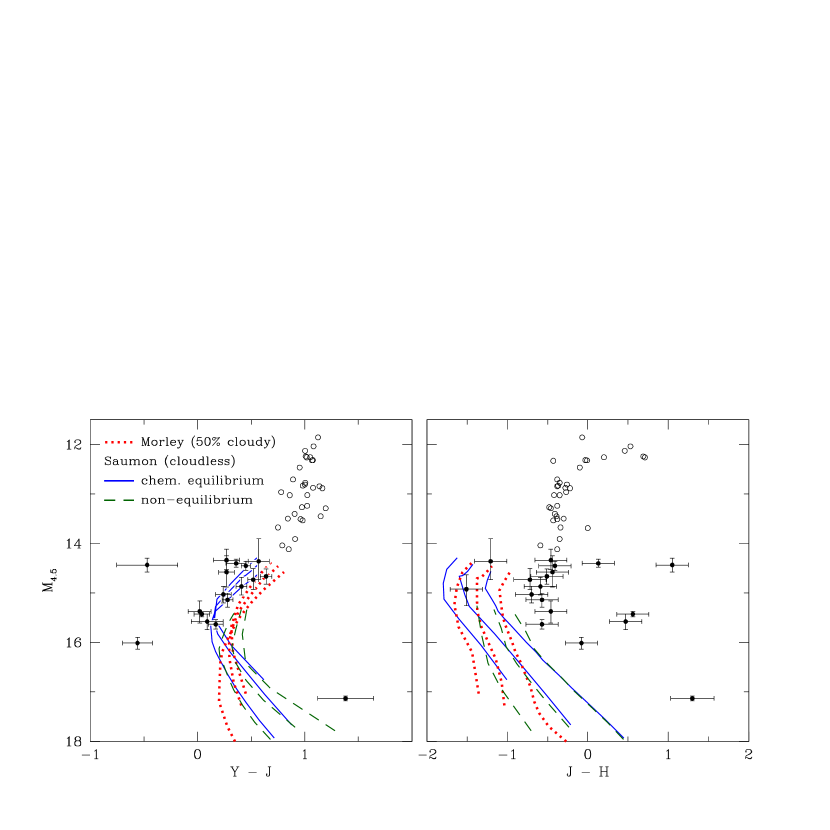
In Figure 5, we show CMDs with colors that extend from to [4.5]. We also plot CMDs with and in Figure 6. To place WISE 08550714 in these CMDs, we have combined our measurements of , , and with , , and as predicted by the models at the value of for WISE 08550714. The three suites of models that we consider (Section 3.2.1) produce similar values of (0.89) and (0.85), but the predicted ranges from 0.25 to 0.9. We adopted for plotting WISE 08550714 in Figure 5. Its position relative to the models in the CMD does not change significantly if a different value is adopted given that the model suites span more than 3 mag in at the magnitude of WISE 08550714. For and [4.5], we have adopted the means of the multiple measurements that are available. WISE 08550714 is plotted with an error bar in that corresponds to the range of the three measurements. For , we have adopted the mean color that was measured in the four epochs with [3.6] data. Because model colors have been used to convert from to for WISE 08550714, the CMDs are technically showing the positions of WISE 08550714 relative to the models in and the positions of other Y dwarfs relative to the models in .
In the CMDs, we have plotted a sample of T dwarfs (Dupuy & Liu, 2012, references therein) and all known Y dwarfs that have measurements of parallaxes and photometry in relevant bands (Cushing et al., 2011, 2014; Tinney et al., 2012, 2014; Luhman et al., 2012, 2014; Beichman et al., 2013, 2014; Kirkpatrick et al., 2012, 2013; Dupuy & Kraus, 2013; Leggett et al., 2013, 2015, 2016; Schneider et al., 2015). For the Y dwarf WISE J035000.32565830.2 (hereafter WISE 03505658), the parallax of from Marsh et al. (2013) places it at a discrepant location in CMDs relative to other Y dwarfs (Leggett et al., 2015, 2016). Meanwhile, four known Y dwarfs lack previous parallax measurements, consisting of WISE J030449.03-270508.3 (Pinfield et al., 2014), WISE J082507.35+280548.5 (hereafter WISE 0825+2805), WISE J120604.38+840110.6 (hereafter WISE 1206+8401), and WISE J235402.77+024015.0 (Schneider et al., 2015). A significant amount of multi-epoch Spitzer data is now publicly available for WISE 03505658, WISE 0825+2805, and WISE 1206+8401. To resolve the discrepancy in the CMD locations of WISE 03505658 and to allow the addition of WISE 0825+2805 and WISE 1206+8401 to the CMDs, we have measured their parallaxes from the Spitzer data with the same methods that were applied to WISE 08550714, arriving at , , and , respectively. It is likely that these values will be soon superseded by measurements that include the Spitzer images that are not yet publicly available as well as astrometry from other telescopes. Using our new parallaxes, all three of these objects exhibit locations in the CMDs that are consistent with the sequences formed by other Y dwarfs.
For comparison to the data in the CMDs, we have included magnitudes and colors predicted by three suites of models that were mentioned in Section 3.2.1: cloudless with chemical equilibrium, cloudless with non-equilibrium chemistry, and 50% cloud coverage with chemical equilibrium (Saumon & Marley, 2008; Saumon et al., 2012; Morley et al., 2012, 2014a). The ages of the Y dwarfs in the CMDs are unknown with the exception of WD 0806-661 B (20.5 Gyr, Luhman et al., 2012), so we show model isochrones for ages of 1, 3, and 10 Gyr, which span the ages of most stars in the solar neighborhood. The models with equilibrium and non-equilibrium chemistry are plotted for temperatures of K and K, respectively.
In Figure 5, the sequences formed by known Y dwarfs are qualitatively similar among the CMDs with , , and . The CMD with contains the most well-defined sequence because [3.6] and [4.5] usually offer the most accurate photometry for Y dwarfs from available bands. Because of their large scatter, the sequences of Y dwarfs brighter than WISE 08550714 in do not tightly constrain the models, but those sequences are in rough agreement with all three model suites, agreeing somewhat better with the cloudless/chemical equilibrium models in and . All of the models are much redder than the data in , as found in a number of previous studies (Leggett et al., 2010; Beichman et al., 2014; Luhman et al., 2014). It is unfortunate that the CMD with the best-defined Y dwarf sequence contains a color that is especially difficult for the models to reproduce. The differences between the three suites of models in the CMDs of increase at fainter magnitudes, so WISE 08550714 offers the greatest potential for discriminating among those models. However, the suite of models that best matches the position of WISE 08550714 changes from one CMD to the next: cloudless/chemical equilibrium in , cloudless/non-equilibrium chemistry in , and cloudy in . For the CMD, Luhman & Esplin (2014) arrived at a similar result using the -band measurement from Faherty et al. (2014). We note that the overall agreement between the Y dwarf sequences and the model isochrones is not improved by replacing [4.5] with a different band on the vertical axes in the CMDs.
The CMD in Figure 6 exhibits a well-defined sequence of Y dwarfs plus two blue outliers, WISE 03505658 and WISE 182831.08+265037.8. The sequence of late-T and Y dwarfs becomes bluer at fainter magnitudes, as found in many previous studies (Liu et al., 2012; Dupuy & Kraus, 2013; Morley et al., 2014a; Schneider et al., 2015; Leggett et al., 2013, 2015, 2016). That trend has been attributed to the depletion of neutral alkalis into gases and solids (Liu et al., 2012), which would reduce the absorption from pressure-broadened alkali lines at red optical wavelengths (Marley et al., 2002; Burrows et al., 2003). The cloudless models with chemical equilibrium reproduce the Y dwarf sequence in while the isochrones from the other two suites of models are too red (Liu et al., 2012; Leggett et al., 2013, 2015; Morley et al., 2014a). Tremblin et al. (2015) found that their cloudless models produced similar colors for equilibrium and non-equilibrium chemistry, both of which matched the data for Y dwarfs. Whereas Y dwarfs have previously exhibited bluer at fainter magnitudes, our data imply a redder color for WISE 08550714. A similar result is found when WISE 08550714 is compared to other Y dwarfs in terms of using F105W photometry from Schneider et al. (2015). As shown in Figure 6, all three sets of models do predict a shift of the Y dwarf sequence back to redder values of for objects as faint as WISE 08550714.
As in the CMD, a clear extension of the T dwarf sequence is evident among the Y dwarfs in the CMD, except with more discrepant objects in the latter. The blue outliers are WISE J053516.80750024 and WISE J014656.66+423410.0 and the reddest outlier is WISE 182831.08+265037.8. Previous studies have compared similar CMDs (often with ) to model predictions (Morley et al., 2012, 2014a; Leggett et al., 2013, 2015, 2016; Marsh et al., 2013; Beichman et al., 2014), finding that the cloudless and partly cloudy models of Saumon et al. (2012) and Morley et al. (2012, 2014a) tend to produce colors that are too blue (see also Figure 6). Those models agree with the observed colors only if the surface gravity is increased to a value that becomes unphysical for cooler Y dwarfs (log ) and the cloud coverage is very large (Morley et al., 2014a). The cloudless non-equilibrium models in Figure 6 are also too blue, although those from Tremblin et al. (2015) are red enough to match the data (Leggett et al., 2016). Previous studies have shown that Y dwarfs start to become redder in at fainter magnitudes (Schneider et al., 2015; Leggett et al., 2015, 2016), and we find that WISE 08550714 continues that trend, which agrees with the model predictions (see Figure 6).
3.2.3 Spectral Energy Distribution
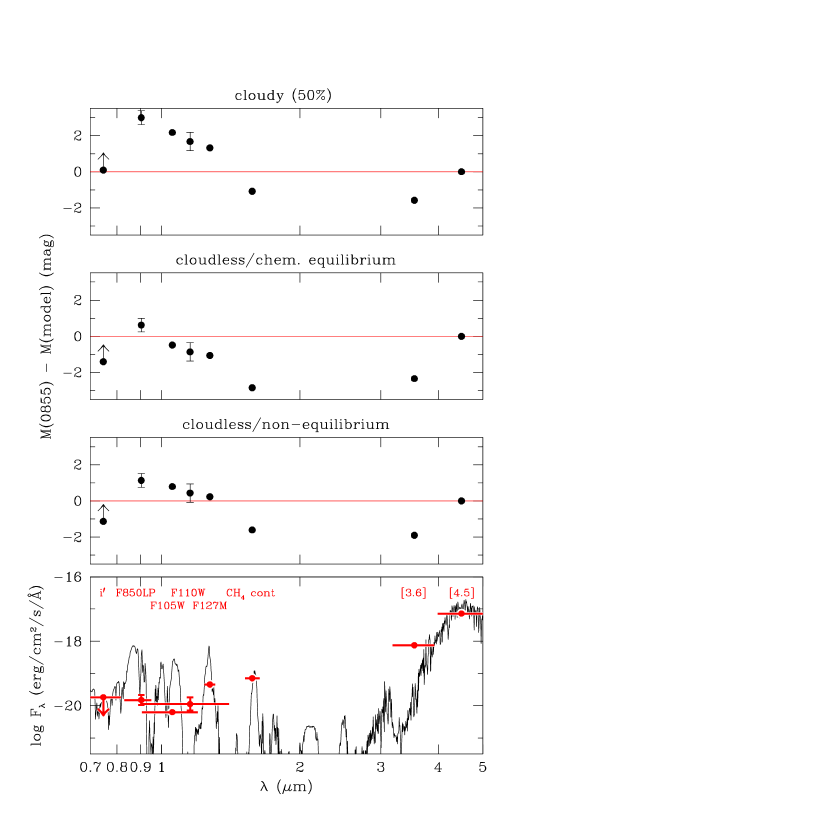
In Figure 7, we have constructed an SED for WISE 08550714 from our photometric measurements in , F850LP, F105W, F110W, F127M, the CH4 continuum filter, [3.6], and [4.5]. The other available data in Table The Spectral Energy Distribution of the Coldest Known Brown Dwarf11affiliation: Based on observations made with the Spitzer Space Telescope, the NASA/ESA Hubble Space Telescope, Gemini Observatory, and the ESO Telescopes at Paranal Observatory. are omitted from the SED because they are superseded by our more sensitive photometry in similar bands or they are not deep enough to provide a useful constraint on the models (). As in Figure 1, we include in Figure 7 an example of a model spectrum of a cold brown dwarf (Morley et al., 2014a) to indicate the wavelengths of major spectral features relative to the bands of our photometry.
For each of the three model suites considered in this work and for each of the ages of 1, 3, and 10 Gyr, we have identified the model that has the same value of as WISE 08550714 because this band encompasses most of the flux at 5 µm. For each of those nine models, we then computed the difference between the observed and predicted absolute magnitudes for each of the bands in the SED for WISE 08550714. In Figure 7, we plot the resulting differences for the three model suites at 3 Gyr. The temperatures for those best-fit models are 237, 244, an 249 K for cloudless/chemical equilibrium, cloudless/non-equilibrium chemistry, and 50% cloudy, respectively. The other two ages have been omitted because, for a given model suite, most of the magnitude differences for 1, 3, and 10 Gyr span a modest range on the scale of Figure 7 ( mag). Positive and negative deviations correspond to predicted fluxes that are brighter and fainter than the data, respectively.
For all of the model suites considered, the predicted SEDs exhibit large deviations from the observed SED of WISE 08550714. No single model provides a clearly superior match to the data. When the models are selected to match the object at [4.5] as we have done, they are too faint in and [3.6]. That is a reflection of the fact that the models are too red in and , as found in the CMDs. The deviation in is smallest for the cloudy models, which is also evident from the CMD in Figure 5. However, the two suites of cloudless models agree better with the SED of WISE 08550714 in F850LP through F127M. The cloudy models are too bright by 1.5–2.5 mag in those bands, where the deviation becomes progressively larger at shorter wavelengths.
If one selected a model that matched WISE 08550714 in a different band than [4.5], all of the deviations in Figure 7 would shift vertically in the same direction so that the new normalization band exhibited zero deviation. In addition, because the temperature of that model would differ from that derived by fitting to [4.5] and because the near-IR fluxes are more sensitive to temperature than the flux in [4.5], the shifts of the deviations would be larger in the near-IR bands. As with the CMDs, adopting a different band than [4.5] in this analysis does not improve the agreement between the observed SED and the model predictions.
3.3. Multiplicity Constraints
Among the images in which WISE 08550714 has been detected, those from offer the highest resolution, and therefore can detect a companion at the smallest separations. The F110W and F127M images have provided the highest S/N for WISE 08550714 from among the four filters with which it was observed by . The S/N in each of those filters is similar to that of the brown dwarf WD 0806-661 B in F110W images from Luhman et al. (2014). Thus, the constraints on the presence of a companion to WISE 08550714 are similar to those derived from the images of WD 0806-661 B, which were capable of detecting 80% of companions with mag at separations beyond ( AU for WISE 08550714).
Because of improvements in the accuracies of parallaxes for Y dwarfs (Dupuy & Kraus, 2013; Beichman et al., 2014; Tinney et al., 2014, Section 3.1), the Y dwarf sequence in the CMD (Figure 5) is now sufficiently narrow and well-defined that one could attempt to identify unresolved binaries via their elevated positions relative to the sequence. That method is not yet applicable to WISE 08550714 since no other Y dwarfs have been found near its absolute magnitude.
4. Discussion
Because of its low temperature, WISE 08550714 is very red from near- to mid-IR wavelengths. Its previous detections were limited to one near-IR band (S/N=2.6) and two mid-IR bands. We have presented deep images of WISE 08550714 in six optical and near-IR filters, five of which show detections (one is marginal at S/N). We also have continued our previous mid-IR imaging of WISE 08550714 to refine its parallax.
Using our new photometry and parallax measurement, we have placed WISE 08550714 in several CMDs and constructed its SED. For comparison, we have included in the CMDs other known Y dwarfs and the isochrones predicted by three suites of models for the coldest brown dwarfs (Saumon et al., 2012; Morley et al., 2012, 2014a). Previous studies have found that Y dwarfs at fainter magnitudes become bluer in and begin to become redder in (e.g., Liu et al., 2012; Schneider et al., 2015; Leggett et al., 2016). WISE 08550714 is redder than other Y dwarfs in both colors, which confirms the prediction that the near-IR colors of brown dwarfs turn to redder values at temperatures below 300–400 K as the Wien tail increasingly affects the colors (Burrows et al., 2003; Saumon et al., 2012; Morley et al., 2014a). No single model is able to reproduce the sequences formed by WISE 08550714 and other Y dwarfs in all CMDs. Similarly, the SEDs predicted by all three model suites differ significantly from the SED of WISE 08550714. When normalized to the latter in the [4.5] band, the model SEDs are too faint in and [3.6], which has been found previously for other brown dwarfs (Leggett et al., 2010; Morley et al., 2014a). The deviations at shorter wavelengths exhibit a trend with wavelength, and are particularly large for the cloudy models, which are 1.5–2.5 mag too bright. Because none of the models provide a good match to the SED of WISE 08550714, we are unable to determine whether clouds or non-equilibrium chemistry are likely to be present in WISE 08550714.
It is not surprising that the predicted and observed SEDs of WISE 08550714 differ significantly. The models have not been previously tested at such low temperatures, and several aspects of the models are uncertain, which include the methane opacities, the molecules that are affected by non-equilibrium chemistry, and various aspects regarding the treatment of water clouds (Burrows et al., 2003; Saumon et al., 2012; Morley et al., 2014a). The opacities from the pressure-broadened alkali lines are also uncertain, although those lines should be weak at the temperature of WISE 08550714 because of depletion of the alkalis into condensates (Burrows et al., 2003; Morley et al., 2014a). The wavelength dependence of the deviations of the models from the data at µm may provide a clue to their origin (see Figure 7). The current measurement of the SED for WISE 08550714 should serve as a valuable test of newer generations of models.
We conclude by discussing the prospects for future observations of WISE 08550714. We have presented photometry that covers most of the wavelength range from 0.7–5 µm, so imaging in additional near-IR bands is not essential. Our multiple epochs of photometry in F110W and F127M may show evidence of variability, which could be used to detect clouds and hot spots if measured in greater detail (Morley et al., 2014b). However, it may not be feasible to measure time-series photometry with sufficient accuracy and cadence given that a single detection with S/N10 requires a few hours of observing time. Near-IR spectroscopy of WISE 08550714 may be possible with . Based on our photometry and previous spectroscopy of Y dwarfs (e.g., Cushing et al., 2011; Schneider et al., 2015), a minimum of 20–30 orbits would be needed to reach S/N in a low-resolution near-IR spectrum of WISE 08550714. The James Webb Space Telescope will be capable of obtaining near- and mid-IR spectra of it with significantly higher S/N and resolution (Morley et al., 2014a).
References
- Allard et al. (1996) Allard, F., Hauschildt, P. H., Baraffe, I., & Chabrier, G. 1996, ApJ, 465, L123
- Beamin et al. (2014) Beamin, J. C., Ivanov, V. D., Bayo, A., et al. 2014, A&A, 570, L8
- Beichman et al. (2013) Beichman, C., Gelino, C. R., Kirkpatrick, J. D., et al. 2013, ApJ, 764, 101
- Beichman et al. (2014) Beichman, C., Gelino, C. R., Kirkpatrick, J. D., et al. 2014, ApJ, 783, 68
- Burrows et al. (2001) Burrows, A., Hubbard, W. B., Lunine, J. I., & Liebert, J. 2001, Reviews of Modern Physics, 719, 765
- Burrows et al. (2003) Burrows, A., Sudarsky, D., & Lunine, J. I. 2003, ApJ, 596, 587
- Cushing et al. (2011) Cushing, M. C., Kirkpatrick, J. D., Gelino, C. R., et al. 2011, ApJ, 743, 50
- Cushing et al. (2014) Cushing, M. C., Kirkpatrick, J. D., Gelino, C. R., et al. 2014, AJ, 147, 113
- Dupuy & Kraus (2013) Dupuy, T. J., & Kraus, A. L. 2013, Science, 341, 1492
- Dupuy & Liu (2012) Dupuy, T. J., & Liu, M. C. 2012, ApJS, 201, 19
- Esplin & Luhman (2016) Esplin, T. L., & Luhman, K. L. 2016, AJ, 151, 9
- Faherty et al. (2014) Faherty, J. K., Tinney, C. G., Skemer, A., & Monson, A. J. 2014, ApJ, 793, L16
- Fazio et al. (2004) Fazio, G. G., Hora, J. L., Allen, L. E., et al. 2004, ApJS, 154, 10
- Kimble et al. (2008) Kimble, R. A., MacKenty, J. W., O’Connell, R. W., & Townsend, J. A. 2008, Proc. SPIE, 7010, 43
- Kirkpatrick et al. (2011) Kirkpatrick, J. D., Cushing, M. C., Gelino, C. R., et al. 2011, ApJS, 197, 19
- Kirkpatrick et al. (2013) Kirkpatrick, J. D., Cushing, M. C., Gelino, C. R., et al. 2013, ApJ, 776, 128
- Kirkpatrick et al. (2012) Kirkpatrick, J. D., Gelino, C. R., Cushing, M. C., et al. 2012, ApJ, 753, 156
- Kissler-Patig et al. (2008) Kissler-Patig, M., Pirard, J.-F., Casali, M., et al. 2008, A&A, 491, 941
- Kopytova et al. (2014) Kopytova, T. G., Crossfield, I. J. M., Deacon, N. R., et al. 2014, ApJ, 797, 3
- Leggett et al. (2010) Leggett, S. K., Burningham, B., Saumon, D., et al. 2010, ApJ, 710, 1627
- Leggett et al. (2013) Leggett, S. K., Morley, C. V., Marley, M. S., et al. 2013, ApJ, 763, 130
- Leggett et al. (2015) Leggett, S. K., Morley, C. V., Marley, M. S., & Saumon, D. 2015, ApJ, 799, 37
- Leggett et al. (2016) Leggett, S. K., Tremblin, P., Saumon, D., et al. 2016, ApJ, in press
- Liu et al. (2011) Liu, M. C., Deacon, N. R., Magnier, E. A., et al. 2011, ApJ, 740, L32
- Liu et al. (2012) Liu, M. C., Dupuy, T. J., Bowler, B. P., Leggett, S. K., & Best, W. M. J. 2012, ApJ, 758, 57
- Lodieu et al. (2013) Lodieu, N., Béjar, V. J. S., & Rebolo, R. 2013, A&A, 550, L2
- Luhman (2014) Luhman, K. L. 2014, ApJ, 786, L18
- Luhman et al. (2011) Luhman, K. L., Burgasser, A. J., & Bochanski, J. J. 2011, ApJ, 730, L9
- Luhman et al. (2012) Luhman, K. L., Burgasser, A. J., Labbé, I., et al. 2012, ApJ, 744, 135
- Luhman & Esplin (2014) Luhman, K. L., & Esplin, T. L. 2014, ApJ, 796, 6
- Luhman et al. (2014) Luhman, K. L., Morley, C. V., Burgasser, A. J., Esplin, T. L., & Bochanski, J. J. 2014, ApJ, 794, 16
- Mainzer et al. (2014) Mainzer, A., Bauer, J., Cutri, R. M., et al. 2014, ApJ, 792, 30
- Marley & Robinson (2015) Marley, M. S., & Robinson, T. D. 2015, ARA&A, 53, 279
- Marley et al. (1996) Marley, M. S., Saumon, D., Guillot, T., et al. 1996, Science, 272, 1919
- Marley et al. (2002) Marley, M. S., Seager, S., Saumon, D., et al. 2002, ApJ, 568, 335
- Marsh et al. (2013) Marsh, K. A., Wright, E. L., Kirkpatrick, J. D. et al. 2013, ApJ, 762, 119
- Melso et al. (2015) Melso, N. D., Kaldon, K. M., & Luhman, K. L. 2015, AJ, 150, 62
- Morley et al. (2012) Morley, C. V., Fortney, J. J., Marley, M. S., et al. 2012, ApJ, 756, 172
- Morley et al. (2014b) Morley, C. V., Marley, M. S., Fortney, J. J., & Lupu, R. 2014b, ApJ, 789, L14
- Morley et al. (2014a) Morley, C. V., Marley, M. S., Fortney, J. J., et al. 2014a, ApJ, 787, 78
- Nakajima et al. (1995) Nakajima, T., Oppenheimer, B. R., Kulkarni, S. R., et al. 1995, Nature, 378, 463
- Oppenheimer et al. (1995) Oppenheimer, B. R., Kulkarni, S. R., Nakajima, T., & Matthews, K. 1995, Science, 270, 1478
- Pinfield et al. (2014) Pinfield, D. J., Gromadzki, M., Leggett, S. K., et al. 2014, MNRAS, 444, 1931
- Saumon & Marley (2008) Saumon, D., & Marley, M. S. 2008, ApJ, 689, 1327
- Saumon et al. (2012) Saumon, D., Marley, M. S., Abel, M., Frommhold, L., & Freedman, R. S. 2012, ApJ, 750, 74
- Schneider et al. (2015) Schneider, A. C., Cushing, M. C., & Kirkpatrick, J. D., et al. 2015, ApJ, 804, 92
- Sirianni et al. (2005) Sirianni, M., Jee, M. J., Benítez, M., et al. 2005, PASP, 117, 836
- Skrutskie et al. (2006) Skrutskie, M., Cutri, R. M., Stiening, R., et al. 2006, AJ, 131, 1163
- Tinney et al. (2012) Tinney, C. G., Faherty, J. K., Kirkpatrick, J. D., et al. 2012, ApJ, 759, 60
- Tinney et al. (2014) Tinney, C. G., Faherty, J. K., Kirkpatrick, J. D., et al. 2014, ApJ, 796, 39
- Tokunaga et al. (2002) Tokunaga, A. T., Simons, D. A., & Vacca, W. D. 2002, PASP, 114, 180
- Tremblin et al. (2015) Tremblin, P., Amundsen, D. S., Mourier, P., et al. 2015, ApJ, 804, L17
- Werner et al. (2004) Werner, M. W., Roellig, T. L., Low, F. J., et al. 2004, ApJS, 154, 1
- Wright et al. (2010) Wright, E. L., Eisenhardt, P. R. M., Mainzer, A. K., et al. 2010, AJ, 140, 1868
- Wright et al. (2014) Wright, E. L., Mainzer, A., Kirkpatrick, J. D., et al. 2014, AJ, 148, 82
| Telescope/Instrument | Filter | N | DateaaFor VLT and Gemini, the dates apply to the beginning of the nights of the observations. For Hubble and Spitzer, the UT dates of the observations are listed. | Program ID |
|---|---|---|---|---|
| (sec) | ||||
| Spitzer/IRAC | [3.6] | 523.6 | 2013 Jun 21 | 90095 |
| Spitzer/IRAC | [4.5] | 526.8 | 2013 Jun 21 | 90095 |
| Spitzer/IRAC | [4.5] | 526.8 | 2014 Jan 20 | 90095 |
| Spitzer/IRAC | [4.5] | 526.8 | 2014 Feb 24 | 90095 |
| Spitzer/IRAC | [3.6] | 926.8 | 2014 Jul 1 | 10168 |
| Spitzer/IRAC | [4.5] | 926.8 | 2014 Jul 1 | 10168 |
| HST/WFC3 | F110W | 6903 | 2014 Nov 25 | 13802 |
| VLT/HAWK-I | CH4 cont | 50100 | 2014 Dec 1 | 094.C-0048 |
| VLT/HAWK-I | CH4 cont | 25100 | 2015 Jan 9 | 094.C-0048 |
| VLT/HAWK-I | CH4 cont | 25100 | 2015 Jan 15 | 094.C-0048 |
| VLT/HAWK-I | CH4 cont | 50100 | 2015 Jan 17 | 094.C-0048 |
| VLT/HAWK-I | CH4 cont | 50100 | 2015 Jan 19 | 094.C-0048 |
| VLT/HAWK-I | CH4 cont | 30100 | 2015 Jan 20 | 094.C-0048 |
| Spitzer/IRAC | [3.6] | 926.8 | 2015 Jan 29 | 10168 |
| Spitzer/IRAC | [4.5] | 926.8 | 2015 Jan 29 | 10168 |
| HST/WFC3 | F110W | 6903 | 2015 Mar 3 | 13802 |
| Spitzer/IRAC | [4.5] | 526.8 | 2015 Mar 5 | 10168 |
| Spitzer/IRAC | [3.6] | 40593.6 | 2015 Mar 10 | 11056 |
| Spitzer/IRAC | [4.5] | 40596.8 | 2015 Mar 9 | 11056 |
| HST/WFC3 | F110W | 6903 | 2015 Apr 11 | 13802 |
| Spitzer/IRAC | [4.5] | 526.8 | 2015 Jul 6 | 10168 |
| Spitzer/IRAC | [3.6] | 40593.6 | 2015 Aug 3 | 11056 |
| Spitzer/IRAC | [4.5] | 40596.8 | 2015 Aug 3 | 11056 |
| Gemini South/GMOS | 12609 | 2015 Nov 21 | GS-2015B-Q-16 | |
| Gemini South/GMOS | 4609 | 2015 Dec 13 | GS-2015B-Q-16 | |
| Gemini South/GMOS | 7609 | 2016 Jan 9 | GS-2015B-Q-16 | |
| Gemini South/GMOS | 17609 | 2016 Jan 10 | GS-2015B-Q-16 | |
| HST/WFC3 | F105W | 6903 | 2016 Mar 22 | 14157 |
| HST/ACS | F850LP | 6810 | 2016 Mar 23 | 14157 |
| HST/WFC3 | F105W | 6903 | 2016 Mar 23 | 14157 |
| HST/ACS | F850LP | 6810 | 2016 Mar 24 | 14157 |
| HST/ACS | F850LP | 6810 | 2016 Mar 24 | 14157 |
| HST/WFC3 | F127M | 6903 | 2016 Mar 27 | 14157 |
| HST/WFC3 | F105W | 6903 | 2016 Mar 28 | 14157 |
| HST/WFC3 | F127M | 6903 | 2016 Mar 28 | 14157 |
| HST/WFC3 | F127M | 6903 | 2016 Apr 6 | 14157 |
| (J2000) | (J2000) | MJD | Source | ||
|---|---|---|---|---|---|
| () | () | () | () | ||
| 133.7952573 | 0.125 | 7.2450910 | 0.135 | 55320.38 | WISE |
| 133.7943232 | 0.133 | 7.2450719 | 0.142 | 55511.35 | WISE |
| 133.7881778 | 0.025 | 7.2445255 | 0.025 | 56464.51 | Spitzer |
| 133.7870855 | 0.025 | 7.2444659 | 0.025 | 56677.29 | Spitzer |
| 133.7868470 | 0.025 | 7.2444642 | 0.025 | 56712.35 | Spitzer |
| 133.7858416 | 0.025 | 7.2443262 | 0.025 | 56839.71 | Spitzer |
| 133.7851503 | 0.025 | 7.2443041 | 0.025 | 56986.82 | HST |
| 133.7847553 | 0.025 | 7.2442609 | 0.025 | 57051.25 | Spitzer |
| 133.7843602 | 0.020 | 7.2442366 | 0.020 | 57084.82 | HST |
| 133.7845153 | 0.025 | 7.2442655 | 0.025 | 57086.16 | Spitzer |
| 133.7840688 | 0.020 | 7.2441796 | 0.020 | 57123.17 | HST |
| 133.7835385 | 0.025 | 7.2441445 | 0.025 | 57209.43 | Spitzer |
| 133.7819058 | 0.020 | 7.2440115 | 0.020 | 57474.62 | HST |
| 133.7818923 | 0.020 | 7.2440157 | 0.020 | 57475.41 | HST |
| 133.7818300 | 0.020 | 7.2440063 | 0.020 | 57484.38 | HST |
| Band | Magnitude | Reference |
|---|---|---|
| 27.2aaS/N3. | 1 | |
| 24.3aaS/N3. | 2 | |
| 26.85 | 1 | |
| 24.4aaS/N3. | 3 | |
| 27.330.19 | 1 | |
| 26.710.19 | 1 | |
| 26.470.13 | 1 | |
| 26.000.12 | 1 | |
| 24.520.12 | 1 | |
| 24.490.11 | 1 | |
| 24.360.09 | 1 | |
| 4 | ||
| CH4 cont | 23.20.2 | 1 |
| aaS/N3. | 5 | |
| aaS/N3. | 6 | |
| 17.820.33 | 5 | |
| 14.020.05 | 5 | |
| 17.440.05 | 1 | |
| 17.300.05 | 1 | |
| 17.340.02 | 8 | |
| 17.280.02 | 8 | |
| 13.880.02 | 1 | |
| 13.900.02 | 1 | |
| 13.920.02 | 1 | |
| 13.930.02 | 1 | |
| 13.860.02 | 1 | |
| 13.820.02 | 1 | |
| 13.840.02 | 8 | |
| 13.860.02 | 1 | |
| 13.800.02 | 8 |
Note. — All data are Vega magnitudes. For bands with multiple measurements, the data are listed in the order of the dates of observations from Table 1 with the exception of the second epoch in [3.6], for which a measurement is not presented because of blending with another star.
| Parameter | Value |
|---|---|
| 0.008 | |
| cos | yr-1 |
| yr-1 |