Study of Rydberg blockade mediated optical non-linearity in thermal vapor using optical heterodyne detection technique
Abstract
We demonstrate the phenomenon of blockade in two-photon excitations to the Rydberg state in thermal vapor. A technique based on optical heterodyne is used to measure the dispersion of a probe beam far off resonant to the D line of rubidium in the presence of a strong laser beam that couples to the Rydberg state via two-photon resonance. Density dependent suppression of the dispersion peak is observed while coupling to the Rydberg state with principal quantum number, . The experimental observation is explained using the phenomenon of Rydberg blockade. The blockade radius is measured to be about m which is consistent with the scaling due to the Doppler width of 2-photon resonance in thermal vapor. Our result promises the realization of single photon source and strong single photon non-linearity based on Rydberg blockade in thermal vapor.
I introduction
Rydberg atoms are enriched with enhanced two-body interactions. When atoms in a dense frozen ensemble are excited to the Rydberg state using narrow band lasers, strong Rydberg-Rydberg interactions lead to excitation blockade. This blockade interaction generates a highly entangled many-body quantum state in an ensemble of atoms which has become the basis for fundamental quantum gates using atoms jaks00 ; luki01 ; isen10 ; wilk10 or photons frie05 and for realization of single photon source saff02 ; dudi12 . Rydberg blockade in ultra-cold atoms and Bose-Einstein condensate (BEC) has been proposed to study strongly correlated systems weim08 ; pohl09 ; pupi10 ; henk10 . In addition, strong photon-photon interactions enabled by Rydberg blockade mediated optical non-linearity has been proposed sevi11 ; gors11 . Rydberg blockade has been demonstrated for an ensemble of ultra-cold atoms in a magneto-optical trap (MOT) tong04 ; sing04 ; cube05 ; vogt06 or in a magnetic trap heid07 ; rait08 and also for single atoms trapped in optical micro traps urba09 ; gaet09 . Recently, strong optical non-linearity mediated by Rydberg blockade in cold atom has been observed for weak classical light prit10 as well as for single photons peyr12 ; firs13 and also in a cold atomic sample inside an optical cavity pari12 .
The blockade radius for an ultra-cold atomic sample is defined as , where is the effective Rabi frequency of the Rydberg excitation and is the strength of the van der Waals type Rydberg-Rydberg interaction. For a thermal ensemble of atoms, the blockade radius is affected by the Doppler width () due to the thermal motion of atoms. Since the van der Waals interaction scales as the sixth power of the inter-atomic separation, the blockade radius is scaled down as kubl10 . For thermal rubidium atoms at room temperature, the blockade radius is decreased only by a factor in the range of . If one works with a Rydberg state, , the blockade radius in thermal vapor is of the order of a few microns. Electromagnetically induced transparency involving Rydberg state (Rydberg EIT) has been demonstrated in thermal vapor cell moha07 and in micron sized vapor cell kubl10 . Van der Waals interactions of Rydberg atoms in thermal vapor has been observed recently balu13 . In addition, four wave mixing involving Rydberg state koll12 and large dc Kerr non-linearity of a Rydberg EIT medium has also been demonstrated in thermal vapor moha08 .
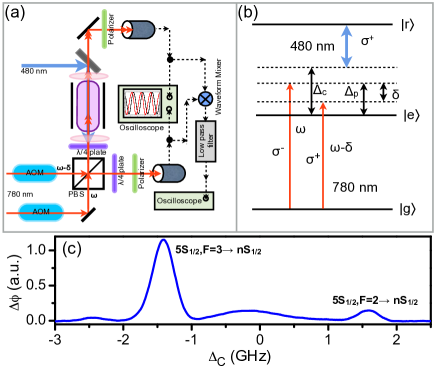
In this article, we present the first ever strong evidence of Rydberg blockade in thermal vapor using narrow-band lasers for Rydberg excitations. The schematic of the experimental set up is shown in figure 1(a). A technique based on optical heterodyne is used to measure the dispersion of a probe beam due to two-photon excitation to the Rydberg state. A similar method used for dispersion measurement in atomic vapors is reported in references akul99 ; akul04 . An external cavity diode laser operating at nm is used to derive two probe beams. A frequency offset is introduced between the probe beams by passing them through two acousto-optic modulators. Both the beams are made to superpose using a polarizing cube beam splitter (PBS). The interference beat signals are detected using two fast photo-detectors by introducing polarizers at both the output ports of the PBS. The probe beams coming out of one of the output ports of the PBS propagate through a magnetically shielded rubidium vapor cell. The density of 85Rb vapor can be increased to cm-3 by heating the cell up to C. The coupling beam is derived from a frequency doubled diode laser operating at nm and it counter-propagates the probe beams through the cell. The coupling and the probe beams are focused inside the cell using lenses. The waist and the Rayleigh range of the probe (coupling) beams are m ( m) and mm ( mm), respectively. The peak Rabi frequencies of the laser beams and their variations over the length of the vapor cell were calculated rabi using the same parameters of the beams and were included in the theoretical model to fit all the experimental data.
The probe beams propagating through the medium can undergo different phase shifts by choosing suitable polarizations of the probe and the coupling beams. The polarization of the coupling beam is chosen to be and the probe beams to be and as shown in figure 1(b). The probe beam with polarization can not couple the two-photon transition, s1/2 s1/2 and doesn’t go through any phase shift due to two-photon process. We use it as the reference probe beam. However, the other probe beam with polarization can couple the same two-photon transition and hence, goes through a phase shift due to two-photon excitation to the Rydberg state. This additional phase shift of the signal probe beam appears as a phase shift in the respective beat signal and is measured by comparing to the phase of the reference beat signal detected at the other output port of the PBS. Since, both the beat signals are the output of the same interferometer, the noise due to vibration and acoustic disturbances are strongly suppressed. The signal-to-noise ratio was further improved by using a lock-in amplifier.

The beat signals passing through a high pass filter have the form, , . Here, is the frequency offset between the probe beams and (), () are the amplitude and phase of the reference (signal) beat, respectively. and depend on the power of the probe beams falling on the detector. The beat signals are then multiplied using an electronic waveform mixer and are passed through a low pass filter. The output of the low pass filter gives a DC signal, where . For any small variation of the phase around (), gives information about absorption (dispersion) of the probe beam propagating through the medium. A phase offset between the beams falling on the reference detector was introduced by placing a -plate before the polarizer. As a result, the phase of the reference beat can be controlled by rotating the polarizer axis. The refractive index of the probe beam due to two-photon excitation to the Rydberg state can be measured with a phase offset, . The detailed principle of the technique can be found in reference bhow16 . For a larger frequency offset between the probe beams in comparison to their Rabi frequency, the experimental result matches well with the standard model of a 3-level atom interacting with a single probe and coupling beams bhow16 . Hence, a large frequency offset of MHz is used in the experiment.
In the experiment, the probe beam was stabilized at GHz blue detuned to the D2 line of 85Rb. The coupling laser frequency was scanned to observe the dispersion of the probe beam by measuring its phase shift due to the two-photon excitations to the Rydberg state. A typical dispersion spectrum with the coupling beam scanning over GHz is shown in figure 1(c). The 2-photon resonance peaks corresponding to the transitions, s1/2F s1/2 and s1/2F s1/2 are observed and are used to normalize the frequency axis. The dispersion peak corresponding to the s1/2F s1/2 transition was analyzed for the further study of Rydberg excitation. For a weak probe beam, an usual dispersion profile of the two-photon resonance is observed as shown in figure 2(a). However, an absorptive like dispersion profile is observed for a stronger probe beam as shown in figure 2(b). In order to explain the shape of the dispersion profile, we consider a three level atomic system interacting with two monochromatic laser field in ladder configuration as shown in figure 1(b). and are used as probe and coupling Rabi frequencies respectively. The density matrix equation, is solved numerically in steady state and is averaged over the Maxwell-Boltzmann velocity distribution of the atom. Here, is the Hamiltonian for a three-level atom interacting with two mono-chromatic light field in a suitable rotating frame and is the Lindblad operator which takes care of the decoherence in the system. In the numerical calculation, we have used the decay rate of the channels as MHz. A population decay rate of the Rydberg state to the ground state denoted as is used to account for the finite transit time of the thermal atoms in the laser beams. The dipole dephases at a rate of , where accounts for the relative laser noise between the probe and the coupling beams. and are of the order of MHz. The dispersion of the probe beam due to 2-photon excitation calculated using the theoretical model is shown in figure 2.
To get an insight to such unusual dispersion profile, we approximated the 3-level atom as an effective 2-level atom by adiabatically eliminating the intermediate state han13 . Using the same approximation ( and ) in the steady state equations of 3-level atom, the susceptibility of the medium can be written as , where is the susceptibility of the lower transition without coupling beam and is the susceptibility due to 2-photon resonance only. where is the vapor density and is the dipole moment of the lower transition. In the regime ,
| (1) |
Where with and . The Rydberg population () can be determined analytically using the effective 2-level model. Doppler averaging of the equation (1) with same laser parameters fits well with the experimental data as shown in figure 2. This approximate model shows a very little deviation from the exact 3-level calculation for the probe Rabi frequency up to MHz. It is worthwhile to mention that . Comparing it with , the dispersion peak is an order of magnitude larger than the absorption peak for GHz and MHz.
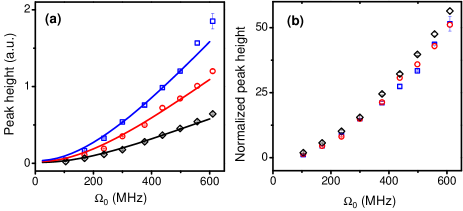
In a further study of variation of the dispersion peak height as a function of probe Rabi frequency, an RF attenuator at the output of the detectors was used to keep the amplitude of the beat constant irrespective of the probe laser power. The variation of the dispersion peak height as a function of probe Rabi frequency for different vapor densities is shown in figure 3(a). The dispersion peak height calculated by the theoretical model for the same laser parameters and vapor densities agrees well as shown in figure 3(a). When the dispersion peak height data is normalized to that of a weak probe beam, then all the data corresponding to different densities fall on the same line as shown in figure 3(b). This observation suggests that the refractive index of the medium depends linearly on the vapor density and the Rydberg-Rydberg interaction has negligible effect.
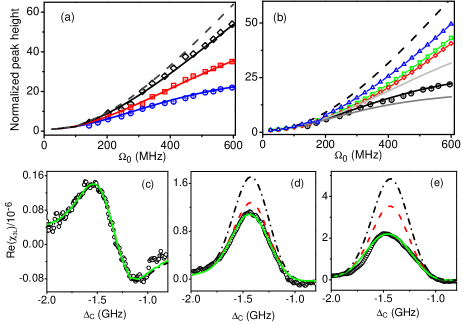
To study the blockade interaction, the blue laser was tuned to interact with a Rydberg state with principal quantum number and the same experiment was performed. The variation of the dispersion peak height at different densities in the strong Rydberg-Rydberg interaction regime is shown in figure 4(a). In contrast to the observation presented in figure 3, the normalized dispersion peak height shows a non-linear dependence of density and there is a clear indication of suppression of the dispersion peak at higher densities. Since , then suppression in dispersion peak height is due to the suppression of Rydberg population which is the signature of the Rydberg blockade interaction. The ions inside the vapor cell has negligible effect which was confirmed using Rydberg EIT moha07 for s1/2 Rydberg state. The blackbody radiation induced ionization and transition rates are less than kHz bete07 and has negligible effect. To exclude the possibility of suppression in the dispersion peak due to interaction induced dephasing, we introduced a Rydberg population dependent dephasing of the dipole matrix element similar to the model discussed in reference balu13 . Rydberg population () decays at a rate of and decays at a rate of . Introducing this term in the effective 2-level model, a cubic equation of is obtained. Looking at the coefficients of the cubic equation, one can deduce that out of the 3 solutions of , one is positive real and the other two solutions are either negative real or complex conjugate to each other. The positive solution of is evaluated by solving the cubic equation numerically and is replaced in equation (1) to calculate the dispersion of the probe beam. The dispersion peak height calculated using this model is shown in figure 4(b). We have observed that depending on , the dispersion peak height reduces in comparison with the non-interacting model, but monotonically increases as the probe Rabi frequency and doesn’t display any feature of saturation. Also, by increasing from MHz to GHz, a very small reduction of the dispersion peak is observed.
To explain the saturation of the experimental data, we introduced blockade classically. Consider the number of atoms per blockade sphere to be nad blockade radius to be . The probability of simultaneous multiple excitations of out of atoms to the Rydberg state is given by . For these events, only one Rydberg excitation out of atoms is considered and the blockaded Rydberg population is evaluated as . The dispersion of the probe is then determined by replacing in equation (1). The theoretical curves generated after introducing blockade into the model are shown in figure 4. If we take m, then it fits well with the experimental data for all three densities. As shown in figure 4(b), if the blockade radius is changed by , it clearly doesn’t fit to the experimental data. The width of the dispersion spectra for different probe Rabi frequencies are shown in figure 4(c,d and e). For MHz, the Rydberg population is small and in this non-interacting regime, the model with blockade and population dependent dephasing shows very little deviation from the non-interacting model. For MHz, the model with population dependent dephasing reduces significantly from the non-interacting model but further including blockade doesn’t show much deviation. For MHz, there is a significant suppression of the peak due to blockade. However, the width of the dispersion spectrum doesn’t change appreciably compared to the non-interacting model as shown in figure 4(e) which indicates a clear evidence of Rydberg blockade in our system.
In conclusion, Rydberg blockade is demonstrated in thermal vapor and the blockade radius is measured to be m. The van der Waals coefficient () for the Rydberg state (s1/2) is Ghz/m6 prit10 . The typical width of the 2-photon resonance is about MHz which can be determined from figure 1(c). Hence, blockade radius in this system should be approximately m which differ from our experimental result by less than . It is to be noted that we have introduced blockade classically and a full quantum mechanical model may give a better estimate for the blockade radius. Our result shows that the coherent collective Rydberg excitation is possible in thermal vapor and opens up the possibility to build the quantum devices like single photon source and photonic phase gate based on Rydberg blockade non-linearity in thermal vapor.
II ACKNOWLEDGMENTS
We acknowledge the fruitful discussions with Sabyasachi Barik and Surya N Sahoo regarding the heterodyne detection technique. We also thank Sushree S Sahoo for assisting in performing the experiment. This experiment was financially supported by the Department of Atomic Energy, Govt. of India.
References
- (1) D. Jaksch, J. I. Cirac, P. Zoller, S. L. Rolston, R. Cote, and M. D. Lukin, Phys. Rev. Lett 85, 2208 (2000)
- (2) L. Isenhower, E. Urban, X. L. Zhang, A. T. Gill, T. Henage, T. A. Johnson, T. G. Walker, and M. Saffman, Phys. Rev. Lett. 104, 010503 (2010)
- (3) T. Wilk, A. Gatan, C. Evellin, J. Wolters, Y. Miroshnychenko, P. Grangier, and A. Browaeys, Phys. Rev. Lett. 104, 010502 (2010)
- (4) M. D. Lukin, M. Fleischhauer, R. Cote, L. M. Duan, D. Jaksch, J. I. Cirac, and P. Zoller, Phys. Rev. Lett. 87, 037901 (2001)
- (5) I. Friedler, D. Petrosyan, M. Fleischhauer, and G. Kurizki, Phys. Rev. A 72, 043803 (2005)
- (6) M. Saffman, and T. G. Walker, Phys. Rev. A 66, 065403 (2002)
- (7) Y. O. Dudin, and A. Kuzmich, Science 336, 887 (2012)
- (8) H. Weimer, R. Lw, T. Pfau, and H. P. Bchler, Phys. Rev. Lett. 101, 250601 (2008)
- (9) T. Pohl, E. Demler, and M. D. Lukin, Phys. Rev. Lett. 104, 043002 (2010)
- (10) G. Pupillo, A. Micheli, M. Boninsegni, I. Lesanovsky, and P. Zoller, Phys. Rev. Lett. 104, 223002 (2010)
- (11) N. Henkel, R. Nath, and T. Pohl, Phys. Rev. Lett. 104, 195302 (2010)
- (12) S. Sevincli, N. Henkel, C. Ates, and T. Pohl, Phys. Rev. Lett. 107, 153001 (2011)
- (13) A. V. Gorshkov, J. Otterbach, M. Fleischhauer, T. Pohl, and M. D. Lukin, Phys. Rev. Lett. 107, 133602 (2011)
- (14) D. Tong, S. M. Farooqi, J. Stanojevic, S. Krishnan, Y. P. Zhang, R. Cote, E. E. Eyler, and P. L. Gould, Phys. Rev. Lett. 93, 063001 (2004)
- (15) K. M. Singer, M. Reetz-Lamour, T. Amthor, L. G. Marcassa, and M. Weidemller, Phys. Rev. Lett. 93, 163001 (2004)
- (16) T. Cubel Liebisch, A. Reinhard, P. R. Berman, and G. Raithel, Phys. Rev. Lett. 95, 253002 (2005)
- (17) T. Vogt, M. Viteau, J. Zhao, A. Chotia, D. Comparat, and P. Pillet, Phys. Rev. Lett. 97, 083003 (2006)
- (18) R. Heidemann, U. Raitzsch, V. Bendkowsky, B. Butscher, R. Lw, L. Santos, and T. Pfau, Phys. Rev. Lett. 99, 163601 (2007)
- (19) U. Raitzsch, V. Bendkowsky, R. Heidemann, B. Butscher, R. Lw, and T. Pfau, Phys. Rev. Lett. 100, 013002 (2008)
- (20) E. Urban, T. A. Jojnson, T. Henage, L. Isenhower, D. D. Yavuz, T. G. Walker, and M. Saffman, Nature Phys. 5, 110 (2009)
- (21) A. Gatan, Y. Miroshnychenko, T. Wilk, A. Chotia, M. Viteau, D. Comparat, P. Pillet, A. Browaeys, and P. Grangier, Nature Phys. 5, 115 (2009)
- (22) J. D. Pritchard, D. Maxwell, A. Gauguet, K. J. Weatherill, M. P. A. Jones, and C. S. Adams, Phys. Rev. Lett. 105, 193603 (2010)
- (23) T. Peyronel, O. Firstenberg, Qi-Yu Liang, S. Hofferberth, A. V. Gorshkov, T. Pohl, M. D. Lukin, and V. Vuleti, Nature 488, 57 (2012)
- (24) O. Firstenberg, T. Peyronel, Qi-Yu Liang,A. V. Gorshkov, M. D. Lukin, and V. Vuleti, Nature 502, 71 (2013)
- (25) V. Parigi, E. Bimbard, J. Stanojevic, A. J. Hilliard, F. Nogrette, R. Tualle-Brouri, A. Ourjoumtsev, and P. Grangier, Phys. Rev. Lett 109, 233602 (2012)
- (26) H. Kbler, J. P. Shaffer, T. Baluktsian, R. Lw, T. Pfau, Nature Phot. 4, 112 (2010)
- (27) A. K. Mohapatra, T. R. Jackson, and C. S. Adams, Phys. Rev. Lett. 98, 113003 (2007)
- (28) T. Baluktsian, B. Huber, R. Lw, and T. Pfau, Phys. Rev. Lett. 110, 123001 (2013)
- (29) A. Klle, G. Epple, H. Kbler, R. Lw, and T. Pfau, Phys. Rev. A 85, 063821 (2012)
- (30) A. K. Mohapatra, M. G. Bason, B. Butscher, K. J. Weatherill, and C. S. Adams, Nature Phys. 4, 890 (2008)
- (31) A. M. Akulshin, S. Barreiro, and A. Lezama, Phys. Rev. Lett. 83, 4277 (1999)
- (32) A. M. Akulshin, A. I. Sidorov, R. J. McLean, and P. Hannaford, J. Phys. B 6, 491 (2004)
- (33) The probe Rabi frequency is estimated using the relation with the intensity of probe as . For 85Rb, mW and MHz. Coupling Rabi frequency is estimated by fitting the Rydberg EIT signal with a weak probe beam without focusing and then scaling it with the intensity of the beam.
- (34) A. Bhowmick, S. Sahoo, and A. K. Mohapatra (Under preparation)
- (35) R. Han, H. K. Ng, and B. G. Englert, J. of Mod. Opt. 60, 255 (2013)
- (36) I. I. Beterov, D. B. Tretyakov, I. I. Ryabtsev, A. Ekers, and N. N. Bezuglov, Phys. Rev. A 75, 052720 (2007)