An Optimal Energy Estimator to Reduce Correlated Noise for the EXO-200 Light Readout
Abstract
The energy resolution of the EXO-200 detector is limited by electronics noise in the measurement of the scintillation response. Here we present a new technique to extract optimal scintillation energy measurements for signals split across multiple channels in the presence of correlated noise. The implementation of these techniques improves the energy resolution of the detector at the neutrinoless double beta decay Q-value from % to %.
1 Introduction
Searches for neutrinoless double beta decay () are the most sensitive test of whether neutrinos are Majorana particles [1, 2, 3, 4]. In the simplest interpretation, if decay occurs, the emitted electron pair must carry away the full energy (Q-value) of the decay. In contrast, for the observed two neutrino decay () [5], the electron pair takes on a continuum of lesser energies. The existence of decay would be observed as a peak in the energy spectrum at the Q-value broadened by the energy resolution of the detector. Thus, obtaining the best energy resolution possible for a given detection technology is important to maximize the sensitivity of searches for decay.
EXO-200 searches for the decay of 136Xe in liquid xenon (LXe) time projection chambers [6]. EXO-200 determines the energy of interactions in the LXe (events) by combining the ionization and scintillation response. This allows energy resolution to be improved by accounting for the anti-correlation between these responses [7]. Currently, noise in the electronic readout of the scintillation response limits the energy resolution of EXO-200. Detectors collecting scintillation light produced by an event are read out as multiple channels. The existing readout electronics introduce noise that is correlated between these channels. In early EXO-200 analyses, the scintillation signal per event was determined from the collective response of all light readout channels. This enhanced the correlated noise components, leading to degradation of the resolution.
Correlated noise is a common problem in detectors with many signal readout channels, including in those of other experiments. Previous techniques implemented to reduce correlated noise have taken advantage of the ability to measure cross-correlations between the noise in the signal channel and correlated channels where only noise is present [8, 9].
Here we present a technique capable of accounting for both correlated noise and simultaneous signals on all scintillation channels in EXO-200. This technique, known as de-noising, was developed for the analysis reported in [6] and used in subsequent data analyses. As described in detail in sections 3 and 4, this technique does not produce filtered waveforms. Instead, it takes advantage of features of the scintillation collection, measurement, and readout process in EXO-200 to create an optimal energy estimator that is robust against the correlated noise shared between channels. Similar non-filtering techniques for optimally estimating pulse magnitudes have been considered for single channels [10].
The benefits of such improved energy estimates are observed when considering the entire EXO-200 data set, and are discussed in section 5. The general method presented can be adapted to a variety of detector technologies via changes to the detector model.
2 EXO-200 Detector Description
Here we describe the EXO-200 detector, focusing on features of interest to the measurement of the scintillation response; for a more complete description see [11]. The LXe vessel in EXO-200 is in diameter and in length and contains LXe enriched to 80.6% in (Q-value of [12]). This vessel is split into two cylindrical time projection chambers (TPCs) by a shared cathode, as shown in figure 1. Both TPCs are instrumented with readout systems to measure induced and collected charge and scintillation light signals.
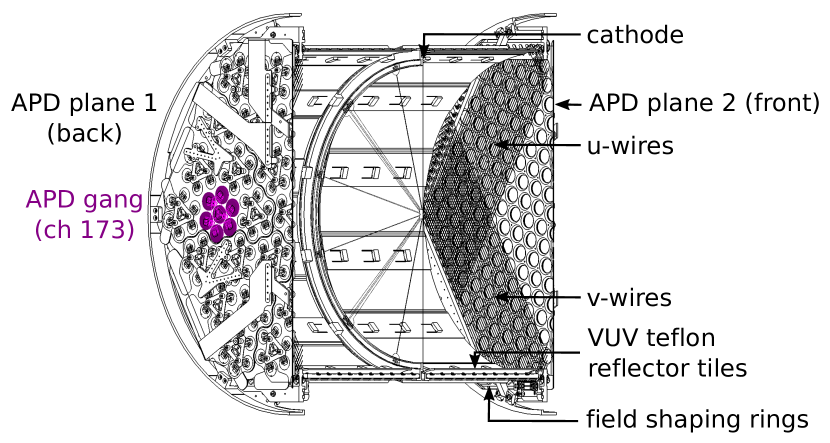
The isotropically emitted scintillation light produced by energy deposits in the LXe is collected in each TPC behind the anode by an array of large area avalanche photodiodes (APDs) [13]. The shared cathode has 90% optical transparency [11], so every energy deposit can generate scintillation signals on all APDs. Such a signal is a pulse proportional to the amount of light collected by that APD. Light collection efficiency is improved by Teflon (PTFE) reflector tiles along the length of the detector just inside the field shaping rings. Each array of APDs (APD plane) consists of 234 unencapsulated APDs [14] mounted on a copper platter that provides a common APD cathode bias voltage of . Neighboring APDs, with similar gain characteristics, are ‘ganged’ in groups of 5–7. Each gang is read out as a single channel by a charge-sensitive preamplifier. An anode trim voltage, adjustable on groups of six channels by up to , allows APD gains to be matched to within 2.5% of a nominal gain of 200.
The signals from each APD gang are shaped using two RC integrators, each with a time constant, , of , and two CR differentiators, each with of . An additional differentiator with of is included in the preamplifier circuit. These shaping times are much longer than the light collection and APD response time, resulting in an APD signal with a fixed pulse shape that is fully determined by this shaping. All the channels are digitized at and saved in ‘frames’ of 2048 sequential samples centered around a readout trigger.
Each APD plane also includes a PTFE diffuser that can be illuminated by a laser pulser for monitoring of the APD light response. Further monitoring is performed using a 228Th calibration source with a prominent line at (from the decay of 208Tl). This source is deployed, within a guide tube positioned around the exterior of the LXe vessel, at several locations to fully illuminate the LXe volume. Data from such deployments are used to determine the position and time dependence of the scintillation response, which is described in section 4.2.
2.1 APD Noise
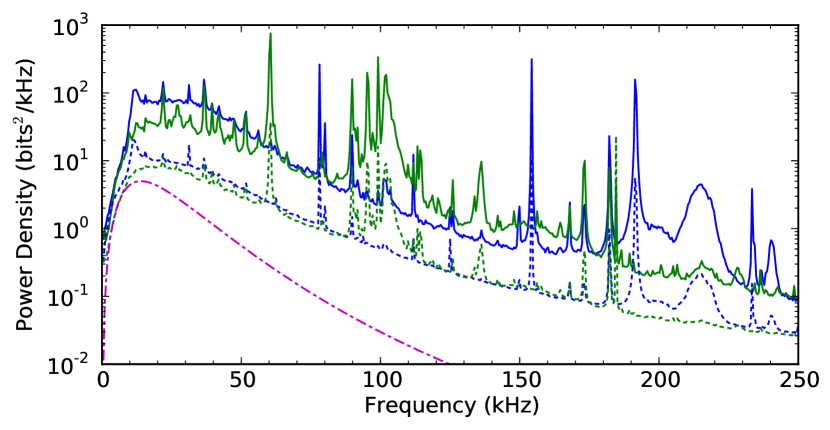
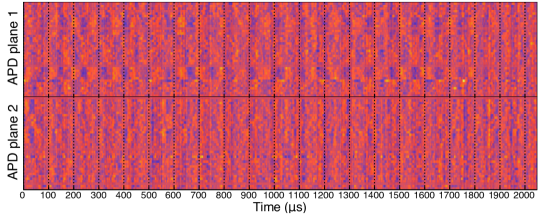
The power spectrum of the pulse shape is compared in figure 2 to power spectra of the noise. For each APD plane, the noise power spectrum of the summed waveform over all APD channels (the coherent sum) is compared to the sum of individual channel power spectra (the incoherent sum). The large excess of noise in the coherent sum indicates that the noise is dominated by sources that are correlated between channels. This correlated nature of the noise can be seen in figure 3 as vertical features of common intensity at a point in time. APD gangs in a given anode trim group are more correlated and appear as blocks.
|
|
Exhaustive study of the detector electronics indicates that this correlated noise largely results from the grounding scheme and switching noise from the high voltage supply of the APD plane. This noise will be reduced in future data collection subsequent to an upcoming electronics upgrade.
The development of data analysis techniques that account for such correlated noise allows substantial improvement in the scintillation energy resolution that can be obtained with existing EXO-200 data. Section 3 explains the de-noising technique utilized, section 4 describes the characterization of EXO-200 required to implement the de-noising, and section 5 discusses the improvement obtained.
3 Optimal Energy Estimator
In EXO-200, uncertainty in the scintillation energy measurement is understood to have two primary sources: the detector electronics contribute a substantial additive noise to the readout channels, and the photon yield from typical events is sufficiently low that individual channels are subject to significant shot noise (statistical fluctuation in readout quanta). De-noising is the pursuit of an energy estimator that is robust to both of these forms of noise, while only demanding a level of detector characterization which is reasonable to achieve in EXO-200.
Partial solutions to this problem are unsatisfactory in practice. As described in section 2.1, a simple sum over all channels, which decreases shot noise relative to the magnitude of the summed signal pulse, does not suppress the correlated components of the additive noise. A potential solution to this problem could be to take the sum of channels weighted to suppress the correlated noise. If EXO-200 had numerous signal-free channels this would be a reasonable solution, but in practice, the channels with the most highly correlated noise also have correlated signals, leading to cancellation of both signal and noise.
Qualitatively, a full solution must be capable of using a priori knowledge of correlations between channels due to noise correlations and correlations between channels of signal pulses for each event. These known properties of the signal pulses depend on timing and the position of energy deposits and therefore vary for each event. For each event the method should use this knowledge to select channels, and frequencies within those channels, which reduce shot noise without introducing too much additive noise.
The remainder of this section describes a de-noising technique that balances additive noise against shot noise in a multichannel detector to produce a minimum-variance unbiased linear estimator of energy. As only linear estimators are considered, the optimization is of a quadratic function of several variables subject to linear equality constraints. This optimization is of a standard form and can be solved efficiently using highly optimized linear algebra software. As the technique is applicable to a variety of detector technologies, details of the input parameters specific to EXO-200 are deferred to section 4. The required form of and constraints on the estimator is derived for frames containing only a single event (eq. 3.5). For a more thorough treatment readers are directed to [15]. The signal and noise are treated in detail to reduce the obtained estimator solutions to eq. 3.9. These solutions are further reduced to eq. 3.11 for the purpose of computation. The extension of this technique to frames with more complex events is then discussed.
3.1 Optimization Framework
For each event, a frame of waveform data is collected (see section 2). Once the timing of the scintillation signal is determined, the waveform observed on channel , , can be written in the (discrete) frequency domain with complex-values as
| (3.1) |
where is the known (unit magnitude) pulse shape, is the pulse magnitude, is the additive noise on the channel, and is the frequency index. In this notation, is a random variable that depends on the scintillation energy, and is a waveform of complex-valued random variables that are independent of the scintillation energy.
We seek an estimator for the scintillation energy of the form:
| (3.2) |
where R (I) denotes the real (imaginary) part of the complex value, and and are real-valued weighting parameters to be derived on an event-by-event basis so that eq. 3.2 produces the optimal energy estimate. This estimator must be unbiased:
| (3.3) |
where returns the expectation value. We seek the minimum-variance estimator subject to this constraint, where the variance is expressed as
| (3.4) |
Assuming that the expectation values and pairwise covariances of waveform samples can be specified, eq. 3.3 and eq. 3.4 form a quadratic optimization problem with a linear constraint over the parameters , . Using the method of Lagrange multipliers, we minimize for some . The optima are described by solutions to the linear systems, for all and , of equations:
| (3.5a) | ||||
| (3.5b) | ||||
| (3.5c) | ||||
The expectation values and covariances of and depend on the position and energy of an event, as well as the date (due to time-varying gain and noise properties of the EXO-200 detector). Given these dependencies and the large number of pairwise covariances which must be specified, detailed characterization of the EXO-200 waveforms is a challenging task and is deferred to section 4. Section 3.2 describes simplifying assumptions applicable to a broad range of detectors.
3.2 Waveform Expectation Values
This section describes generic assumptions on the statistical model of the waveform, (see eq. 3.1). The additive noise waveforms at each frequency, , are assumed to have mean zero:
| (3.6a) | ||||
| and to be independent from the pulse magnitude: | ||||
| (3.6b) | ||||
These assumptions are valid at the energies of interest for , where the signals are sufficiently large that the trigger time is independent of the noise. The energy dependence of the expectation value of the signal pulse magnitude is assumed linear:
| (3.7) |
where , the light map (see section 4.2), depends on the APD channel , the position of the energy deposit , and the date of the event . In reality, there is some non-linear relationship between the energy of a deposit and the number of photons generated, which is determined from calibrations. This approach still works for deviations from linearity that are common to all channels, but differing non-linearity across channels is not addressed. For non-zero frequencies we assert that additive noise waveforms () at different frequencies must have zero correlation:
| (3.8) |
It is possible that noise at different frequencies is related by higher-order statistics. However, assuming that the phases of the noise components are independent of the trigger time, eq. 3.8 will still hold.
Given these assumptions, eqs. 3.5 reduce (see [15]) to:
| (3.9d) | |||
| (3.9h) | |||
| (3.9i) | |||
For any particular event, eqs. 3.9 comprise a well-defined inhomogenous system of equations. This system is linear in the unknown parameters (, , and ), and quadratic in the waveforms (via the covariances of the signals). The true event energy does not explicitly appear although it does enter into these covariances of the signals. This apparent circularity is addressed in section 4.3. Analysis of the additive noise, light map, and shot noise is deferred to section 4.
3.3 Computational Implementation
In principle, from eqs. 3.9 it is straightforward to form the equivalent matrix expression , where contains the unknown parameters, and to apply standard matrix algorithms.444As performed in section 4.6 of [15]. In practice, EXO-200 has 1024 frequency values and 70 scintillation channels, so eqs. 3.9 describe a linear system in (real) unknowns. As this system must be solved separately for each of more than EXO-200 events, the direct matrix approach is computationally infeasible.
Fortunately, the equivalent matrix operator can be applied to vectors efficiently. The matrix operator can be computed readily after first evaluating the contribution to the energy estimate of a unit collection on each channel:
| (3.10) |
Eqs. 3.9 then reduce to:
| (3.11c) | |||
| (3.11f) | |||
| (3.11g) | |||
Although the number of unknowns is not reduced, the number of products required to evaluate is only of the number for a dense matrix of similar size. This system can then be solved using any iterative method designed to take advantage of fast matrix-vector multiplication. EXO-200 uses the biconjugate gradient stabilized algorithm [16]. In addition, the problem is also parallelizable, as each event can be de-noised independently.
3.4 Extensions for Complex Events
The preceding sections describe EXO-200’s approach to estimate the scintillation energy of simple frames, where exactly one event deposits energy at a single site (SS) within the detector. Candidate and events primarily fall in this category. The EXO-200 data set also includes frames capturing multiple events and events depositing energy at multiple sites. Most of the backgrounds produce multisite (MS) events, where multiple charge deposits are resolved but all scintillation light is detected simultaneously. In this section, we discuss approaches to de-noise these two kinds of complex frames.
First, consider frames with scintillation signals from multiple events that are separated by some measurable amount of time. Such frames are infrequent during EXO-200 data taking,555Except for time-correlated backgrounds such as the decays of 214Bi followed by that of 214Po used in [17] and the prompt cosmogenic events used in [18]. but common in calibration runs due to the high event rate of the radioactive sources. Discarding such triggers from calibration data leads to an unacceptable loss of live time. Instead, the energy estimators are additionally constrained by placing nulls between them. In other words, we wish to constrain the energy estimator for each event to be unaffected by the signal pulses from any other event. The constraint of eq. 3.9i is generalized as
| (3.12) |
where , , and now depend on the event contained within the waveform as indexed by . We are taking advantage of the different timing of the waveforms through the phases of , and the different distribution of photons across channels through the light map’s dependence on , to differentiate signal pulses. As the events become closer in time and space, this constraint becomes harder to satisfy and the resolution of the energy estimator degrades accordingly. However, the errors are uncorrelated between events sharing a waveform (to the extent that the light map, waveforms, and position estimates are accurate).
For the second type of complex frame, those with MS events, the de-noising analysis of the preceding sections is confronted with multiple positions ,…. Currently, EXO-200 only considers the total scintillation energy of the MS event, by extending the scope of the light map with a weighted average of the deposits:
| (3.13) |
where is the energy of deposit . This formulation depends on a priori knowledge of the individual deposit energies, which can be roughly determined for each deposit by the measurement of the ionization signal. This partitioning suffers from the anti-correlation between the scintillation and ionization signals, so those values only allow us to approximate the true distribution of photons from the event. As a result eq. 3.9i, which guaranteed that the SS energy estimators would be unbiased, can only approximately guarantee an unbiased estimator for MS events.
4 Statistical Characterization of EXO-200
The preceding section described de-noising for a multichannel detector under generic assumptions about the statistical properties of signal pulses and noise. In this section these properties are quantified for the EXO-200 detector using a combination of physical modeling and calibration data to understand the second-order statistics relevant to de-noising.
4.1 Additive Noise Correlations
De-noising mitigates additive noise in two ways: by exploiting correlations between channels and by giving channels with worse signal-pulse-to-noise ratio lower weight. Both can be accomplished by specifying the second-order correlations between noise waveforms for each Fourier frequency, .
The statistical properties of the noise are known to vary over time, so noise measurements are gathered during every physics run by a “solicited” trigger. These solicited data frames are triggered independently of channel thresholds at a fixed rate to collect noise events for detector characterization. Solicited-trigger data frames are almost entirely free of signal pulses due to the rate of events collected by other triggers in EXO-200. Any exceptional solicited trigger that is coincident with an energy deposit large enough to exceed either the scintillation or ionization detection thresholds is excluded prior to characterizing the noise.
Using a single set of noise properties for the entire data collection period would not account for the time dependence of the noise and negatively impact the de-noised energy resolution. Conversely, storing noise correlations for each physics run is unnecessary. In addition, it would lead to a partitioning in which calibration runs rely on nearby low-background data for their noise calibrations, whereas low-background runs could directly make use of their own waveforms to measure noise and might therefore benefit from a different level of accuracy in those inputs. To alleviate such concerns, the data collection period is binned into multiple time intervals, each with fairly stable noise properties.
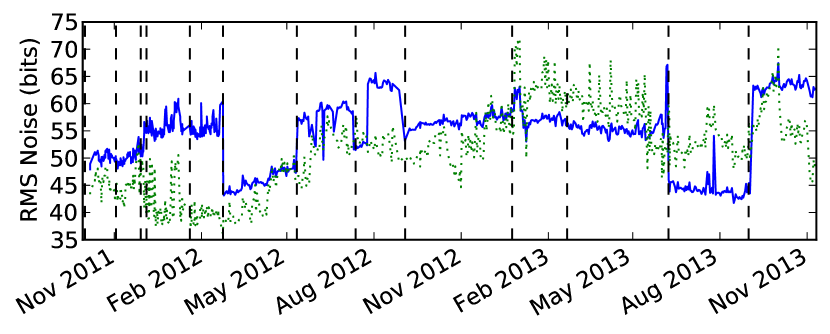
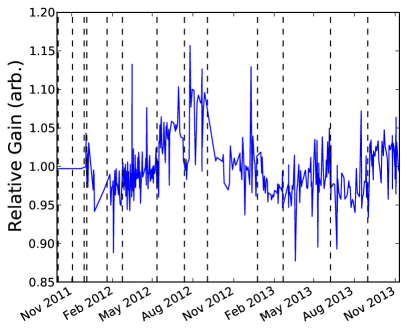
In figure 4 dashed lines indicate the start of each such interval. These boundaries are chosen at sudden changes in channel behavior due to known environmental changes (such as power outages, APD power cycling, temperature excursions, and changes to the electronics) and other observed sudden changes in behavior. Noise correlations are computed per interval, averaging over all noise events that pass cosmic-ray veto, timing coincidence, and other criteria for rejecting spurious events.
4.2 Scintillation Light Map
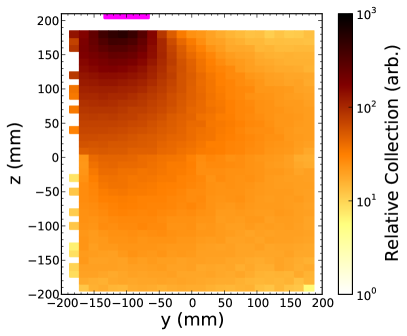
The second input is the ‘light map’ which, as described in eq. 3.7, characterizes the response of APD channel , for an event at position occurring on date . The position dependence arises primarily from geometric effects such as increased collection of the scintillation signal by the APDs nearest to the energy deposit. In certain regions, e.g. near edges of the detector, the majority of the light collection occurs on just a few APDs. Individual APD channel gains have been observed to drift appreciably on time scales of months. Sudden changes have been observed due to several specific modifications of the detector readout electronics and occasionally due to environmental fluctuations. The light map is determined empirically by measuring the signal pulse amplitudes observed from predominantly mono-energetic events.
The previous EXO-200 light map (used in [19]) characterized the summed APD response averaged over long periods. A light map for each individual channel requires substantially larger calibration statistics, per position-time bin, than the previous form because of the larger statistical fluctuations in the signal pulses observed on individual channels. Also, individual APD channel gains drift less gradually than the average gain of an APD plane, and near the edges of the detector the light collection of an individual APD channel has greater dependence on the origin of the photons than the light collection of an entire APD plane. Thus, finer light map binning, in both time and space, is required.
The are determined from 228Th calibration events associated with the prominent spectral line. The entire EXO-200 228Th calibration data set is used, providing more than total detector triggers. However, these statistics are insufficient to directly generate the full four-dimensional per-channel light map required for de-noising. To proceed, APD channel responses are assumed separable:
| (4.1) |
where the position-dependent response depends only on the light collection geometry and represents how likely it is for a photon emitted isotropically at to collect on the channel, which is constant in time, while the time-dependent response accounts for variations in the APD gain with time, which is independent of the position of the event. This separability should be valid for a single APD, and any deviations from full separability, due to variations of the gains within each APD gang or changes in detector geometry over time, are assumed to be negligible.
The light map is determined from the response to full-absorption SS events. The selection of such events is an iterative process since the light map itself must be used for the best estimate of event energy. Events are first selected based on the energy determined from charge information only. An initial light map is then generated, and used to determine an improved energy estimate for each event. The final light map is then determined after re-selecting events associated with the peak. Further iterations were not found to substantially alter the light map.
The position dependence of the light map is determined by binning the data into voxels666The short dimension is parallel to the axis of the detector, and is reconstructed by the time delay between light and charge collection. and linearly interpolating between voxel centers. The time dependence of the light map is measured for each 228Th calibration with sufficiently high statistics and linearly interpolated between them. Figure 5 shows the spatial and temporal dependence of the light map for a typical APD gang.
4.3 Scintillation Noise Model
The third input to de-noising characterizes fluctuations in signal pulse amplitudes. The readout process from an energy deposit is inherently noisy, since the number of photons reaching each APD channel, and the collection and amplification efficiencies of the APDs vary from event to event. In this section, we discuss the expectation value of , which reflects the variances and covariances of the signal pulse amplitudes from a fixed energy deposit (not considering additive noise). Like the light map, these covariances could be characterized empirically from additional calibration data, but this is infeasible in practice due to limited statistics. The following describes a physical model for calculating the desired variances and covariances. This model is found to be sufficiently accurate for de-noising EXO-200 waveforms.
Let represent the number of photons produced by an event. Simulations using NEST [20] of the 228Th give at the bulk field in EXO-200. The physical processes of photon collection and conversion into a digitized signal pulse amplitude introduce several sources of error.
Let be the number of photons collected on APDs of channel . is a random variable that depends on the position of the event.777 is assumed to be constant over time, as discussed in section 4.2. Assuming its expectation value is proportional to :
| (4.2) |
This collection can be modeled by a multinomial distribution; each photon is collected by at most one APD channel and the distribution of photon destinations are independent and identically distributed. This yields the second-order expectation value
| (4.3) |
Considering the statistical properties of the APDs, described in detail in [13], photons collected on an APD channel produce an output of electrons that has the following first- and second-order characteristics:
| (4.4a) | ||||
| (4.4b) | ||||
where:
-
is the time-dependent mean internal gain of the APDs associated with channel . This is directly proportional to the measured as described in section 4.2.
-
is the mean number of electron-hole pairs generated in the active layer of an APD, 1.7. Incident Xe scintillation photons require per pair created in silicon at room temperature [21]; at , there is a 1.6% increase due to temperature dependence [22], but this is less than the error on the measurement.
-
is the Fano factor of silicon, [22].
-
quantifies the variance of the internal gain experienced by electron-hole pairs due to the physical avalanche process, [13].
-
quantifies variance of the mean internal gain due to the non-uniformity of the APD channel response (e.g. location of amplification within an APD, distribution of collection on APDs within a gang, angle of incidence), which is not alleviated by higher photon statistics. Due to a lack of available data, we fix , but retain it symbolically for reference.
Finally, the current output from the APD channels is amplified by standard electronics and digitized. This process, assumed to be noise-free, multiplies a current pulse of electrons by a time-dependent factor , producing a digitized pulse of magnitude :
| (4.5) |
Combining these processes, with , we arrive at the expectation values
| (4.6a) | ||||
| (4.6d) | ||||
An interesting feature of eq. 4.6d is its dependence on the energy , which is our goal to estimate, reflecting the fact that shot noise (unlike additive noise) is energy-dependent and that de-noising may prefer different noise trade-offs depending on the energy of an event. At first, this would seem to indicate a circular dependency. However, charge-only data can be used as an independent estimate of energy to cue de-noising with an appropriate estimate of . The estimator is still guaranteed to be unbiased, and any discrepancy in will only make the estimate less accurate. If this approach is inadequate, it is also possible to iteratively refine the estimate of based on the de-noised estimate of , and repeat the de-noising technique.
5 Resolution Improvement
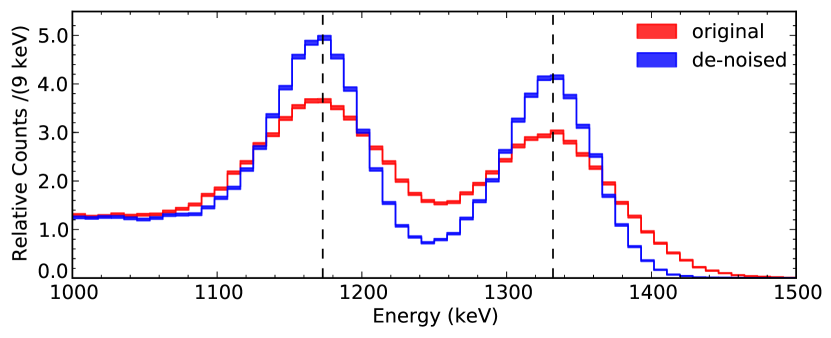
EXO-200 determines its energy estimate for an event through a linear combination of its scintillation and ionization energy estimates [19]. De-noising improves the scintillation energy estimate. This directly improves this combined energy estimate, and also allows for an increase in the weight of the scintillation channel in calculating the combination, which again improves the estimate. Here we discuss some ways in which de-noising has improved this combined energy estimate. A comparison of 60Co source data with and without de-noising in figure 6 shows this improvement.
5.1 Time Independence
Recall (cf. figure 4) that the noise on the APD planes varied considerably over time. Prior to de-noising, this resulted in a pronounced time dependence of the energy resolution. De-noising removes much of this time dependence in two main ways. First by heavily weighting few channels in each event and leveraging noise correlations between channels, the overall contribution of the additive noise is reduced (and the time dependence it causes). Second as the weightings are performed per event, de-noising dynamically makes the trade-off between additive noise and photon statistics. Thus the more additive noise increases, the more de-noising works to suppress its impact.
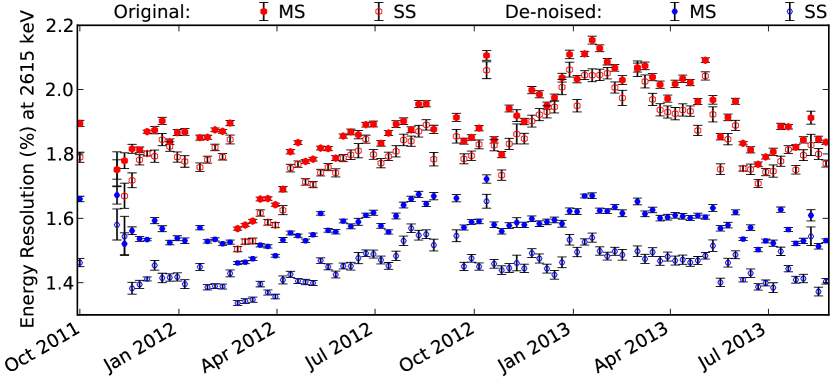
In determining the total effective detector energy resolution, the weekly total energy resolution is first measured for the 228Th source calibrations by combining the ionization and scintillation responses. These weekly resolution measurements are shown in figure 7, where the total SS and MS energy resolution of the 208Tl full-absorption peak ( ) without (original) and with de-noising applied are compared.
5.2 Improved Energy Spectra
| (keV) | () | (1e-3) | (%) | ||
|---|---|---|---|---|---|
| original | MS | ||||
| SS | |||||
| de-noised | MS | ||||
| SS |
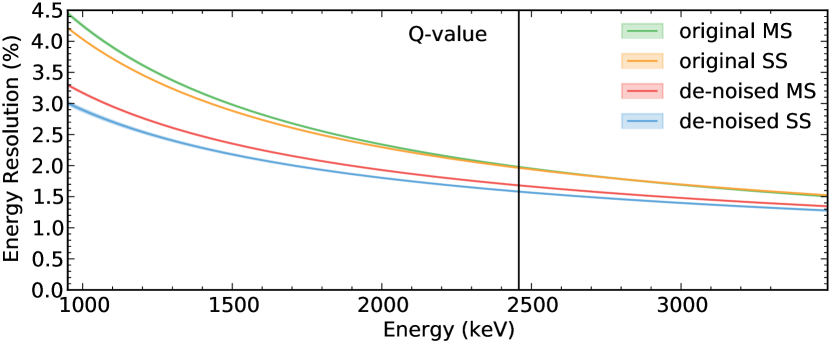
The effective resolution takes the form , where accounts for additive noise that is dominated by APD electronics noise contributions, and and account for statistical fluctuations and position- and time-dependent broadening. To determine the resolution, calibration data are fit to simulated energy spectra produced using the Geant4-based EXO-200 Monte Carlo simulation software (see [19]). 137Cs, 60Co, 226Ra, and 228Th sources are used for this calibration data. These sources provide prominent spectral features throughout the 1– range shown in figure 8. Table 1 compares the fitted parameters for the de-noised and original data. Parameter errors were determined by inverting the matrix of second order derivatives around the best fit values and are also reported in Table 1. This method provides only an approximation of the parameter errors due to the presence of strong correlations and the best fit value for parameter occurring near a physical boundary. Errors on the resolution at the Q-value were propagated using the full covariance matrix from the fit.
Before de-noising, the effective resolution for SS (MS) at the Q-value is % (%). After de-noising, the effective resolution for SS (MS) at the Q-value is % (%). These fits, performed with improved Monte Carlo which considers the full spectral shape of the sources rather than selected peaks, are consistent with those reported in [6]. Reducing the correlated noise on the scintillation channel with de-noising has decreased by one third. The other parameters are not significantly impacted by de-noising. has the greatest effect on the relative resolution at lower energies.
6 Future Work
The current de-noising technique is most developed for SS events and not optimized for MS events. Future work will focus on exploring alternative approaches to MS events which are identified in this section.
The current approach to MS events depends on an approximate extension of the light map (eq. 3.13). This approximation could generate a biased energy estimator. This bias can be eliminated by replacing the SS bias-free constraint of eq. 3.9i with a stronger MS version:
| (6.1) |
where indexes deposition sites. Such stronger constraints will increase the expected estimator variance, but the benefit is that the estimator is guaranteed to be bias-free regardless of the distribution of energy between deposits or any error in the approximate light map extension of eq. 3.13.
Beyond total scintillation energy, it is also possible to define estimators for the scintillation energies of individual deposits. This approach is similar to the technique for multievent frames described in section 3.4, in which eq. 3.12 is used to place nulls between deposits rather than events. However, the problem is more difficult because MS event deposits can only be differentiated by the positions of their deposits by taking advantage of the detailed light map described in section 4.2 whereas multievent frames could also use differences in scintillation timing.
The scintillation-only energy resolution of each deposition site so obtained may be poor because they can only be distinguished by the pattern of their photon deposits across channels. Nonetheless, any anti-correlated deposit energy able to take advantage of ionization and scintillation anti-correlation would be an improvement over using the charge energy alone, as current analyses do. In a analysis this information would primarily serve to constrain background rates, which are already well-constrained by existing physics analyses, so the expected benefit is marginal. However this improved energy resolution of individual deposition sites would improve sensitivity in searches utilizing individual interactions within an MS event such as the de-excitation s produced in decays to excited states of the 136Ba daughter nucleus (see [23]).
The ability to assign scintillation energy to deposition sites within an event would also be useful to better understand the detector and fit backgrounds. In particular, differences between the light yield from s and s could be studied using e+– e- pair production from calibration sources. Also, the ability to use MS events for light map construction would reduce the impact of source calibration on detector livetime. Finally, the light map may be further improved in such a case of limited statistics by moving to an unbinned technique.
7 Conclusions
We have demonstrated a technique, de-noising, to create an optimal energy estimator that is robust against correlated noise for simultaneous signals on all channels. After applying this technique to existing EXO-200 data, the resolution at the Q-value of was improved from % to % for point like charge depositions such as events. Future development of this technique may allow the scintillation energy of each interaction to be determined for events depositing energy at multiple locations in the detector. This technique can also be generalized to other experiments that measure signals using many readout channels that suffer from correlated noise components or substantial variation in time or space of the response measured on each channel.
Acknowledgments
EXO-200 is supported by DOE and NSF in the United States, NSERC in Canada, SNF in Switzerland, IBS in Korea, RFBR-14-22-03028 in Russia, DFG Cluster of Excellence “Universe” in Germany, and CAS-IHEP Fund and ISTCP (2015DFG02000) in China. EXO-200 data analysis and simulation uses resources of the National Energy Research Scientific Computing Center (NERSC), which is supported by the Office of Science of the U.S. Department of Energy under Contract No. DE-AC02-05CH11231. We gratefully acknowledge the KARMEN collaboration for supplying the cosmic-ray veto detectors, and the WIPP for their hospitality.
References
- [1] A. Giuliani and A. Poves, Neutrinoless Double-Beta Decay, Adv. High Energy Phys. (2012) 857016.
- [2] O. Cremonesi and M. Pavan, Challenges in Double Beta Decay, Adv. High Energy Phys. (2014) 951432, [1310.4692].
- [3] A. S. Barabash, Double beta decay experiments: current status and prospects, Phys. Usp. 57 (2014) 482.
- [4] S. Dell’Oro et al., Neutrinoless double beta decay: 2015 review, 1601.07512.
- [5] Particle Data Group collaboration, K. A. Olive et al., Review of Particle Physics, Chin. Phys. C38 (2014) 090001.
- [6] EXO-200 collaboration, J. B. Albert et al., Search for Majorana neutrinos with the first two years of EXO-200 data, Nature 510 (2014) 229, [1402.6956].
- [7] E. Conti et al., Correlated fluctuations between luminescence and ionization in liquid xenon, Phys. Rev. B68 (2003) 054201, [hep-ex/0303008].
- [8] C. Mancini-Terracciano and M. Vignati, Noise correlation and decorrelation in arrays of bolometric detectors, JINST 7 (2012) P06013, [1203.1782].
- [9] J. Ouellet, The Search for Neutrinoless Double Beta Decay with 130Te with CUORE-0. PhD thesis, University of California, Berkeley, 2015. doi:10.2172/1236178.
- [10] A. D. Bryant, A Search for Neutrinoless Double Beta Decay of Te-130. PhD thesis, University of California, Berkeley, 2010. http://www.escholarship.org/uc/item/5th3f67z.
- [11] EXO-200 collaboration, M. Auger et al., The EXO-200 detector, part I: Detector design and construction, JINST 7 (2012) P05010, [1202.2192].
- [12] M. Redshaw et al., Mass and double-beta-decay Q value of Xe-136, Phys. Rev. Lett. 98 (2007) 053003.
- [13] EXO-200 collaboration, R. Neilson et al., Characterization of large area APDs for the EXO-200 detector, Nucl. Instrum. Meth. A608 (2009) 68, [0906.2499].
- [14] Advanced Photonix, API product # SD630-70-75-500, http://www.advancedphotonix.com/wp-content/uploads/SD630-70-75-500.pdf.
- [15] C. G. Davis, A Search for the Neutrinoless Double Beta Decay of Xenon-136 with Improved Sensitivity from Denoising. PhD thesis, University of Maryland, College Park, 2014. http://hdl.handle.net/1903/15242.
- [16] A. El Guennouni et al., A block version of BiCGSTAB for linear systems with multiple right-hand sides, Electron. Trans. Numer. Anal. 16 (2003) 129. http://www.emis.ams.org/journals/ETNA/.
- [17] EXO-200 collaboration, J. B. Albert et al., Measurements of the ion fraction and mobility of - and -decay products in liquid xenon using the EXO-200 detector, Phys. Rev. C92 (2015) 045504, [1506.00317].
- [18] EXO-200 collaboration, J. B. Albert et al., Cosmogenic Backgrounds to in EXO-200, JCAP 2016 (2016) 029, [1512.06835].
- [19] EXO-200 collaboration, J. B. Albert et al., Improved measurement of the half-life of 136Xe with the EXO-200 detector, Phys. Rev. C89 (2014) 015502, [1306.6106].
- [20] M. Szydagis et al., NEST: A Comprehensive Model for Scintillation Yield in Liquid Xenon, JINST 6 (2011) P10002, [1106.1613].
- [21] F. Scholze et al., Determination of the electron–hole pair creation energy for semiconductors from the spectral responsivity of photodiodes, Nucl. Instrum. Meth. A 439 (2000) 208.
- [22] B. Lowe and R. Sareen, A measurement of the electron–hole pair creation energy and the fano factor in silicon for 5.9 keV X-rays and their temperature dependence in the range 80–270 K, Nucl. Instrum. Meth. A 576 (2007) 367.
- [23] EXO-200 collaboration, J. B. Albert et al., Search for decay of 136Xe to the 0 excited state of 136Ba with EXO-200, Phys. Rev. C93 (2016) 035501, [1511.04770].