Shapley Supercluster Survey: Ram-Pressure Stripping vs. Tidal Interactions in the Shapley Supercluster ††thanks: Based on data collected with i) WiFeS at the 2.3m telescope of the Australian National University at Siding Spring (Australia) and ii) OmegaCAM at the ESO INAF - VLT Survey Telescope and VIRCAM at VISTA, both at the European Southern Observatory, Chile (ESO Programmes 088.A-4008, 089.A-0095, 090.A-0094, 091.A-0050, 093.A-0465).
Abstract
We present two new examples of galaxies undergoing transformation in the Shapley supercluster core. These low-mass (M⊙) galaxies are members of the two clusters SC 1329-313 () and SC 1327-312 (). Integral-field spectroscopy complemented by imaging in bands and in H narrow-band are used to disentangle the effects of tidal interaction (TI) and ram-pressure stripping (RPS). In both galaxies, SOS 61086 and SOS 90630, we observe one-sided extraplanar ionised gas extending respectively kpc and kpc in projection from their disks. The galaxies’ gaseous disks are truncated and the kinematics of the stellar and gas components are decoupled, supporting the RPS scenario. The emission of the ionised gas extends in the direction of a possible companion for both galaxies suggesting a TI. The overall gas velocity field of SOS 61086 is reproduced by ad hoc N-body/hydrodynamical simulations of RPS acting almost face-on and starting Myr ago, consistent with the age of the young stellar populations. A link between the observed gas stripping and the cluster-cluster interaction experienced by SC 1329-313 and A 3562 is suggested. Simulations of ram pressure acting almost edge-on are able to fully reproduce the gas velocity field of SOS 90630, but cannot at the same time reproduce the extended tail of outflowing gas. This suggests that an additional disturbance from a TI is required. This study adds a piece of evidence that RPS may take place in different environments with different impacts and witnesses the possible effect of cluster-cluster merger on RPS.
keywords:
galaxies: evolution – galaxies: clusters: general – galaxies: clusters: individual: SC 1327-312, SC 1329-313 – galaxies: photometry – galaxies: stellar contents1 Introduction
The evolution of galaxies depends both on their intrinsic properties, such as their mass, and external ‘accidents’ in which the galaxies are randomly involved during their life. These external events include tidal interactions, galaxy mergers, ram-pressure and viscous stripping, evaporation and ‘starvation’ (Toomre & Toomre, 1972; Moore et al., 1996; Byrd & Valtonen, 1990; Barnes & Hernquist, 1991; Bekki, 2001; Gunn & Gott, 1972; Nulsen, 1982; Cowie & Songalia, 1977; Larson et al., 1980). Together, these events serve to transform galaxies by disturbing their kinematics, depleting their reservoirs of gas, and so quenching star formation. The time-scales and efficiencies of such mechanisms are different and depend on both the properties of the galaxies and on their environment (for a review see Boselli & Gavazzi, 2006). In particular, within the crowded and dense environments of galaxy clusters and groups, the probability that hydrodynamical events transform galaxies increases significantly. This may serve to explain the origin of the different galaxy populations observed in clusters and field in the local Universe (e.g. Dressler, 1980; Lewis et al., 2002; Bamford et al., 2009).
In this work we investigate the possibility of disentangling two mechanisms which have been invoked as main drivers in transforming spiral galaxies into S0s and dEs: ram-pressure stripping (RPS, Gunn & Gott, 1972; Abadi et al., 1999) and galaxy-galaxy tidal interactions (TIs, Toomre & Toomre, 1972; Moore et al., 1996).
Galaxies orbiting into a cluster feel the ram pressure exerted by the hot and dense intracluster medium (ICM) which can effectively remove the cooler interstellar medium (ISM) in the galaxy starting from outside and thus quenching star formation in the ram-pressure stripped regions. The time-scales for RPS is about one cluster crossing time ( yr). As emphasised by Gunn & Gott (1972) this cluster-specific mechanism efficiently depletes the gas of massive spiral galaxies only within the cluster cores where the dense ICM is expected to be located. However, the effects of ram pressure depend on both galaxy and ICM properties and may easily extend to poorer environments for low-mass galaxies (Marcolini et al., 2003), and not only for them. Using hydrodynamical cosmological simulations, Bahé et al. (2013) investigated the increase of gas content and star formation in cluster galaxies with the clustercentric distance. They found that this observed large-scale trend, approaching the values of the field galaxy sample only at , can be explained by a combination of i) pre-processing’ of galaxies within infalling groups; ii) ‘overshooting’ for those galaxies that are not falling in for the first time; and iii) ram-pressure stripping. Simulations of ongoing RPS show that such a mechanism not only severely truncates the gas disk of galaxies in high-density environments, but also in low-density environments, where moderate ram pressures are foreseen, their gas disk may be disturbed and bent (Roediger & Hensler, 2005). Observations of special events of gas stripping confirmed that RPS is acting more efficiently than previously postulated by Gunn & Gott (1972), playing a role also outside the cluster cores (e.g. Chung et al., 2007; Merluzzi et al., 2013).
Ram pressure may also compress and shock the ISM, temporarily enhancing the star formation in the inner disk as well as in the stripped gas (Byrd & Valtonen, 1990; Fujita & Nagashima, 1999; Tonnesen & Bryan, 2012; Bekki, 2014). These effects are observed in a few cases (Merluzzi et al., 2013; Kenney et al., 2014; Ebeling et al., 2014). Since it is highly effective in quenching the star formation, RPS is also considered to be one of the most important processes, although not the only one, to convert spirals and irregulars into S0 and spheroidal galaxies (see Kormendy & Bender, 2012).
| Property | SOS 61086 | SOS 61087 | SOS 90630 | SOS 90090 |
|---|---|---|---|---|
| Coordinates | ||||
| ShaSS1 | 13 31 59.80 -31 49 22.2 | 13 31 59.85 -31 49 04.0 | 13 29 28.53 -31 39 25.6 | 13 29 23.43 -31 39 51.7 |
| Magnitudes/fluxes | ||||
| 17.810.03 | 20.060.03 | 17.410.03 | 17.580.03 | |
| 16.620.03 | 18.360.03 | 16.390.03 | 15.600.03 | |
| 16.300.03 | 17.440.03 | 16.060.03 | 14.700.03 | |
| 16.230.03 | 17.230.03 | 15.960.03 | 14.430.03 | |
| 24m2 | 4007222 Jy | 11013573 Jy | 3136180 Jy | |
| 1.4GHz3 | 0.89 mJy | 2.30 mJy | ||
| Masses | ||||
| stellar mass4 | M⊙ | M⊙ | M⊙ | M⊙ |
| total halo mass4 | M⊙ | M⊙ | M⊙ | M⊙ |
| Distances | ||||
| redshift1 | 0.042610.00023 | 0.043670.00031 | 0.048170.00042 | 0.049290.00022 |
| heliocentric velocity1 | 1250269 km s-1 | 1280693 km s-1 | 14093 km s-1 | 1441366 km s-1 |
| projected distance4 | 282 kpc | 226 kpc | ||
| to the parent cluster centre | ||||
| Star formation rates | ||||
| UV+IR global SFR2 | 1.4 M⊙yr-1 | 2.5 M⊙yr-1 | 0.5 M⊙yr-1 | |
| H global SFR4 | M⊙yr-1 | M⊙yr-1 |
A counter-argument to this hypothesis is that S0s differ from normal spirals by their higher bulge luminosities rather than simply having fainter disks (Christlein & Zabludoff, 2004) and this is not explained with the RPS or starvation mechanisms. Other mechanisms such as TIs (merging, fly-bys; Toomre & Toomre, 1972) and harassment (which is also a TI in a wider sense; Moore et al., 1996) are better capable of channelling material onto a central bulge, sufficient to produce the higher central mass densities seen in cluster spirals and ultimately the stellar phase densities found in S0s (Moran et al., 2007). In general, TIs gravitationally perturb the gas and stellar components, trigger central starbursts and strip stars and gas from the disk of the involved spiral galaxies producing tails and bridges (see Toomre & Toomre, 1972; Larson & Tinsley, 1978; Kennicutt & Keel, 1984; Keel et al., 1985; Barnes & Hernquist, 1991, 1992, 1996; Woods et al., 2006).
In cluster environments, due to the high relative velocities of the colliding galaxies, TI time-scales are shorter (yr) than in the field, and a single passage may only marginally affect the dynamics of their stellar populations. The geometry of the encounter and the relative galaxy properties are important parameters in determining the size of the dynamical perturbation. Multiple encounters (harassment) – which are of course more common in clusters – are probably necessary to substantially perturb the stellar content.
The presence of both gas and stars outside the galaxy disk may arise from either RPS or through TIs. Although each mechanism will produce distinctive distributions in the extraplanar gas and stars, it may be not straightforward to distinguish which process is acting on a particular galaxy because projection effects may mask the geometries of the outflowing matter (e.g Bournaud et al., 2004; Roediger & Brüggen, 2006). The internal kinematics can help to distinguish between these mechanisms; while the gas component suffers the ram pressure which is able to modify its velocity field, the stellar kinematics will be affected only in case of TIs.
Most, if not all, these observables are transient phenomena. After Gyr the ‘memory’ of either the RPS or TI is washed out (see Kronberger et al., 2006; Oh et al., 2008). The permanent results are i) the star-formation quenching, achieved with both mechanisms, although on different time-scales; ii) the truncation of the gaseous disks by RPS; iii) the structural modification by TIs. Each galaxy can be involved in different ‘accidents’ across cosmic time, making it extremely difficult to understand which mechanism really prevails in transforming the star-forming disk galaxies accreted from the field into the S0 and dE populations which now dominate cluster cores.
To address the challenge of understanding the physics of galaxy transformations, we need integral-field spectroscopy (IFS). IFS allows us to resolve the different spatial components in the galaxies, and so measure the dynamical disturbance of the stellar component, discover disturbed gas velocity fields, determine the local enhancement and spatial trend of the star formation, and to use chemical abundance analysis to identify the source of the extraplanar gas.
With this in mind, we have undertaken IFS observations with WiFeS (Dopita et al., 2007, 2010) of a small but carefully selected galaxy sample in the Shapley supercluster core (SSCC), drawn from the Shapley Supercluster Survey (ShaSS Merluzzi et al., 2015) which aims to investigate the role of the mass assembly on galaxy evolution. It covers 23 deg2 centred on the SSCC with ESO-VST and ESO-VISTA -band imaging. The Shapley supercluster is located at a redshift , and represents the most dynamically-active and dense structure in the local Universe. Thus, the probability to observe evidence of environmental effects on galaxy evolution is dramatically enhanced. The targets for the IFS have been selected from the spectroscopic catalogue of ShaSS which is 80 per cent complete down to (m⋆+3). All these galaxies are supercluster members, resolved in the optical images and display i) disturbed morphologies, such as asymmetry and tails; ii) hints of extraplanar emission; iii) evidence of star-forming knots. About 80 galaxies satisfy at least two of these properties. After this visual selection the galaxies are targeted with a 45-minute exposures of WiFeS which allow to ascertain which of them actually present extraplanar emission and then become the high-priority targets in our investigation. At present 17 supercluster galaxies have been observed. They belong to different environments, from dense cluster cores to the regions where cluster-cluster interactions are taking place, and out to the much less populated areas.
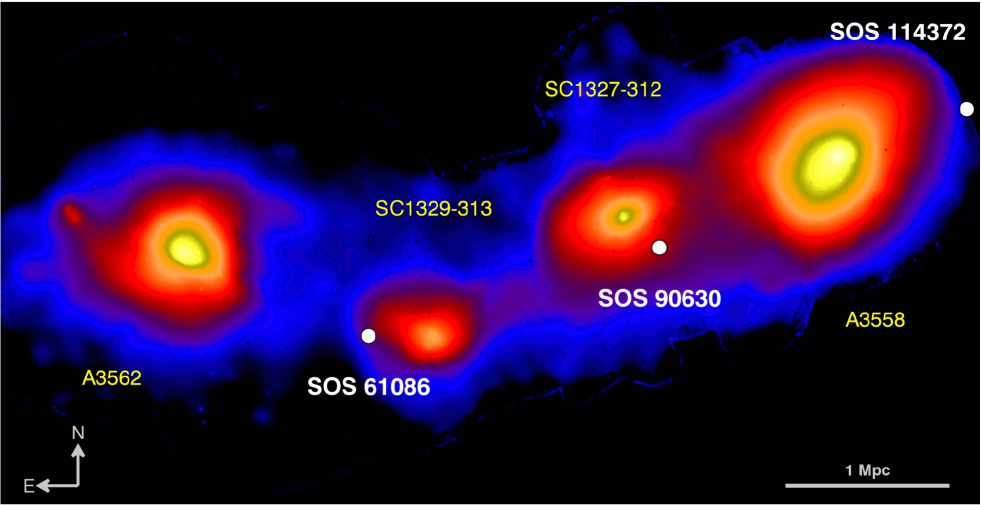
In our first study (Merluzzi et al., 2013) we identified a bright (LL⋆) barred spiral galaxy (SOS 114372) 1 Mpc from the centre of the rich cluster A 3558 in the SSCC, which is being affected by RPS. IFS observations revealed ongoing gas stripping in the form of one-sided extraplanar ionised gas along the full extent of the disk, simultaneously with a starburst triggered by gas compression along the leading edge of the galaxy. The galaxy is subjected to weak-moderate ram pressure, as defined by Roediger & Hensler (2005). This adds a piece of evidence to the fact that RPS is acting more efficiently on the galaxy ISM than previously foreseen and also outside of the cluster cores, as also observed in the Virgo cluster by Chung et al. (2009). This is possibly the principal transformation process quenching star formation (SF) in spirals, although certainly it is helped by other processes affecting the structure of the galaxies.
In this work we present the results for the galaxies SOS 61086 and SOS 90630. These two galaxies are 2.9 and 2.3 -band magnitudes fainter with respect to SOS 114372 allowing us to extend the investigation of the environmental effects to a lower stellar mass range, but also to investigate different environments, since both are members of low-mass clusters (M⊙) involved in interactions.
In Sect. 2 the main properties of the targets are presented. Observations and data reduction are described in Sects. 3 and 4. The data analysis is summarized in Sect.5. The results are given in Sects. 6 and 7 for the two galaxies. In Sect. 8, we discuss the possible origins of the observed extraplanar gas and in Sec. 9 we compare the observed gas velocity field with those derived from hydrodynamical simulations and discuss possible drivers for the observed transformations. Our conclusions are summarized in Sec 10.
Throughout the paper, and in common with the other papers of this series, we adopt a cosmology with =0.3, = 0.7, and H0=70 km s-1Mpc-1. According to this cosmology 1 arcsesc corresponds to 0.880 kpc at =0.0447 (SC 1329-313) and 0.966 kpc at =0.0493 (SC 1327-312) . Velocities and velocity dispersions are given accounting for the relativistic correction.
2 The galaxies
The galaxies SOS 61086 and SOS 90630, named following the Shapley Optical Survey (SOS) identification111In the Shapley supercluster survey (ShaSS, Merluzzi et al., 2015) they correspond to the galaxies ShaSS403015754 and ShaSS408053848, respectively (Mercurio et al., 2015). (Mercurio et al., 2006; Haines et al., 2006), are spiral galaxies respectively 2.7 and 2.1 magnitudes fainter than m⋆ in band (=11.7 at the supercluster redshift, Merluzzi et al., 2010) and with stellar masses M⊙ and M⊙. Both lie in poor cluster environments, as indicated in Fig. 1 (white dots) relative to the SSCC as traced by the X-ray surface brightness derived by XMM-Newton images in the 0.5-2.5 keV energy band (see Sect. 8.3.1).
2.1 SOS 61086
This galaxy has a redshift =0.04261 ( km s-1) and is located at 282 kpc in projection from the X-ray centre of the cluster SC 1329-313 (M⊙, Ragone et al. 2006) in the SSCC. SC 1329-313 forms a well-defined, distinct structure both spatially and in velocity space. The distribution of galaxies and the X-ray emission are both elongated along the ENE direction towards Abell 3562 (see also Finoguenov et al., 2004; Giacintucci et al., 2005). By analysing the caustic diagram of the ShaSS spectroscopic sample (Haines et al., in preparation), we determine its mean recession velocity of 13114 km s-1 (), with a velocity dispersion of just km s-1, based on 55 member galaxies within (0.86 Mpc, see also Bardelli et al. 1998). Both dominant elliptical galaxies have very similar recession velocities (12807 and 12758 km s-1), which are 300-350 km s-1 lower than the mean. This suggests that the line-of-sight (LOS) peculiar velocity of SOS 61086 with respect to the main group is about -600 km s-1.
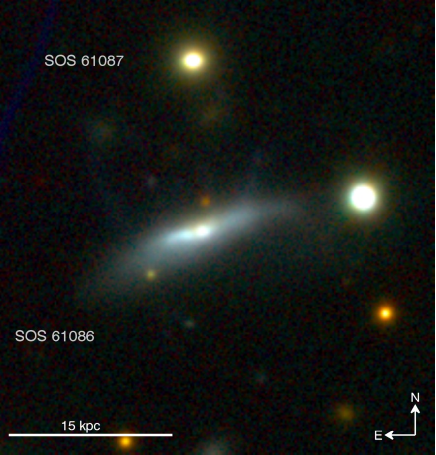
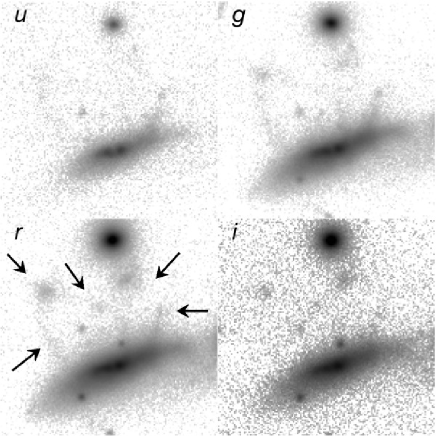
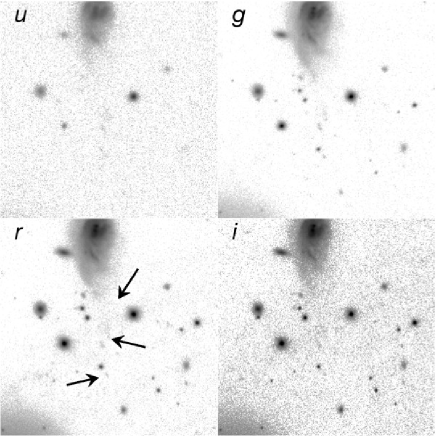
A composite image of the galaxy, derived from the optical imaging of ShaSS, is shown in Fig. 2. The pixel scale of the imaging is 0.214 arcsec/pxl with a seeing less than 0.8 arcsec in bands and arcsec in band. Fig. 2 shows SOS 61086 in the field centre and another cluster member, SOS 61087, at about 17 kpc to the North. The bright source to the right of SOS 61086 is a star. Fig. 3 shows part of the field of Fig. 2 in the four VST bands . It focuses on the area where hints of extraplanar material are present (highlighted by the arrows in the r-band image). These figures show hints of matter beyond the stellar disk in the northerly direction with respect to SOS 61086. In particular, two faint filaments leading NW and NE from the disk few kiloparsecs in projection from the galaxy centre. The extraplanar emission seems to form a fan-like structure bordered by the two filaments. Two faint clumps located NW and NE with respect to the galaxy centre and out of the disk can be also distinguished. It is not clear if these clumps are associated to the galaxy, the NW one being redder with respect to the main galaxy body. It is interesting to notice that although some of these extraplanar features may be very faint, most of them are present at all wavebands.
SOS 61086 is a disk galaxy seen almost edge-on showing some distortion in the optical images. This is most probably due to an irregular distribution of dust, since in band the galaxy looks much more symmetrical (see Sect. 6.3).
SOS 61086 could be affected by the presence of the close companion galaxy SOS 61087. The redshift of this neighbour is , implying a LOS velocity of +304 km s-1 relative to SOS 61086. While this companion galaxy appears much more compact than SOS 61086, its estimated stellar mass is 1.3 higher.
The main properties of SOS 61086 and SOS 61087 are listed in Table 1. The Kron magnitudes in the table are corrected for Galactic extinction following Schlafly & Finkbeiner (2011).
From the ultra-violet (UV) and mid-infrared (mid-IR) fluxes we estimate a global star formation rate SFR=1.40 M⊙yr-1 (of which 47% is obscured, Haines et al., 2011). For the stellar mass we adopted the calibration of the GAMA survey (Taylor et al., 2011). For the characterization of the dark matter halos we adopted the models by Di Cintio et al. (2014), which account for the dependence of the halo properties on the central galaxy (eq. 1 of Di Cintio et al., 2014).
2.2 SOS 90630
SOS 90630, at redshift =0.04817 ( km s-1), is located at 226 kpc in projection from the X-ray centre of the cluster SC 1327-312 (M⊙, Ragone et al. 2006) in the SSCC (see Sect. 8). The centre of SC1327-312 is well defined with the peak of X-ray emission coinciding with a bright elliptical galaxy (6dF J1329477-313625, , km s-1). The central velocity of the group is slightly lower at 14429 km s-1 () and the velocity dispersion is km s-1. This suggests a LOS peculiar velocity of SOS 90630 with respect to the main group of about -300 km s-1.
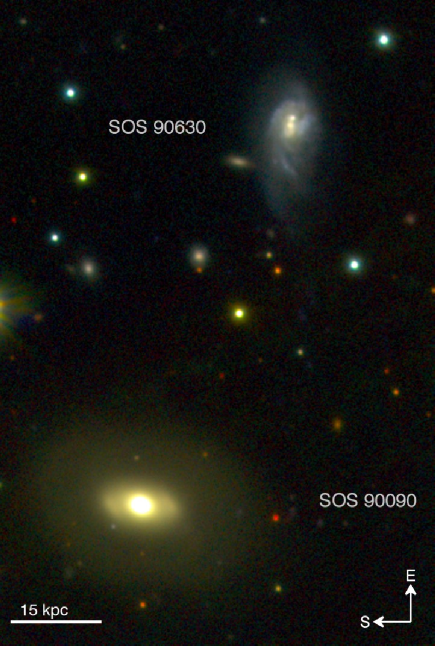
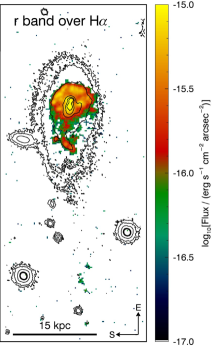
The composite VST image in Fig. 4 was derived from images with seeing 0.6 arcsec in bands and 0.5 arcsec in band. The light distribution of SOS 90630 is highly asymmetric with a prominent western arm in the direction where the disk seems more extended. Star-formation knots and dust obscured regions are found in the centre. Hints of matter flowing out of SOS 90630 towards West are visible in Fig. 5 in all bands.
The main properties of SOS 90630 and SOS 90090 are listed in Table 1. For SOS 90630 we measured a global SFR=2.50 M⊙yr-1 (of which 74% is obscured; Haines et al., 2011). SOS 90090 has a 5 lower SFR and 4.6 higher stellar mass (see Table 1). Using the same parametrizations as for SOS 61086, we estimate the stellar mass and mass halo of SOS 90630 listed in Table 1.
We notice that in the optical () images SOS 90630 presents two peaks of brightness in the centre, but this is due to dust absorption as demonstrated in Appendix A and Sect. 7.
3 Integral-field spectroscopy
The IFS data of SOS 61086 and SOS 90630 were obtained during two observing runs in April 2011 and April 2012 using the Wide-Field Spectrograph (WiFeS Dopita et al., 2007, 2010) mounted at the Nasmyth focus of the Australian National University 2.3m telescope located at the Siding Spring Observatory, Australia. WiFeS is an image-slicing integral-field spectrograph that records optical spectra over a contiguous 25′′ 38′′ field-of-view. This field is divided into twenty-five 1′′-wide long-slits (‘slices’) of 3 length. WiFeS has two independent channels for the blue and the red wavelength ranges. We used the B3000 and R3000 gratings, allowing simultaneous observations of the spectral range from 3300 Å to 9300 Å with an average resolution of R=2900. For further details on the WiFeS instrument see Dopita et al. (2007, 2010).
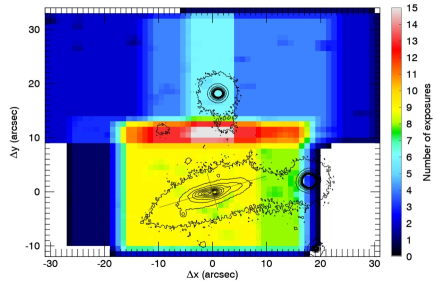
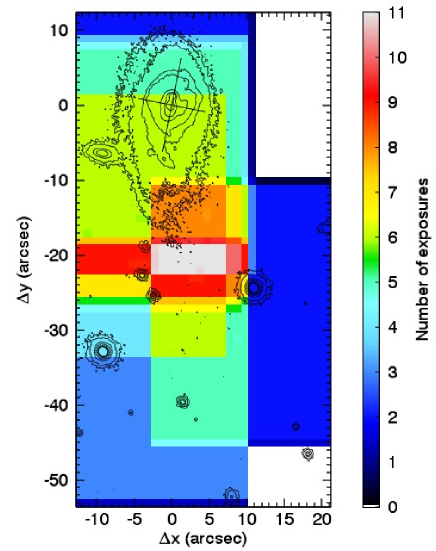
To cover the galaxies and their surroundings at sufficient depth, we obtained 15 and 11 pointings (45 min each) on SOS 61086 and SOS 90630, respectively. The coverage maps of the two galaxies are shown in Figs. 6 and 7. For each exposure on the target, we also acquired the spectrum of a nearby empty sky region with 22.5 min exposure to allow accurate sky subtraction.
We obtained spectra of spectrophotometric standard stars for flux calibration and B-type stars with nearly featureless spectra to determine the telluric correction. Arc and bias frames were also taken for each science exposure. Internal lamp flat fields and sky flats were taken twice during both runs.
The data were reduced using the WiFeS data reduction pipeline (Dopita et al., 2010) and purposely written FORTRAN and IDL222http://www.exelisvis.com/ProductsServices/IDL.aspx codes (for details see Merluzzi et al., 2013). The WiFeS pipeline performs all the steps from bias subtraction to the production of wavelength- and flux-calibrated data-cubes for each of the blue and red channels. The final spectral resolution achieved is km s-1, and is wavelength and position dependent. The accuracy of the wavelength calibration is 0.3 Å333This is the standard deviation of the difference between the observed wavelength and that predicted by the adopted dispersion relation, averaged over the 25x38 spectra of the datacubes.. The data-cubes were sampled at 1′′1′′1 Å and cover a useful wavelength range of 3800–8500 Å. The data-cubes were also corrected for atmospheric differential refraction. Sky subtraction was carried out by means of sky spectra taken closest in time to the galaxy spectra.
The co-addition of individual exposures/pointings was performed taking into account the instrumental spatial distortion as detailed in Merluzzi et al. (2013). The reduced data-cubes were corrected for Galactic extinction following Schlegel et al. (1998) and using the extinction curve by Cardelli et al. (1989) with RV=3.1. The sensitivity of our data is 0.510-17erg s-1cm-2 arcsec-2 at a signal-to-noise ratio SNR=5 for the H line, which is usually achieved with 6-8 exposures of 45 min each. Further details on data reduction are given in Merluzzi et al. (2013).
4 H imaging
H imaging of the galaxies SOS 61086 and SOS 90630 was obtained with the Maryland-Magellan Tunable Filter (MMTF; Veilleux et al., 2010) on the Magellan-Baade 6.5m telescope at the Las Campanas Observatory in Chile on 21 May 2012. The MMTF is based on a Fabry-Perot etalon, which provides a very narrow transmission bandpass (5–12Å) that can be tuned to any wavelength over 000–9200Å (Veilleux et al., 2010). Coupled with the exquisite image quality provided by active optics on Magellan and the Inamori-Magellan Areal Camera & Spectrograph (IMACS), this instrument is ideal for detecting extra-galactic H-emitting gas. The MMTF 6815-216 order-blocking filter with central wavelength of 6815Å and FWHM of 216Å was used to provide coverage of the H emission line for galaxies belonging to the Shapley supercluster (for details on the instrumental set-up see Merluzzi et al., 2013).
SOS 90630 was observed for 75 minutes in H ( s) and 30 minutes in the continuum, by shifting the central wavelength of the etalon 0Å bluewards to exclude emission from both the H line and the adjacent [Nii] lines, and into a wavelength region devoid of major skylines. SOS 61086 was observed for 45 minutes in H ( s) and 15 minutes in the continuum. The typical image resolution for these exposures was .
These data were fully reduced using the MMTF data reduction pipeline444http://www.astro.umd.edu/veilleux/mmtf/datared.html, which performs bias subtraction, flat fielding, sky-line removal, cosmic-ray removal, astrometric calibration and stacking of multiple exposures (see Veilleux et al., 2010). Photometric calibration was performed by comparing the narrow-band fluxes from continuum-dominated sources with their known -band magnitudes obtained from our existing SOS images. Conditions were photometric throughout and the error associated with our absolute photometric calibration is %. The effective bandpass of the Lorenzian profile of the tunable filter of FWHM is then used to convert the observed measurements into H fluxes in units of erg s-1 cm-2. The of the filter is sufficiently narrow that there should be little or no contamination from [Nii] emission.
The data were obtained in dark time resulting in very low sky background levels, with 1 surface brightness fluctuations within a 1 arcsec diameter aperture of erg s-1 cm-2Å-1 arcsec-2 implying a sensitivity of H imaging of 1.010-17 erg s-1 cm-2 arcsec-2 at SNR=5, somewhat less than for the sensitivity of the spectroscopy.
5 Data Analysis
In order to derive a robust estimate of the emission line fluxes the contribution of the stellar continuum must be identified and subtracted from the spectrum to leave the pure emission-line spectrum. The stellar continuum modelling, accounting for the dust extinction, also allows us to infer stellar population ages in different galaxy regions. The emission-line fluxes are used to estimate: i) the gas kinematics; ii) the line-ratio diagnostics; iii) the dust attenuation and SFR across the galaxy. Details of this analysis are given in Merluzzi et al. (2013), here we briefly summarize the different steps of the procedures.
5.1 Stellar continuum modeling and subtraction
Late-type galaxies present complex star formation histories with continuous bursts of star formation from the earliest epochs right up until the present day (Kennicutt, 1983; Kennicutt et al., 1994; James et al., 2008; Williams et al., 2011). We thus attempt to fit the stellar continuum of our target spiral galaxies as a linear combination of 40 simple stellar populations (SSPs) from the Vazdekis et al. (2010) stellar population models covering the full range of stellar ages (0.06–15 Gyr) and three different metallicities [M/H]=–0.41, 0.0, +0.22. The models assume a Kroupa (2001) initial mass function (IMF). They are based on the Medium resolution INT Library of Empirical Spectra (MILES) of Sánchez-Blázquez et al. (2006), have a nominal resolution of 2.3 Å, close to our instrumental resolution, and cover the spectral range 3540–7410 Å.
The spectra were smoothed spatially (using a spaxel region within the main galaxy body) to achieve a signal-to-noise ratio of /Å for the stellar continuum at 4600–4800 Å. For each spaxel, the spatially-smoothed spectrum from the blue arm was fitted with the Vazdekis et al. (2010) models after masking out regions below 3950 Å, which have significantly reduced S/N levels and flux calibration reliability, above 5550 Å, where a bright sky line is located, and regions affected by emission lines. The spectral pixels masked are kept fixed for all spaxels, and for each emission line we carefully examine each datacube to identify the full range of spectral pixels that are affected by the emission/sky line for at least one spaxel, ensuring that the mask is sufficiently generous to account for the shift of the emission line due to velocity gradients across the galaxy (including the extra-galactic gas). After continuum subtraction, we check the datacube representing the residual emission-line spectrum to confirm that all apparent emission lines (including very faint ones) have been completely covered by the masks. The best-fit linear combination of SSPs to the spatially-smoothed spectrum is then renormalized to fit the spectrum from the individual spaxel (again excluding the masked spectral pixels). This process allows us to subtract the continuum for spaxels in the outer regions of the galaxy where there is a clear detection of the continuum, but the signal-to-noise ratio is much too low to reliably fit complex stellar population models.
This best fit model was then extended to the red arm, and varying only the global scaling factor to account for any (slight) mismatch in the flux calibrations between red and blue arms, and subtracted from the red arm spectrum, to produce the pure emission spectrum for the corresponding spaxel in the red arm. Details on the stellar continuum modelling are given in Merluzzi et al. (2013).
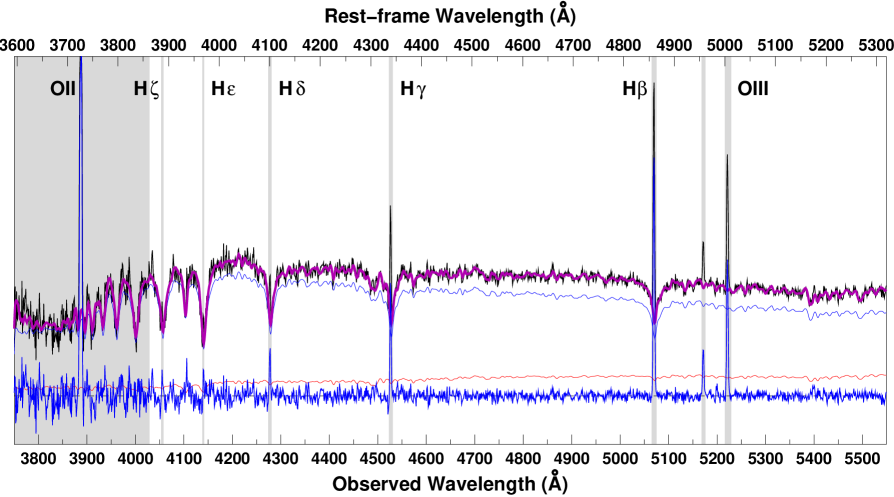
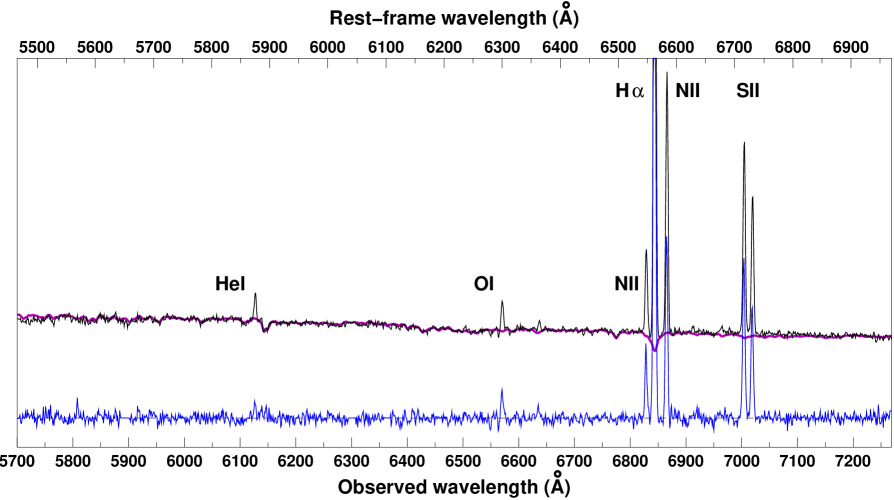
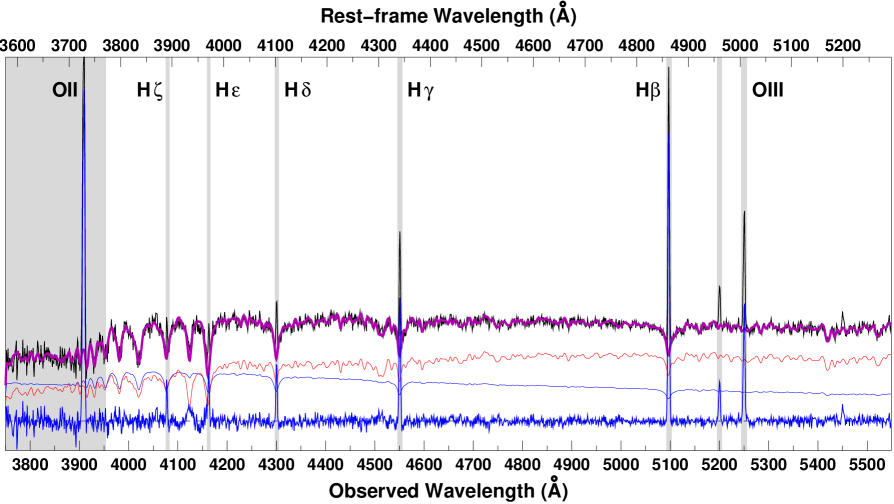
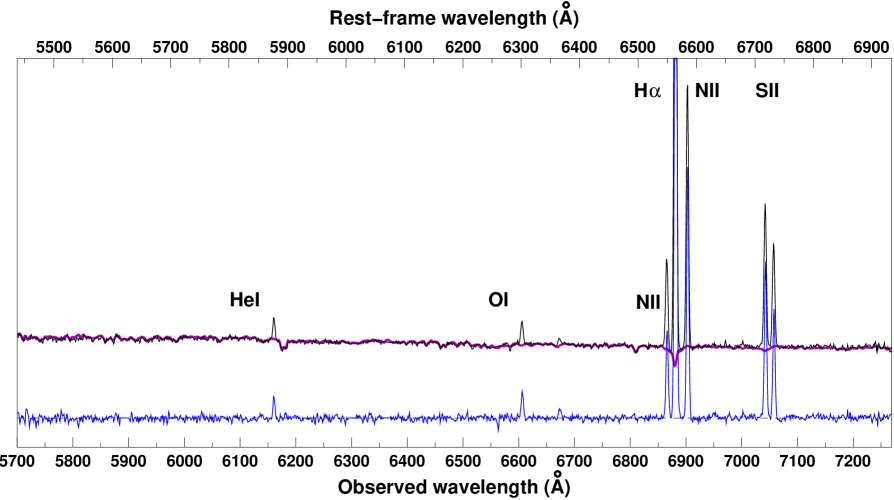
In Figs. 8 and 9 we show two example outputs of our stellar continuum fitting process. The input spectrum (black curve) is from a 33 spaxels region in the centre of the galaxy. The resultant best-fit stellar continuum (magenta curve) comprising a linear combination of SSPs, requires both young and old (thin blue/red curves) components. The shaded regions correspond to wavelength ranges not considered in the fitting process, including the masks for emission lines. This stellar continuum is subtracted from the observed spectrum to produce the residual emission component (thick blue curve) accounting now for stellar absorption, revealing clear emission at Oii, H, H, H, H, H and [Oiii]. The Balmer emission lines are all located within deep absorption features, demonstrating the necessity of accurately modelling and subtracting the stellar continuum prior to measuring these lines. Outside of the emission lines, the rms levels in the residual signal are consistent with expectations from photon noise, with little remaining structure. This holds true throughout the galaxy indicating that on a spaxel-by-spaxel basis the model fits to the stellar continuum are formally good ().
The inverse problem of recovering the star formation history of galaxies from their spectra is potentially ill-posed, and small perturbations of the data due to noise can introduce large perturbations in the best-fit stellar age distribution, at least in terms of the relative contributions from individual SSPs. To modulate this, many stellar population fitting codes employ a regularizing method to minimize the curvature (burstiness) of the star formation history while still being consistent with the observations. As our primary objective is to accurately model the spectrum and subtract the continuum so that it does not bias our emission line analyses, and map the stellar kinematics, our code does not include a regularization step or require the solution to be a relatively smooth function of age. We confirm that the addition of random noise (at the levels of the sky background) the relative contributions from individual SSPs do vary significantly, but that this is mostly just shifting weights among the SSPs that are adjacent in terms of stellar age (they are separated by just 0.1 dex). When consolidating the contributions into a small number of age ranges, such as (above and below 1 Gyr), the perturbations due to noise on the best-fit model star formation history are much less dramatic, barely shifting the relative normalizations of the thin red and blue curves in Figure 8. We caution the reader to consider our descriptions of the star formation history obtained from this continuum fitting to be qualitative rather than finely structured.
5.2 Emission-line measurements
Emission-line fluxes and widths were measured with Gaussian fitting. Where lines are either partially overlapping or close (as in the cases of [Nii]-H-[Nii], [Sii]6717-6731 and [Oiii]4959-5007), the lines were fitted simultaneously but independently to test our results against those line pairs having fixed flux ratios. The uncertainties in the derived quantities were evaluated through numerical simulations.
At SNR=5 the relative errors from the fit for both flux and is 30%. The total error on the flux also accounts for the uncertainty in the flux zero-point, which amounts to 8%.
The main contribution to the uncertainty on the radial velocity comes from the uncertainty in the wavelength calibration ( km s-1), while the error from the fit is very small ( km s-1). We assume a conservative uncertainty of km s-1. The total error on the velocity dispersion accounts for the error from the fit ( km s-1) and the uncertainty of km s-1 on the value of the instrumental width.
In Merluzzi et al. (2013) we have shown that, in order to obtain flux ratios with uncertainties lower than 30%, the individual lines must have SNR20. To achieve these SNRs we spatially binned the data by means of the ‘Weighted Voronoi Tessellation’ (WVT) method by Diehl & Statler555http://www.phy.ohiou.edu/diehl/WVT (2006) which attempts to reach a target SNR in all bins. The WVT performs a partitioning of a region based on a set of points called ‘generators’, around which the partition of the plane takes place. The partitioning is repeated iteratively until a target SNR is achieved in all bins. The advantage of the WVT with respect to the Voronoi tessellation is the possibility to ‘manually’ choose a number of generators on the basis of their position within the galaxy. The faintest line involved in our flux ratios is the [Oi] 6300 line, which is fainter than H, so that we set to 100 the target SNR of H. For spatial consistency, we manually adjusted some of the WVT regions. The 35 and 48 galaxy regions identified by the WVT for SOS 61086 and SOS 90630 respectively are shown in Figs. 13 and 21 (see Sects. 6.3 and 7.3, respectively). The spatial binning of the data was applied for the derivation of flux ratios, dust attenuation, and SFR, but not for the kinematics, for which no binning was necessary.
6 SOS 61086: results
6.1 Morphology of the H emission
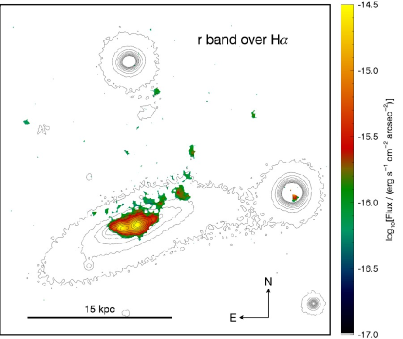
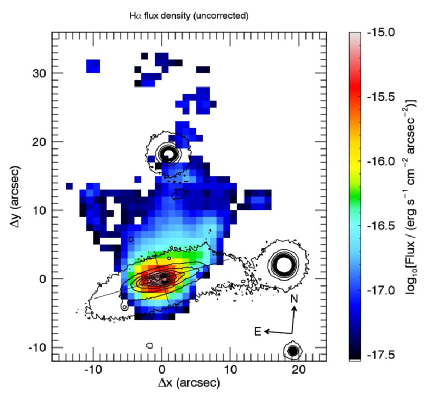
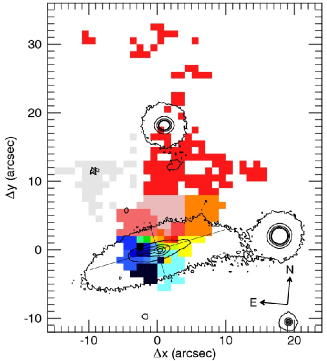
The narrow-band H image and the distribution of H emission derived with WiFeS are shown in Fig. 10 (upper and lower panel respectively). Since the H imaging is both sharper and shallower than the WiFeS data, the two data sets are complementary and together show different aspects of the distribution of ionised gas. The IFS data show that ionised gas spreads out from the disk of the galaxy in an approximately triangular region with a vertex in the central disk and one side at 16 kpc North and directed approximately E-W. No ionised gas is found in the disk beyond 6 kpc from the centre along the major axis. Along the minor axis, instead, the ionised gas appears to extend far out from the disk in projection. Other clumps of gas extend further in the North reaching 30 kpc in projection. The H flux is maximum in the centre and is directed along a main stream in the NW direction. Three secondary maxima of flux are found along the northern side. The narrow-band image resolves the nuclear emission in two main clumps lying around the photometric centre as determined by the maximum in K-band flux. The NW stream is also resolved in a chain of major emission clumps departing from the centre. Other H clumps are also detected in N and NE directions. The nearby galaxy SOS 61087 does not show any H emission associated with it.
6.2 Gas and stellar kinematics
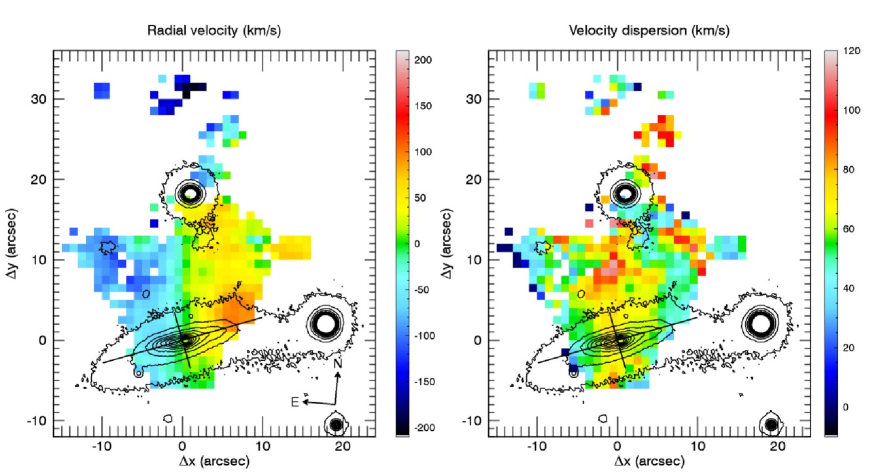
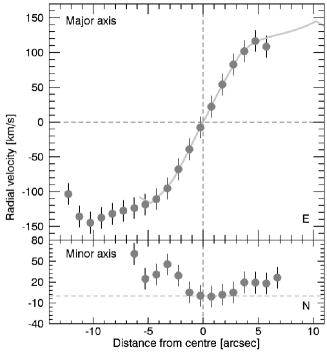
The radial velocity field of the gas derived from H is shown in the left panel of Fig. 11. The black contours trace the -band stellar continuum derived from VST imaging. The black lines mark the major and minor axes of the disk extending to 3 the disk scale radius, and crossing at the -band photometric centre. The kinematic centre coincides with the photometric centre of the -band image.
Given the strong perturbation experienced by the gas, the most remarkable feature of this velocity field is the large-scale regular motion. Overall, the gas appears to rotate around an axis extending 12 kpc (in projection) North from the galaxy centre, well beyond the stellar disk. This ‘rotation axis’ bends westwards South from the centre. Superimposed to the large-scale motion there are however some significant local maxima and minima in radial velocity, like for instance an area at 7 kpc W from the centre and 1 kpc N from the disk, with V85 km s-1. The distant shreds of gas in the North do not seem to participate in this overall motion, being generally blue-shifted with respect to the average.
The gas velocity dispersion (Fig. 11 right panel) is generally higher than expected for normal turbulent HII regions (0–30 km s-1). As expected, is higher where the radial velocity gradients are larger. But in some areas it reaches values as high as 100 km s-1, such as in the region about 8 kpc N from the centre. Such high values most probably witness the presence of complex motions of different gas elements along the line of sight.
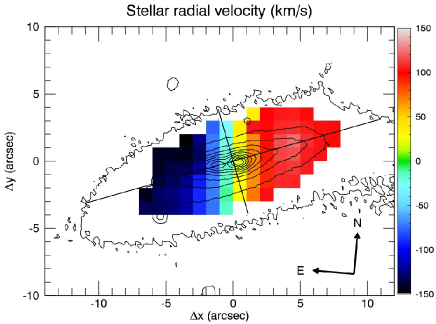
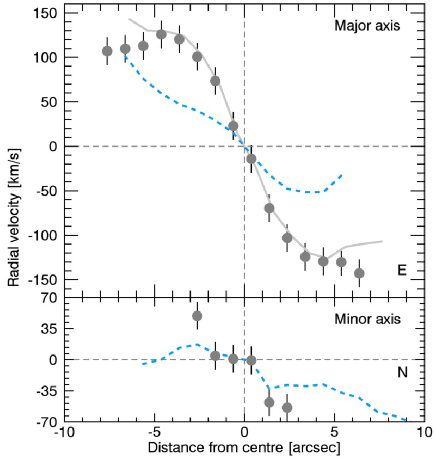
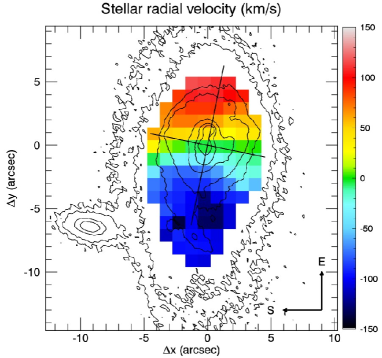
From the fit of the stellar continuum we derived the velocity field of the stars shown in Fig. 12. The stellar velocity field is fairly symmetric in the inner 4 kpc. The kinematic axis is skewed with respect to the minor axis, reflecting the presence of non-circular motions, most probably to the presence of a bar. This axis is aligned with the kinematic axis of the gas. Also the the shape of the velocity field bears some resemblance with the gas, but the comparison of the two velocity profiles (lower panel of Fig. 12) show that the two components are clearly decoupled. The shape of the minor-axis velocity profile of the stars is consistent with the non-circular motions due to a bar.
6.3 Dust extinction across the galaxy
For the subsequent analysis of this galaxy, we binned the spatial pixels to achieve the needed SNR as explained in Sect. 5.2. Only the pixels with SNR(H) were considered to make the bins666In spaxels with SNR(H)3, many fainter lines (notably [Oi]6300) are not even visible. We therefore adopted a higher threshold for SNR(H), with a value around 8 representing a good compromise between quality and extension of the measured area.. The 35 regions so identified are shown in Fig. 13.
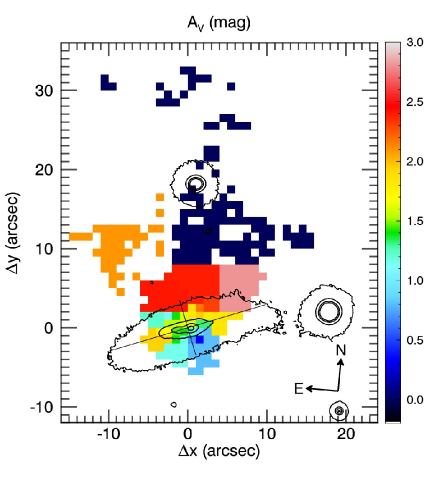
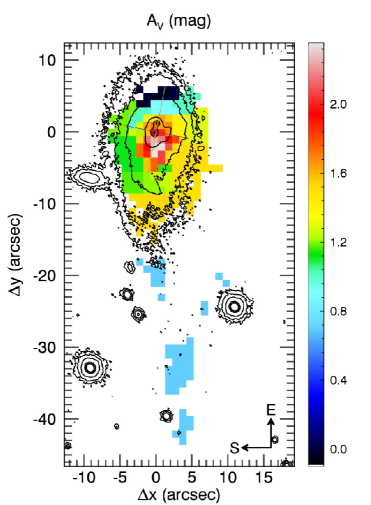
The distribution of the dust attenuation derived for each of these regions from the H/H line ratio, given in terms of the -band extinction is shown on the upper panel of Fig. 14. Here we adopted an intrinsic ratio of 2.87 (the ‘case B’ recombination). In doing so, we implicitly assume that the extraplanar gas is in the conditions of typical Hii regions, in which the primary source of ionisation is ongoing star formation. Other sources of ionisation such as thermal conduction, shock-heating or magneto-hydrodinamic processes (e.g. Veilleux et al., 1999; Boselli et al., 2016) might be at work in the tail, in which case the actual would be significantly different from the one estimated here. This is certainly the case for the NE region of the tail (light gray in Fig. 15), which we show below to be dominated by shock heating. For the rest of the tail, the continuum emission detected in the whole UV-optical wavelength range ( to ), the presence of compact emission regions witnessed by the H image and the diagnostic diagrams (see below) make us confident that most of the detected emission is associated to star formation (e.g. Yoshida et al., 2012). We adopted the theoretical attenuation curve by Fischera & Dopita (2005) with . The highest dust extinction (.5-2.9 mag) is observed in two regions covering the NW disk and the extraplanar gas just out of the disk. The asymmetric distribution of the dust extinction strengthens our hypothesis on the apparent bending of the disk (Sect. 2.1). Moderate (.5 mag) dust attenuation is observed in the galaxy centre, while the southern part of the disk and the NW tail of the extraplanar gas suggest a lower dust content.
6.4 Ongoing star formation and recent star formation history
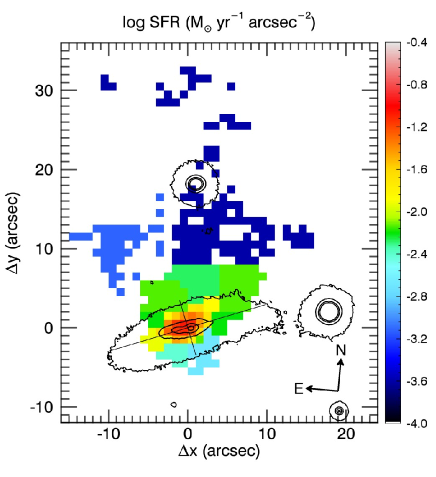
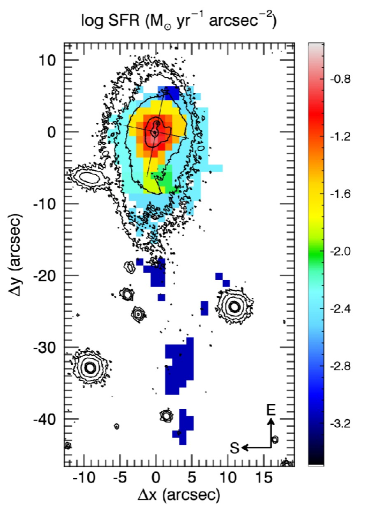
We derive the current SFR from the H flux taking into account the effects of dust extinction following Kennicutt (1998) and adopting the Kroupa IMF. The SFR surface density across the galaxy is given in the bottom panel of Fig. 14. The integrated H-derived SFR of SOS 61086 amounts to M⊙yr-1 where the error takes into account the uncertainties related to the flux and attenuation measurements added to a 30 per cent uncertainty due to the different calibrations of H as a SFR indicator (Kennicutt, 1998). The contribution to the SFR from the NE (shock-dominated, see Sect. 6.5) tail is not considered. Half of the SF occurs in a central region of 2.5 kpc radius. Lower SFR is detected in the external disk and the extraplanar gas close to the disk. The SFR value in the gas tail far from the disk suggests that SF in low in the detached gas. The integrated H-derived SFR is consistent with that derived from UV and IR data (see Table 1).
The recent star formation history across the disk is constrained by the stellar continuum modelling described in Sect. 5.1. In the centre of SOS 61086, where the density of star formation appears highest (see Figs. 8 upper panel), the emission from the stellar continuum appears relatively blue, peaking at 000Å (rest-frame). This reflects the dominant young stellar population in the centre of the galaxy, with stars younger than 1 Gyr (thin blue curve in Fig. 8 upper panel) contributing 85% of the luminosity at 4000Å, and 24% of the stellar mass. This dominance of young stars is supported by the deep H and Caii H absorption features, which give rise to low values of the Caii index (0.65; Rose, 1985, defined as the ratio of the counts in the bottom of the Caii H+H and Caii K lines) and the Hi4045 index (0.53), indicative of an ongoing/recently terminated star-burst that dominates the integrated light at 4000Å (Leonardi & Rose, 1996). Our stellar modelling of the young component suggests a continuous steady SFR over the full range 60–1000 Myr, with 16% of the stellar mass within this young component coming from stars younger than 200 Myr. This sustained increase in star formation is still ongoing as implied by the strong H emission in this region with EWÅ (see Fig. 8 lower panel). Further Balmer emission lines are visible in Fig. 8, from H all the way up to H (3889Å). The old stellar component (red curve) includes both intermediate age (2–3 Gyr old) and primordial (8–15 Gyr old) components, indicative of a continual formation of stars through the lifetime of the galaxy.
As we move from the centre of the galaxy to the eastern edge the spectra progressively change from ongoing starburst to post-starburst signatures, with EW(H) declining steadily to zero, and the H and Caii H absorption lines becoming ever deeper. Here the Caii index (Rose, 1985) falls to a value of just 0.27, while the Hi4045 index also drops to 0.42. Such extreme values are too low for any of the burst models of Leonardi & Rose (1996), but certainly require the entire integrated light at 4000Å to be due to a recent/ongoing burst. Indeed, our best-fit stellar population model has little (if any) contribution from old (1 Gyr) stellar populations (red curve) in terms of emission, being dominated by 0.3–1.2 Gyr stellar populations with spectra dominated by A-type stars.
6.5 Excitation and metallicity of the gas
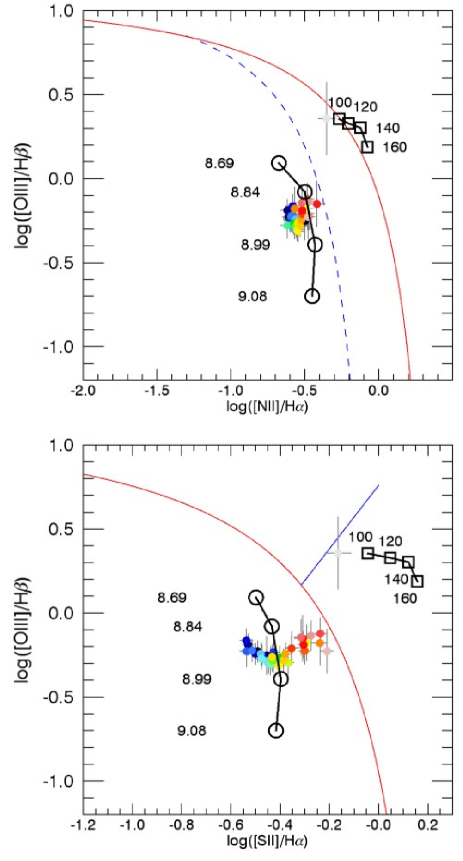
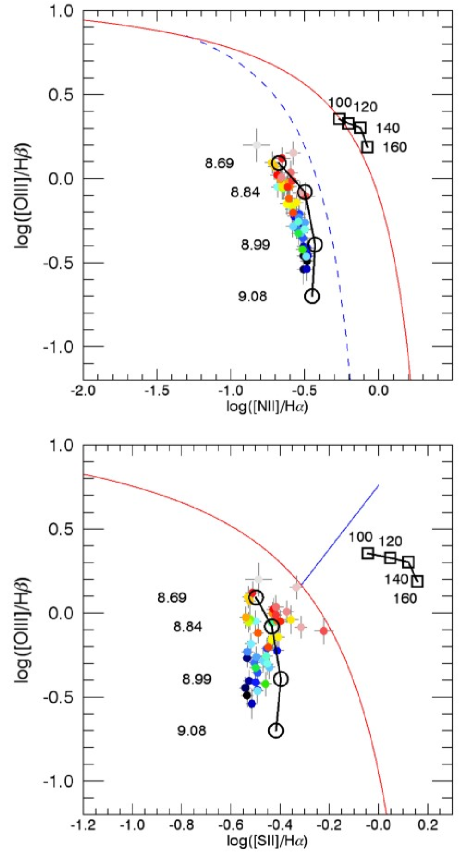
The line ratios and velocity dispersions observed in the ionised gas enable us to distinguish between gas which is photoionised by HII regions, and gas which is excited by shocks. In order to interpret the line ratio diagnostics, we have run some representative shock and photoionisation models using the modelling code Mappings 4 described in Dopita et al. (2013). In Fig 15 we show the observations of SOS 61086 on the standard BPT diagrams (Baldwin et al., 1981) as refined by Veilleux & Osterbrock (1987), Kewley et al. (2001), Kauffmann et al. (2003) and Kewley et al. (2006). We also plot four HII region models generated as described in Dopita et al. (2013) with a ionisation parameter (see below), and four different metallicities (open circles in Fig. 15). We also show, for comparison, four shock models with 2 solar metallicity () and four different velocities (open squares in Fig. 15). These shock models have fully self-consistent ionisation.
In our first study (Merluzzi et al., 2013) and in other cases of RPS galaxies (e.g. Fossati et al., 2016) clear evidence has been found that both photo- and shock-ionisation were at work. In SOS 61086 the situation with regard to shocks is different. The line ratios cluster over a very narrow range (see Fig. 15) consistent (according to our photoionisation models) with gas of somewhat higher than solar metallicity () being ionised mainly by hot stars, except for the NE tail. By comparison of the observations with the shock sequence it is clear that shocks are important in determining the excitation only in the NE region of the tail.
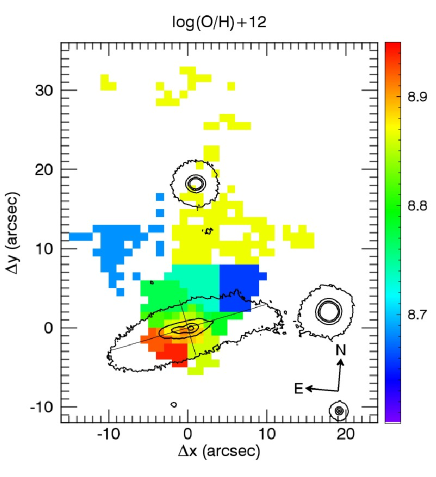
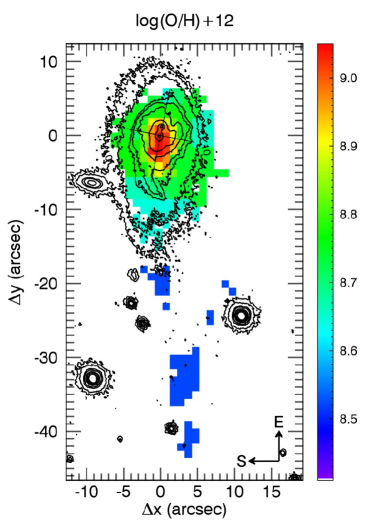
The tight grouping of points indicates very little sign of an abundance gradient in this galaxy, or in the extraplanar gas associated with it. We have used the Python module Pyqz777The lines in the Pyqz code are H, [Oiii] , [Oi] , H, [Nii] , [Sii] . described in Dopita et al. (2013) to estimate the ionisation parameter and the oxygen abundance in each of the 35 galaxy regions identified by the WVT. The ionisation parameter spans a narrow () range of values around . The oxygen abundance is shown in Fig. 16 where a rather uniform distribution is seen.
7 SOS 90630: results
7.1 Morphology of the H emission
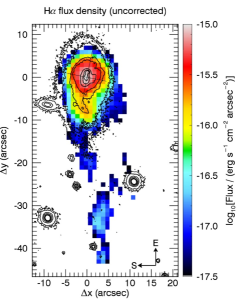
The H image and the distribution of H emission from IFS for SOS 90630 are shown in Fig. 17 (upper and lower panels respectively). The ionised gas disk appears truncated in the ESE side. Gas extending 4 kpc in projection out of the disk is seen in the NW side, and more prominently along a tail extending by more than 41 kpc to the West. The maximum of H emission takes place in the centre of the galaxy, and is resolved into two clumps about 1 kpc apart in the narrow-band image. The MMTF image resolves an arc-shaped crown composed of H emitting knots all long the leading edge of the galaxy. Other knots of H flux are detected along a western arm and in the tail. The MMTF imaging also reveals compact ( kpc) H emission at the centre of SOS 90090, indicating the presence of an AGN or ongoing nuclear star-formation activity. The overall morphology of the H emission is a remarkable example of the classic “jellyfish” forms reproduced in simulations of galaxies undergoing RPS (e.g. Kapferer et al., 2009).
.
7.2 Gas and stellar kinematics
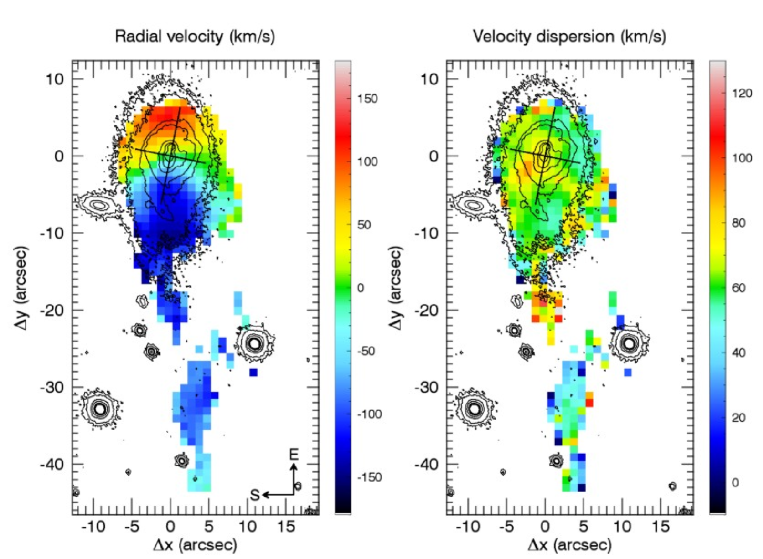
The velocity fields of the gas in SOS 90630 are shown in Fig. 18, while Fig. 19 shows the profiles of the gas radial velocity along the major and minor axes in the disk of the galaxy. The kinematic axis (traced by the green colour) is distorted into a U-shape with a concavity directed to the West and is not symmetric with respect to the major axis.
The kinematics of the external gas is continuous with that of the disc. The velocity in the tail smoothly rises from 145 km s-1 in the disk to 20 km s-1 at the extreme west edge (41 kpc from the centre). Within 5 kpc, where the gas is present on both sides of the disk, the radial velocity is symmetric with respect to the centre (Fig. 19, upper panel). Only in the last kpc in the western disk we notice an inversion of the trend. The minor axis profile just reflects the U-shaped kinematic axis.
The velocity dispersion of the gas is fairly uniform in the disk, around 60-80 km s-1, higher (80-120 km s-1) in the first part of the tail (17 to 21 kpc from the centre) and lower (around 50 km s-1) in the rest of the tail. In the disk, we notice that the region with higher values of is also U-shaped like the radial velocity field.
The stellar radial velocity field and profiles, shown in Fig. 20, are almost fully consistent with those of the gas along the major axis, but in the southern part of the minor axis the gas recedes with a velocity higher (by 20 km s-1) than the stars, indicating that the two components are decoupled outside of the very central ( kpc) region of the galaxy.
7.3 Dust extinction across the galaxy
Similarly to the analysis of SOS 61086, we performed a spatial binning of the IFS data to reach the SNR needed for reliable line-ratio measurements. As before, only the pixels with SNR(H) were considered in the analysis. The 48 regions so obtained are shown in Fig. 21. Similarly to SOS 61086, the continuum emission (from to bands), the presence of compact H emission regions and the diagnostic diagrams suggest that the detected emission is mainly associated to star formation. In Fig. 22 (upper panel) we show the spatial distribution of the dust attenuation. This has the maximum (at mag) in the centre and is enhanced in the NW sector of the disk ( mag), while decreases in the SE sector ( mag). The attenuation in the gas tail ( mag) indicates a small dust content. The inset of Fig. 22 (upper panel) is a zoom in the centre of the galaxy to show that the western side is more attenuated (by mag) than the eastern side in support of the fact that the optical appearance of a double nucleus is an artefact from dust absorption (see Appendix A).
7.4 Ongoing star formation and recent star formation history
The map of SFR in Fig. 22 (lower panel) shows that the highest star formation takes place close to the galaxy centre extending across the eastern clumps of Hii regions and is then truncated on the eastern boundary of the galaxy. The western spiral arm in the H imaging is also recognizable in this map. The SFR drops abruptly in the external disk and is low in the tail. The integrated H-derived SFR of SOS 90630 (adopting the Kroupa IMF) amounts to M⊙yr-1 where the error is estimated as for SOS 61086. The integrated H-derived SFR is consistent within the errors with that derived from UV and IR data (see Table 1).
The stellar continuum from the centre of SOS 90630 appears relatively flat from data gathered in the blue arm of WiFeS (Fig. 9 upper panel), with 45% of the integrated emission at 4000Å coming from stars formed less than 1 Gyr ago (thin blue curve), while the remainder comes from an old (1 Gyr) stellar component. This older component appears primarily due to intermediate age stars (1.5–3 Gyr old) with little contribution from stars formed at . The young stellar component primarily consists of a single burst of star formation extending over the last 200 Myr, contributing 4% of the stellar mass. This is still ongoing as manifest by the strong H emission with EWÅ and other Balmer emission lines visible up to H. This relatively mild recent increase in star formation is also supported by the Caii index of 0.81 and Hi4045 index of 0.76, both higher than those seen in SOS 61086, and consistent with a 0.3 Gyr burst of star-formation contributing 40% of the integrated light at 4000Å (c.f. Fig 3a of Leonardi & Rose, 1996). The stellar mass contribution of recently formed stars (200 Myr old) increases slightly to 6% along the eastern edge, as does the strength of the H emission.
7.5 Excitation and Metallicity of the Gas
The BPT diagrams for SOS 90630 present no evidence that shocks play a role in the excitation of the gas within the main body of the galaxy, or within its extended tail. Indeed, the sequence of observed points in Fig. 23 indicating that the excitation is due to HII regions with a fair range of abundance values. This abundance range is caused by the fact that this galaxy has a clearly-defined abundance gradient, as can be seen in Fig. 24, where the individual abundances are again derived using Python module Pyqz described in Dopita et al. (2013). Also for this galaxy, the ionisation parameter spans a narrow () range of values around . The tail of the galaxy shows appreciably lower oxygen abundance that the main body, identifying this gas as having come from the outer regions of the galaxy.
8 Discussion
SOS 61086 and SOS 90630 are characterized by extraplanar ionised gas extending out to projected distances of 30 and 41 kpc, respectively. Such tails have been observed in other cluster galaxies (e.g. Vollmer et al., 2005; Sun et al., 2007; Yagi et al., 2007, 2010; Yoshida et al., 2012; Boselli et al., 2016), but their origin is not easy to determine since different possible causes, acting at different epochs, may contribute to the observed features. Such large-scale outflows of gas from a galactic disk may be due to TI or RPS. We aim to investigate which of these mechanisms dominates the evolution of the two galaxies although the solution may not be unique.
Both galaxies have other supercluster members in their proximity which could potentially interact with them. The best candidates for TI with SOS 61086 and SOS 90630 are SOS 61087 and SOS 90090, respectively.
8.1 SOS 61086
The ‘companion’ of SOS 61086 is an early-type galaxy located at a distance of 17 kpc in projection and 300 km s-1 in LOS velocity from SOS 61086. The difference in redshift is lower than the velocity dispersion of the host cluster SC 1329-313. Since the two galaxies have comparable masses, a possible interaction could strongly affect their structures and SFs and may induce gas/star outflow. However, we do not observe any clear disturbance in the stellar disk of SOS 61086 and SOS 61087 is a ‘red and dead’ galaxy without any signs of perturbation.
The gas from the outer disk of SOS 61086 has almost all been removed from the outer edge of the disk beyond 7-8 kpc from the centre, and all that is left is the denser ISM close to the nucleus and that associated with the inner disk. The truncated gas disk and the fan-shape of the extraplanar gas points to ongoing RPS. The gas tail expands to the North in the direction of the possible companion galaxy, but it extends more than 10 kpc further in projection beyond SOS 61087 in such a way that it cannot be a bridge between the two galaxies. We already noticed that the rotational component of the gas disk is preserved in the extraplanar material (at least up to 12 kpc from the disk) as seen in other cases of galaxies subjected to ram-pressure (e.g. Merluzzi et al., 2013; Fumagalli et al., 2014). No tidal stripping scenario would be able to preserve such a rotational signature in this way, while RPS acting almost face-on could provide a natural explanation.
The gas velocity profile is asymmetric as foreseen in galaxies affected by RPS and TI (Kronberger et al., 2008, 2006), but a comparison of the gas and stellar velocity profiles shows that the two components are clearly decoupled with the gas having lower velocities on average and the stellar profile being fairly symmetric. This strongly favours the RPS hypothesis.
The peak of luminosity in the centre is dominated by a young population (1 Gyr) of stars indicative of a recent/ongoing starburst. This feature can be associated to RPS as shown by simulations (Kapferer et al., 2009; Steinhauser et al., 2012) and observations (Merluzzi et al., 2013; Kenney et al., 2014; Yagi et al., 2013). Crowl & Kenney (2008) conducted a survey of 10 Virgo galaxies with SparsePak IFS. They found clear evidence of RPS-induced star formation within the truncation radius and a passive population beyond it. A burst of star formation can also be induced by TI (e.g. Kronberger et al., 2006), but would take place close to the pericentre passage (e.g. Di Matteo et al., 2008), where the galaxies are heavily perturbed, and this is not our case. The top panel of Fig. 10 shows H emission knots well out of the disk and also this feature can be related to both RPS and TI. With respect to the source of excitation, differentely to other galaxies affected by ram-pressure, here shocks are not important: the line ratios are characteristics of Hii regions across the galaxy and in the tail, except for one region in the NE tail. This is not the case in other galaxies showing RPS such as NGC 4330, NGC 4402, NGC 4501, NGC 4522 (Wong et al., 2014) and NGC 4569 (Boselli et al., 2016) in the Virgo cluster, IC 4040 (Yoshida et al., 2012) in the Coma cluster, ESO137-001 (Fossati et al., 2016) in the Norma cluster and SOS 114372 (Merluzzi et al., 2013) in the cluster A 3558. Nevertheless, our observations suggest that star formation is occurring in the tail which is also inferred, for instance, by Yagi et al. (2013) for NGC 4388 in the Virgo cluster and Fumagalli et al. (2014) for ESO137-001 in the Norma cluster.
In summary, the observational evidences support in general the RPS scenario, although we cannot exclude a TI in a very early phase. We investigate if RPS alone can explain the observed gas kinematics running N-body/hydrodynamical simulations of RPS for SOS 61086.
8.2 SOS 90630
SOS 90630 is distant 68 kpc in projection and 320 km s-1 in LOS velocity from SOS 90090 and the two galaxies belong to SC 1327-312 which has a velocity dispersion of 535 km s-1. The tail of extraplanar gas is directed toward the other galaxy (see Fig. 17), which, incidentally, is a factor 4-5 more massive.
The star formation across SOS 90630 is highly asymmetric (upper panel Fig. 17 and lower panel Fig. 22) with a ‘crown’ of Hi regions tracing the eastern disk and other star-forming regions in the western disk elongated toward the tail in a spiral arm. A single burst of star formation over the last 200 Myr and still ongoing is responsible of the young stellar population detected in the centre (Sect. 7.4). What induced this burst and the asymmetric SF across the disk?
The gas and stellar velocity profiles coincide in the inner disc, but are decoupled in the outer disk along the minor axis. Along the major axis we observed the gas truncation in the leading eastern edge and the gas tail leading West following the galaxy rotation with an inversion only in the more distant section. In case of RPS this would be acting almost edge-on to reproduce the shape of the outflowing gas. The gas emission is consistent with photoionisation throughout the galaxy and in the tail.
The crown of H emission evokes the decoupled dust clouds observed in two Virgo spirals by Abramson & Kenney (2014). They show the bulk of the dust being pushed back into the galaxy by ram-pressure, leaving behind a population of isolated giant molecular clouds located up to 1.5 kpc beyond the edge of the main dust lane. These molecular clouds are the only parts of the ISM currently able to resist the ram pressure which is acting to decouple them from the rest of the lower-density ISM material. Similar features are also observed by Yagi et al. (2013) in NGC 4388. This is confirmed in the present case by the low dust extinction measured in the leading edge and increasing toward the galaxy centre and in the western galaxy disk (see Fig. 22). We notice however that similar features are also found in hydrodynamical simulations of mergers (Teyssier et al., 2010) where the gas response to the interaction is dominated by fragmentation in dense clouds along the spiral arms.
The observational evidence alone does not allow us to establish which mechanism prevails over the other. While the truncation of the gas disk supports the RPS, other indicators as the -band imaging tend to TI between SOS 90630 and the close massive SOS 90090 although its disk does not present obvious signs of perturbations. This reminds the case of NGC 4438 in the Virgo cluster with a stellar tidal tail and extraplanar gas (Vollmer et al., 2005), its companion NGC 4435 presents an almost regular disk in the optical image. We chose to run solely hydrodynamical simulations of RPS even in this case for two main reasons. Firstly, our aim is to investigate if RPS can play any role and at what extent. Secondly, to set the hydrodynamical simulations of TI would imply to make assumptions on the impact parameters, the spatial trajectories and the relative velocities of the galaxies, which are almost impossible to constrain, and therefore render the results of such simulations very uncertain.
8.3 Ram-pressure stripping
The effects of RPS depend on the properties of both the galaxy and the ICM as well as the relative velocity. For the galaxies we adopt the parameters listed in Table 1 and Sect. 2. The ram pressure is given by , where is the density of the ICM and is the velocity of the galaxy relative to the ICM. These parameters are estimated as follows.
8.3.1 ICM densities
Successive XMM-Newton observations have now continuously covered the SSCC filament that connects A 3562, SC 1329-313, SC 1329-312 and A 3558. Out of these observations, photon-event light curves have been analysed in order to filter any flare contamination, i.e. observation periods with an anomalous count rate. This ‘cleaning’ procedure yields 11 filtered event-lists that we reprocessed using the XMM-Newton Science Analysis System (SAS) version 14.0.0 in order to select the relevant calibration files. Following a procedure described in Bourdin & Mazzotta (2008), the filtered event-lists have been re-binned in sky coordinate and energy, and associated to both a 3D effective exposure and a background noise model. As detailed in Bourdin et al. (2013), the background noise model includes astrophysical and instrumental components that have been jointly fitted within a sky area that excludes the brightest region of each cluster. A wavelet denoised image of the SSCC filament derived from this data set is shown in Fig. 1. Assuming that the ICM is spherically symmetric in the innermost regions of SC 1329-313 and SC 1329-312, we deprojected a couple of gas density profiles centred on each cluster peak. To do so, analytic profiles of the gas density and temperature (Vikhlinin et al., 2006) were projected along the line of sight following the weighting scheme proposed by Mazzotta et al. (2004), and fitted to the radially averaged surface brightness and spectroscopic temperature. In this procedure, the ICM emissivity is modelled following the Astrophysical Plasma Emission Code (Smith et al., 2001), shifted to and absorbed assuming a Galactic hydrogen density column of N cm-2. The derived profiles are shown in Fig. 25.
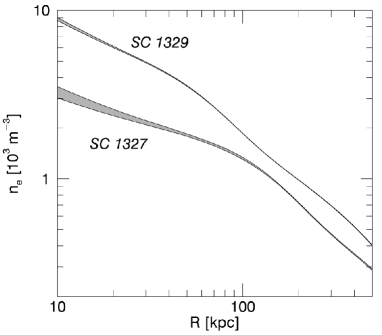
SOS 61086 and SOS 90630 are located at 282 kpc and 226 kpc, respectively, in projection from the X-ray cluster centres. Interpolating the density profiles at these radii, we obtain electron densities of cm-3 and cm-3, respectively. Assuming a metallicity of Z=0.3 and the element abundances of Grevesse & Sauval (1998), the particle mean weight per hydrogen atom is , and the number of electrons per hydrogen atom is . Given these values, the ICM mass density can be derived from the electronic density:
Therefore, electronic densities measured for SOS 61086 and SOS 90630, at the projected distances, translate in gas mass densities of g cm-3 and g cm-3. However, these are upper limits since if the galaxies are at larger 3D distances, their local densities will be lower. We account for this possibility considering also lower values for the ICM densities. At about 2 the projected radius we measure g cm-3 and g cm-3.
8.3.2 Orbital velocities of the galaxies
As lower limits for the orbital velocities, we assume the galaxies’ LOS velocities relative to the clusters’ systemic velocities -612 km s-1 and -336 km s-1 (both galaxies have lower velocities with respect to the systemic ones, indicating that they are moving toward the observer). The galaxies have also a velocity component in the plane of the sky, as suggested by the geometry of the gas tails. For the upper limits to the spatial velocity we assume a velocity equal to 3 the cluster velocity dispersion, i.e. 1000 km s-1 and 1500 km s-1 for SOS 61086 an SOS 90630, respectively.
The inclination of the galaxy disk and the distribution of the extraplanar gas suggest that the RPS is acting almost face-on on SOS 61086 and almost edge-on on SOS 90630. The inclination angle between the galaxy rotation axis and the ICM wind direction has been shown to influence the amount of the gas pushed out of the disk in the first phase of the stripping, only in case of moderate ram pressure (e.g. Marcolini et al., 2003; Roediger & Hensler, 2005). On the other hand, can be important in drawing the shape of the stripped gas. We note that in the observed shape another factor is crucial, i.e. the position of the observer with respect to both the wind and the galaxy disk.
For SOS 61086 there is an indication that the galaxy is not moving radially into the cluster: the extraplanar gas extends N-S while the cluster centre is located West of the galaxy position projected in the sky. We explored the values in the ranges: 500-1000 km s-1 and 500-1500 km s-1 for the orbital velocity of SOS 61086 and SOS 90630, respectively. For the inclination angle, we considered a wide range . Our approach was to run low-resolution simulations for a grid of parameters and then select the most promising cases for the high-resolution simulations.
8.3.3 Constraints on RPS
To check if the expected ram pressure is able to strip the gas from the disk of SOS 61086 and SOS 90630, we compare it to the gravitational restoring force per unit area , with and the star and gas surface density, respectively (e.g. Kenney et al., 2004; Domainko et al., 2006). The stellar mass surface density in the disk is given by where is the disk scale radius and with the mass of the disk. The disk scale radii are kpc and kpc for SOS 61086 and SOS 90630 respectively888These quantities were derived by fitting the VISTA -band images using GALFIT (Peng et al., 2010) and corrected for dust absorption following Graham & Worley (2008).
The mass surface density at the stripping radius, , is . The ram pressure is equal to the restoring force at radius when . We assume a typical M⊙pc-2 (e.g. Kenney et al., 2004). For SOS 61086 we have M⊙, kpc, kpc so the ram pressure can be effective in removing the gas from the disk if km s-1 and km s-1 with high and low density of the ICM (see Sect. 8.3.1). For SOS 90630 we have M⊙, kpc, kpc implying km s-1 and km s-1 for high and low density of the ICM (see Sect. 8.3.1). In these estimates we assumed the ram pressure acting face-on but simulations show that the inclination angle does not play a major role unless the ram pressure is acting very close to edge-on (Roediger & Brüggen, 2006).
Combining the ICM density estimates and the velocity ranges for the two galaxies, the ram pressure ranges from dyn cm-2 to dyn cm-2 for SOS 61086 and from dyn cm-2 to dyn cm-2 for SOS 90630. Following Roediger & Hensler (2005) these are the regimes of weak to moderate ram pressure for SOS 61086 and moderate to high ram pressure for SOS 90630. Their 2D hydrodynamical simulations demonstrated that ram-pressure effects can be observed over a wide range of ICM conditions and even in low density environments, such as cluster outskirts and poor clusters as in this case, where the moderate ram pressure can bend the gaseous disk of galaxies. Taking into account that our galaxies are 2.7-2.1 mag fainter than , we expect the ram pressure being much more efficient up to determining the truncation of the gas disk, as we observe (e.g. Marcolini et al., 2003).
9 Does ram-pressure stripping explain the observations?
The main goal of the simulations is to understand to what extent ram pressure might explain the main observed features of the gas: the truncation of the disk, the shape and extension of the tail and the kinematics. This would eventually constrain the ICM wind angle and velocity and the time of the onset (‘age’) of RPS.
| SOS 61086 | SOS 90630 | |
| 9.619 | 9.165 | |
| 1.556 | 1.071 | |
| 2.691 | 2.797 | |
| 0.7897 | 0.993 | |
| 7.91 | 9.08 | |
| 93 | 120 | |
| 0.033 | 0.033 | |
| 0.0285 | 0.0355 | |
| 0.00392 | 0.00369 | |
| 0.48 | 0.24 | |
| 0.2 | 0.2 | |
| 2.61 | 2.05 |
| Initial properties of the two galaxy models. First, the param- |
| eters of the modified NFW (Di Cintio et al., 2014) halos: con- |
| centration ; shape parameters , , ; scale radius ; scale |
| density . Afterwards the setting for disk and bulge, follow- |
| ing Springel et al. (2005). is the velocity at the virial ra- |
| dius , the dimensionless spin parameter. The disk and |
| bulge mass fractions are and , with being the ini- |
| tial gas amount in the disk and giving the disk height as |
| a fraction of the disk scale length . |
9.1 N-body/hydrodynamical simulations of RPS
We performed simulations of model galaxies resembling SOS 61086 and SOS 90630 and experiencing RPS. The simulations have been done with the cosmological moving-mesh code AREPO (Springel, 2010). Contrary to ordinary grid codes, the Euler equations of ideal hydrodynamics are solved on a moving mesh which allows to construct a Galilean-invariant scheme. Such an approach allows an accurate treatment of gas mixing and fluid instabilities (Rayleigh-Taylor or Kelvin-Helmholtz instabilities), both crucial in RPS simulations. In the simulations, radiative cooling (Katz et al., 1996) and a sub-grid, multi-phase model for star formation and stellar feedback (Springel & Hernquist, 2003) are included as well.
To simulate a galaxy undergoing RPS, we use a wind-tunnel setup similar to Heß & Springel (2012). First, model galaxies are generated, resembling pre-interaction properties of SOS 61086 and SOS 90630. Initial conditions for an exponential stellar and gaseous disk, as well as a stellar bulge with a Hernquist (1990) profile, of those model galaxies are calculated according to Springel et al. (2005), based on theoretical work by Mo et al. (1998). For the dark-matter halo we are using a modified NFW profile according to DBD2014, and also include a hot gas halo. The properties of the model galaxies are shown in Table 2. Those model galaxies are put into a cuboidal simulation domain with extension with the model galaxy statically placed at . The dark-matter halo is represented by a static gravitational potential, yielding an additional force on stellar particles and gas cells in addition to their self-gravity.
RPS is simulated by imposing a wind on the model galaxies. To this extent, gas cells are inserted in front of the galaxy with the preferred density, velocity and a constant volume of or , depending on the resolution of the simulation. When they pass by the galaxy, the resolution is adjusted and gas cells are refined in order to avoid too large volume discrepancies of neighbouring cells. Furthermore, the mass resolution of gas cells which mainly contain ISM, is kept at a constant value in order to produce stellar particles with a constant mass. At the end of the simulation domain, all gas cells are removed. To distinguish between gas cells containing either ICM or ISM, a colouring technique as described in e.g. Vogelsberger et al. (2012) is used. Gravitational softening lengths are set according to Hayward et al. (2014). We are using particles/cells for the stellar and gaseous disk respectively, as well as particles for the stellar bulge. On average, the wind tunnel contains gas cells. For the low-resolution runs (LR), we use a tenth of the particles/cells.
The models were run from the onset of the ram pressure to 1 Gyr after and stored in steps of 10 Myr. During this time the ram pressure is kept constant and its onset is immediate.
9.2 Simulations analysis
The simulations were run in the ranges of wind velocity and inclination angle defined in Sect. 8.3.2. To compare the results of simulations to the observed velocity fields, we proceeded as outlined in Merluzzi et al. (2013) and summarized below. We first oriented the models with respect to the observer in such a way that their LOS velocity equals the observed velocity relative to the parent cluster. Then, we integrated the velocities of the individual cells along the LOS and binned the derived velocity fields in square pixels of 1 arcsec side, to simulate our IFS data. In doing this, we only considered cells whose fraction of disk gas is greater than a certain threshold to minimize the bias on the velocity field coming from ICM particles. We adopted a threshold of 0.5, although the results remain constant for a relatively wide range (0.2-0.9) of this parameter. A visual comparison of the data and the models then leads to the selection of the parameters of the best RPS models.
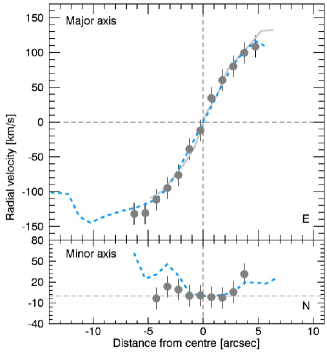
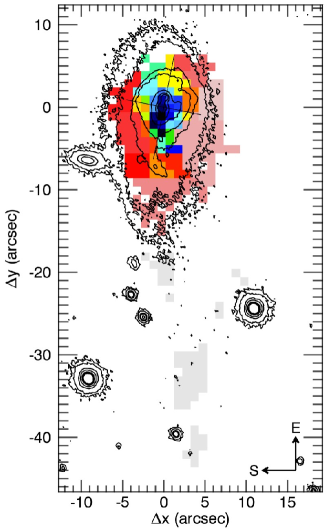
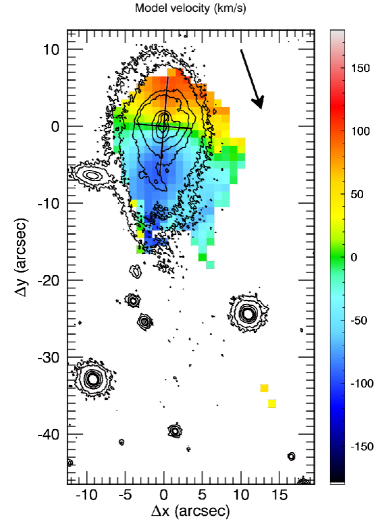
In Fig. 26 we show the simulation which better matches the gas velocity field of SOS 61086 and the projection on the plane of the sky of the ICM wind direction. This model corresponds to , =750 km s-1, 250 Myr and g cm-3. We notice an overall agreement between the model and the WiFeS observations (Fig 11, left panel). Both the velocity range and the gas distribution are well reproduced by the model, where the gas extends further in projection with respect to SOS 61087. Nevertheless, two particular features cannot be reproduced by any models: the presence of the ionised gas in the central south disk and the blue shifted gas clumps observed in the furthermost extraplanar gas.
The neutral and ionised gas are assumed to be mixed as suggested by simulations and observations (Tonnesen & Bryan, 2010; Abramson et al., 2011), but in principle the simulations show the velocity field of the whole gas, while our data refer to the ionised gas. This can be the origin of discrepancies between models and observations. In particular, the ionised gas in the south disk may be due to a galactic wind or the presence of denser clouds more resilient to the the ram pressure. The blue-shifted furthermost clumps of gas detected by WiFeS suggest a scenario where the disk screens off the detached gas which, being still bound, falls back into the disk. Such a complicated configuration is difficult to be reproduced by the simulations.
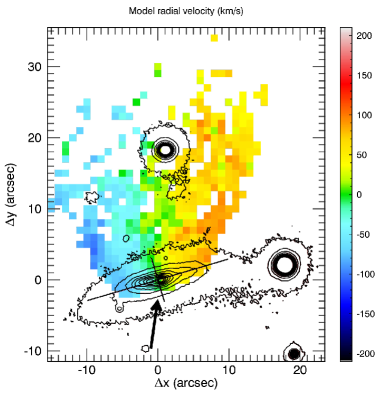
In the case of SOS 90630, we obtained the best match for , =750 km s-1 and g cm-3, which is shown in Fig. 27 after 120 Myr from the ram-pressure onset. For this galaxy, we are not able with the simulations to reproduce both the tail in its whole extent and the observed truncation of the gas disk. When in the simulations the tail forms, the disk appears much more truncated than observed and the gas velocity field is not consistent with the observed one. Therefore RPS alone does not seem sufficient to produce the tail, and the help of another force is needed to pull the gas tail from the disk.
Gavazzi et al. (2001) and Vollmer et al. (2005) studied two cases in which the ram pressure was aided by TI in forming the gas tails of two galaxies in A 1367 and Virgo. The role of TI is, in their cases, to loosen the restoring force of the galaxy thus making RPS more effective. SOS 90090, the massive galaxy close in projection to SOS 90630, could in principle induce such a tidal disturbance. To investigate this possibility, we estimate the acceleration produced by SOS 90090 on the ISM of SOS 90630 and compare it with the acceleration from the potential of SOS 90630 itself, , following Vollmer et al. (2005). We have
where is the distance from the centre of SOS 90630 and is the distance between the galaxies (Vollmer et al., 2005). As a proxy of the mass ratio we use the stellar mass ratio, but of course we don’t know . In the special case in which projected and true distance coincide (both galaxies in the plane of sky), the above equation would imply that the tidal force begins to dominate over the restoring force at 18 kpc, which is the projected distance where the gas tail begins. At three disc scale radii (8.5 kpc), the above ratio is 0.17, which shows that the tidal force might be able to produce some perturbation also in the disk, as is possibly observed in the structure of the external SE disc (see Fig.4).
This is a very crude approach, however, since i) it is most probable that the distance between the galaxies is larger; ii) the above formula is just a rough approximation; and iii) we definitely lack the knowledge of the orbits of the two galaxies (e.g. they might have been closer in the past). On the other hand, in the light of the cases quoted above, TI does not need to be the only or dominant mechanism to produce the tail, but only strong enough to ‘help’ the ram pressure, and this might well be the case unless the two galaxies are very distant in space. We finally notice that the direction of the gas tail is intermediate between the direction of the wind in the RPS simulation and the direction of SOS 90090, which could point to a collaborative role of the two mechanisms.
We can therefore conclude that the phenomenology of the ionized gas is explained in part by the ram-pressure acting close to edge-on and pushing the gas in the NW direction. For what concerns the tail, we can only argue that TI with SOS 90090 could have acted as an aid to the RPS.
The crown of star-forming regions suggests ram-pressure induced star formation due to the gas compression at the leading edge where the gas disc is truncated and the dust seems to be swept out. In fact, the age of the RPS is consistent with the burst of star formation, started 200 Myr ago and still ongoing. Star forming regions in the tail, foreseen in the simulations, are inferred by the H knots detected up to 40 kpc from the disc in the narrow-band imaging. However, our data do not allow to determine if these clumps origin from newly formed stars or stars stripped from the disc by the possible combined action of RPS and TI.
9.3 The role of cluster-cluster interaction
The dynamical analysis (Bardelli et al., 1994, 1998) and diffuse filamentary X-ray emission (Bardelli et al., 1996; Kull & Böhringer, 1999; Hanami et al., 1999) showed that the five clusters of the SSCC are interacting with recent and/or ongoing cluster-cluster mergers.
Finoguenov et al. (2004) proposed a tidal interaction between SC 1329-313 and A 3562 to explain the observed properties of the hot gas in A 3562 – the tailed shape of the X-ray emission associated with SC 1329-313 as well as the sloshing of the A 3562 core. In their scenario SC 1329-313 was initially flying North of A 3562 in the western direction and after passage at pericentre with A 3562 deflected South. This is also suggested by the X-ray structure of SC 1329-313 (see Fig. 1). Radio observations confirmed this scenario (Giacintucci et al., 2005). The western extension of the radio halo in A 3562 and the direction of the emission of J1332-3146a, a radio galaxy 150 kpc NE of SOS 61086 in projection, support the idea that merger-induced turbulence is present in the region between the centre of A 3562 and SC 1329-313. We further remark that the fan-shape tail radio emission of J1332-3146a follows the same direction of the outflowing ionised gas of SOS 61086, which is also a radio source. This particular similarity in shape and orientation between the two tails, although having different origins, may witness for the first time that cluster interactions trigger RPS events by perturbing the ICM.
SOS 90630 is member of SC 1327-312 which also may have interacted with A 3558 (e.g. Rossetti et al., 2007), but in this case a RPS event alone cannot explain the observations and another mechanism such as TI should be considered. It is interesting to notice that this galaxy can be easily identified as a jellyfish galaxy, i.e. the ‘perfect’ candidate of ongoing RPS.
10 Summary and Final Remarks
The present study investigates the ongoing transformations of two low-mass galaxies in poor cluster environments with the aim of understanding which are the mechanisms responsible. SOS 61086 and SOS 90630 have been selected from deep subarcsec-resolution imaging as promising candidates of ongoing gas stripping. Both have a possible companion which may also suggest a tidal interaction. We notice that this can often be the case in dense cluster environments, complicating the identification of ongoing ram-pressure stripping events.
From the analysis of multi-band data and IFS observations complemented by ad hoc hydrodynamical simulations we come to envision the following scenarios.
SOS 61086. The ionised gas distribution (truncated disc, 30 kpc tail) and velocity field together with the properties of the stellar component (unperturbed morphology and velocity field) support the RPS scenario. Star forming regions are found in the central disk, but also in the outflowing gas, as foreseen in case of RPS (Roediger et al., 201). In fact, the gas turns out to be manly photoionised throughout the galaxy and its tail. The dust is pushed by ram pressure, with the leading edge showing much lower attenuation.
Although some of these features can be suggestive also of TI, the hydrodynamical simulations of RPS well reproduce the overall gas velocity field with , =750 km s-1 and 250 Myr. It is encouraging that the time of the onset of ram pressure agrees with the age of the young stellar populations ( Myr). As in SOS 114372 (Merluzzi et al., 2013) we are very likely observing ram-pressure induced star formation. All this supports a scenario where ongoing RPS is the dominant mechanism at work.
SOS 90630. The most distinctive features of this galaxy are the very long (41 kpc) tail of ionised gas and the truncated gaseous disk. The attenuation is lower on the leading edge of the disk and star formation could be present in the tail. In this case the ram pressure explains the truncation of the gas disk, is consistent with the distribution of dust and star formation, while RPS and TI with SOS 90090 are responsible for the long gas tail.
We notice that both galaxies are members of interacting clusters, suggesting that these systems can trigger RPS events by perturbing the ICM. Finally, this work provides another clear proof that RPS can take place in very different environments from cluster cores to cluster outskirts, from rich clusters to poor ones, affecting in various ways galaxies of different masses.
10.1 Final remarks
All simulations of RPS indicate that it should be very efficient in quenching star formation of cluster galaxies, but its effects depend on ICM and ISM properties, which may easily change locally, as well as on the galaxy orbits. All together these parameters contribute to determine case-by-case what fraction of gas is stripped from the galaxy and over what time-scales. In fact, there are events where the ICM-ISM interaction is not able to strip all the gaseous reservoir of a galaxy and then definitely quench its star formation. Which is the impact of RPS on the evolution of cluster/group galaxies?
At present only a few tens of ongoing RPS events have been ascertained and studied in detail, most of these galaxies belong to nearby clusters with only a few cases found in clusters at intermediate redshift (e.g. Owen et al., 2005; Cortese et al., 2007; Crowl & Kenney, 2008; Vollmer et al., 2010; Yagi et al., 2010; Abramson & Kenney, 2014; Wong et al., 2014; Fossati et al., 2016; Boselli et al., 2016). Thus, the identification of new cases of galaxies experiencing RPS is definitely important. One of the reasons for the small statistics are the intrinsic and observational biases such as the short time-scales and the observer’s point of view with respect to the galaxy trajectory. The latter particularly disadvantages the selection of RPS candidates based only on photometric data which allow us to recognize distorted morphology and to glimpse one-side extraplanar emission, but cannot identify other features such as the truncation of the gas disk and robust detection of extraplanar gas. In addition, this approach is not able at all to disentangle between the effects of TI and RPS, which might be similar.
Nevertheless, recently Poggianti et al. (2015) and McPartland et al. (2015) have undertaken a systematic search in two samples of nearby and intermediate-redshift clusters, respectively, using almost the same morphological criteria. They inferred that the morphologically selected galaxies are RPS candidates. Among the 13 galaxies of the Shapley supercluster observed with WiFeS because of hints of extraplanar emission from their images, 9 ( per cent) actually presented extraplanar ionised gas and only 4 ( per cent) turned out to be significantly affected by ram pressure. Thus, a certain caution is needed before drawing conclusions on the basis of samples of candidates. Ebeling et al. (2014) introduced three criteria to identify RPS candidates: disturbed morphology indicative of a unilateral external force’ ii) brightness knots and colour gradients suggesting bursts of star formation; iii) evidence of tails. If we adopt the criteria of Ebeling et al. (2014) to identify RPS candidates in our spectroscopic sample of supercluster galaxies (80 per cent complete at m⋆+3, ), we find that 0.5 per cent follows all the Ebeling et al.’s criteria in full agreement with the 0.6 per cent found by Ebeling et al. (2014)999Once accounted for the non cluster members, i.e. 57 per cent of the selected galaxies by Ebeling et al. (2014).. If we adopt at least two of the three Ebeling et al.’s criteria and apply our success percentage of the 30 per cent, we expect to identify about 25 cases of ongoing RPS in the whole ShaSS survey (11 clusters covering 23 sqdeg) which would be a significant increase in the number of known ongoing RPS events. Although such a large number is supported by the hypothesis that RPS is triggered by cluster mergers (Owers et al., 2012), only a campaign of IFS observations (or HI for nearby clusters) can confirm this indicative conjecture and this is the project we are carrying out with WiFeS.
Acknowledgments
We thank the referee for the comments and corrections which improved the presentation of our work. The authors thank Volker Springel for providing the simulation code AREPO and Tiziana Venturi for her help with the interpretation of the radio data. The optical imaging is collected at the VLT Survey Telescope using the Italian INAF Guaranteed Time of Observations and reduced by A. Grado and L. Limatola. CPH was funded by CONICYT Anillo project ACT-1122. PM and GB acknowledge financial support from PRIN-INAF2014: Galaxy Evolution from Cluster Cores to Filaments (PI B.M. Poggianti). MAD acknowledges the support of the Australian Research Council (ARC) through Discovery Project DP130103925, and he would also like to thank the Deanship of Scientific Research (DSR), King Abdulaziz University for additional financial support as Distinguished Visiting Professor under the KAU Hi-Ci program. DS acknowledges the support from the Austrian Federal Ministry of Science, Research and Economy as part of the UniInfrastukturprogramm of the Focal Point Scientific Computing at the University of Innsbruck.
References
- Abadi et al. (1999) Abadi M. G., Moore B., Bower R. G., 1999, MNRAS, 308, 947
- Abramson & Kenney (2014) Abramson A., Kenney J. D. P., 2014, AJ, 147, 63
- Abramson et al. (2011) Abramson A., Kenney J. D. P., Crowl H. H., Chung A., van Gorkom J. H., Vollmer B., Schiminovich D., 2011, AJ, 141, 164
- Baes et al. (2003) Baes M., Davies J. I., Dejonghe H., Sabatini S., Roberts S., Evans R., Linder S. M., Smith R. M., de Blok W. J. G., 2003, MNRAS, 343, 1081
- Bahé et al. (2013) Bahé Y. M., McCarthy I. G., Balogh M. L., Font A. S., 2013, MNRAS, 430, 3017
- Baldwin et al. (1981) Baldwin J. A., Phillips M. M., Terlevich R., 1981, PASP, 93, 5
- Bamford et al. (2009) Bamford S. P., Nichol R. C., Baldry I. K., Land K., Lintott C. J., et al. 2009, MNRAS, 393, 1324
- Bardelli et al. (1998) Bardelli S., Pisani A., Ramella M., Zucca E., Zamorani G., 1998, MNRAS, 300, 589
- Bardelli et al. (1996) Bardelli S., Zucca E., Malizia A., Zamorani G., Scaramella R., Vettolani G., 1996, A&A, 305, 435
- Bardelli et al. (1994) Bardelli S., Zucca E., Vettolani G., Zamorani G., Scaramella R., Collin C. A., MacGillivray H. T., 1994, MNRAS, 267, 665
- Bardelli et al. (1998) Bardelli S., Zucca E., Zamorani G., Vettolani G., Scaramella R., 1998, MNRAS, 296, 599
- Barnes & Hernquist (1992) Barnes J. E., Hernquist L., 1992, ARA&A, 30, 705
- Barnes & Hernquist (1996) Barnes J. E., Hernquist L., 1996, ApJ, 471, 115
- Barnes & Hernquist (1991) Barnes J. E., Hernquist L. E., 1991, ApJ, 370, 65L
- Bekki (2001) Bekki K., 2001, ApJ, 546, 189
- Bekki (2014) Bekki K., 2014, MNRAS, 438, 444
- Boselli et al. (2016) Boselli A., Cuillandre J. C., Fossati M., Boissier S., Bomans D., Consolandi G., Anselmi G., Cortese L., Côté P., Durrell P., Ferrarese L., Fumagalli M., Gavazzi G., Gwyn S., Hensler G., Sun M., Toloba E., 2016, A&A, 587, A68
- Boselli & Gavazzi (2006) Boselli A., Gavazzi G., 2006, PASP, 118, 517
- Bourdin & Mazzotta (2008) Bourdin H., Mazzotta P., 2008, A&A, 479, 307
- Bourdin et al. (2013) Bourdin H., Mazzotta P., Markevitch M., Giacintucci S., Brunetti G., 2013, ApJ, 764, 82
- Bournaud et al. (2004) Bournaud F., Duc P.-A., Amram P., Combes F., Gach J.-L., 2004, A&A, 425, 813
- Byrd & Valtonen (1990) Byrd G., Valtonen M., 1990, ApJ, 350, 89
- Cardelli et al. (1989) Cardelli J. A., Clayton G. C., Mathis J. S., 1989, ApJ, 345, 245
- Christlein & Zabludoff (2004) Christlein D., Zabludoff A. I., 2004, ApJ, 616, 192
- Chung et al. (2009) Chung A., van Gorkom J. H., Kenney J. D. P., Crowl H., Vollmer B., 2009, AJ, 138, 1741
- Chung et al. (2007) Chung A., van Gorkom J. H., Kenney J. D. P., Vollmer B., 2007, ApJ, 659, L115
- Cortese et al. (2007) Cortese L., Marcillac D., Richard J., Bravo-Alfaro H., Kneib J.-P., Rieke G., Covone G., Egami E., Rigby J., Czoske O., Davies J., 2007, MNRAS, 376, 157
- Cowie & Songalia (1977) Cowie L. L., Songalia A., 1977, Nature, 266, 501
- Crowl & Kenney (2008) Crowl H. H., Kenney J. D. P., 2008, AJ, 136, 1623
- Di Cintio et al. (2014) Di Cintio A., Brook C. B., Dutton A. A., Macciò A. V., Stinson G. S., Knebe A., 2014, MNRAS, 441, 2986
- Di Matteo et al. (2008) Di Matteo P., Bournaud F., Martig M., Combes F., Melchior A.-L., Semelin B., 2008, A&A, 492, 31
- Diehl & Statler (2006) Diehl S., Statler T. S., 2006, MNRAS, 368, 497
- Domainko et al. (2006) Domainko W., Mair M., Kapferer W., van Kampen E., Kronberger T., Schindler S., Kimeswenger S., Ruffert M., Mangete O. E., 2006, A&A, 452, 795
- Dopita et al. (2007) Dopita M., Hart J., McGregor P., Oates P., Bloxham G., Jones D., 2007, ApSS, 310, 255
- Dopita et al. (2010) Dopita M., Rhee J., Farage C., McGregor P., Bloxham G., Green A., Roberts B., Neilson J., Wilson G., Young P., Firth P., Busarello G., Merluzzi P., 2010, ApSS, 327, 245
- Dopita et al. (2013) Dopita M. A., Sutherland R. S., Nicholls D. C., Kewley L. J., Vogt F. P. A., 2013, ApJS, 208, 10
- Dressler (1980) Dressler A., 1980, ApJ, 236, 351
- Ebeling et al. (2014) Ebeling H., Stephenson L. N., Edge A. C., 2014, ApJ, 781, L40
- Finoguenov et al. (2004) Finoguenov A., Henriksen M. J., Briel U. G., de Plaa J., Kaastra J. S., 2004, ApJ, 611, 811
- Fischera & Dopita (2005) Fischera J., Dopita M., 2005, ApJ, 619, 340
- Fossati et al. (2016) Fossati M., Fumagalli M., Boselli A., Gavazzi G., Sun M., Wilman D. J., 2016, MNRAS, 455, 2028
- Fujita & Nagashima (1999) Fujita Y., Nagashima M., 1999, ApJ, 516, 619
- Fumagalli et al. (2014) Fumagalli M., Fossati M., Hau G. K. T., Gavazzi G., Bower R., Sun M., Boselli A., 2014, MNRAS, 445, 4335
- Gavazzi et al. (2001) Gavazzi G., Boselli A., Mayer L., Iglesias-Paramo J., Vílchez J. M., Carrasco L., 2001, ApJ, 563, L23
- Giacintucci et al. (2005) Giacintucci S., Venturi T., Brunetti S., Bardelli S., Dallacasa D., Ettori S., Finoguenov A., Rao A. P., Zucca E., 2005, A&A, 440, 867
- Giovanelli & Haynes (2002) Giovanelli R., Haynes M. P., 2002, ApJ, 571, L107
- Graham & Worley (2008) Graham A. W., Worley C. C., 2008, MNRAS, 388, 1708
- Grevesse & Sauval (1998) Grevesse N., Sauval A. J., 1998, S.S.Review, 85, 161
- Gunn & Gott (1972) Gunn J. E., Gott J. R. I., 1972, ApJ, 176, 1
- Haines et al. (2011) Haines C. P., Busarello G., Merluzzi P., Smith R. J., Raychaudhury S., Mercurio A., Smith G. P., 2011, MNRAS, 412, 127
- Haines et al. (2006) Haines C. P., Merluzzi P., Mercurio A., Gargiulo A., Krusanova N., Busarello G., La Barbera F., Capaccioli M., 2006, MNRAS, 371, 55
- Hanami et al. (1999) Hanami H., Tsuru T., Shimasaku K., Yamauchi S., Ikebe Y., Koyama K., 1999, ApJ, 521, 90
- Hayward et al. (2014) Hayward C. C., Torrey P., Springel V., Hernquist L., Vogelsberger M., 2014, MNRAS, 442, 1992
- Hernquist (1990) Hernquist L., 1990, ApJ, 356, 359
- Heß & Springel (2012) Heß S., Springel V., 2012, MNRAS, 426, 3112
- James et al. (2008) James P. A., Prescott M., Baldry I. K., 2008, A&A, 484, 703
- Kapferer et al. (2009) Kapferer W., Sluka C., Schindler S., Ferrari C., Ziegler B., 2009, A&A, 499, 87
- Katz et al. (1996) Katz N., Weinberg D. H., Hernquist L., 1996, ApJ, 105, 19
- Kauffmann et al. (2003) Kauffmann G., Heckman T. M., Tremonti C., Brinchmann J., Charlot S., et al. 2003, MNRAS, 346, 1055
- Keel et al. (1985) Keel W. C., Kennicutt Jr. R. C., Hummel E., van der Hulst J. M., 1985, AJ, 90, 708
- Kenney et al. (2014) Kenney J. D. P., Geha M., Jáchym P., Crowl H. H., Dague W., Chung A., van Gorkom J., Vollmer B., 2014, ApJ, 780, 119
- Kenney et al. (2004) Kenney J. D. P., van Gorkom J. H., Vollmer B., 2004, AJ, 127, 3361
- Kennicutt (1983) Kennicutt Jr. R. C., 1983, ApJ, 272, 54
- Kennicutt (1998) Kennicutt Jr. R. C., 1998, ApJ, 498, 541
- Kennicutt & Keel (1984) Kennicutt Jr. R. C., Keel W. C., 1984, ApJ, 279, L5
- Kennicutt et al. (1994) Kennicutt Jr. R. C., Tamblyn P., Congdon C. E., 1994, ApJ, 435, 22
- Kewley et al. (2006) Kewley L. J., Groves B., Kauffmann G., Heckman T., 2006, MNRAS, 372, 961
- Kewley et al. (2001) Kewley L. J., Heisler C. A., Dopita M. A., Lumsden S., 2001, ApJS, 132, 37
- Kormendy & Bender (2012) Kormendy J., Bender R., 2012, ApJSS, 198, 2
- Kregel et al. (2004) Kregel M., van der Kruit P. C., Freeman K. C., 2004, MNRAS, 351, 1247
- Kronberger et al. (2006) Kronberger T., Kapferer W., Schindler S., Böhm A., Kutdemir E., Ziegler B. L., 2006, A&A, 458, 69
- Kronberger et al. (2008) Kronberger T., Kapferer W., Unterguggenberger S., Schindler S., Ziegler B. L., 2008, A&A, 483, 783
- Kroupa (2001) Kroupa P., 2001, MNRAS, 322, 231
- Kull & Böhringer (1999) Kull A., Böhringer H., 1999, A&A, 341, 23
- Larson & Tinsley (1978) Larson R. B., Tinsley B. M., 1978, ApJ, 219, 46
- Larson et al. (1980) Larson R. B., Tinsley B. M., Caldwell C. M., 1980, ApJ, 237, 692
- Leonardi & Rose (1996) Leonardi A. J., Rose J. A., 1996, AJ, 111, 182
- Lewis et al. (2002) Lewis I., Balogh M., De Propris R., Couch W., Bower R., et al. 2002, MNRAS, 334, 673
- Marcolini et al. (2003) Marcolini A., Brighenti F., D’Ercole A., 2003, MNRAS, 345, 1329
- Mazzotta et al. (2004) Mazzotta P., Rasia E., Moscardini L., Tormen G., 2004, MNRAS, 354, 10
- McPartland et al. (2015) McPartland C., Ebeling H., Roediger E., Blumenthal K., 2015, ArXiv e-prints
- Mercurio et al. (2015) Mercurio A., Merluzzi P., Busarello G., Limatola L., Grado A., Haines C. P., Brescia M., Cavuoti S., Dall’Ora M., Dopita M. A., Capaccioli M., Napolitano N. R., Pimbblet K. J., 2015, MNRAS
- Mercurio et al. (2006) Mercurio A., Merluzzi P., Haines C. P., Gargiulo A., Krusanova N., Busarello G., La Barbera F., Capaccioli M., Covone G., 2006, MNRAS, 368, 109
- Merluzzi et al. (2013) Merluzzi P., Busarello G., Dopita M. A., Haines C. P., Steinhauser D., Mercurio A., Rifatto A., Smith R. J., Shindler S., 2013, MNRAS, 429, 174
- Merluzzi et al. (2015) Merluzzi P., Busarello G., Haines C. P., Mercurio A., Okabe N., Pimbblet K. J., Dopita M. A., Grado A., Limatola L., Bourdin H., Mazzotta P., Capaccioli M., Napolitano N. R., Schipani P., 2015, MNRAS, 446, 803
- Merluzzi et al. (2010) Merluzzi P., Mercurio A., Haines C. P., Smith R. J., Busarello G., Lucey J. R., 2010, MNRAS, 402, 753
- Miller (2005) Miller N. A., 2005, AJ, 130, 2541
- Mo et al. (1998) Mo H. J., Mao S., White S. D. M., 1998, MNRAS, 295, 319
- Moore et al. (1996) Moore B., Katz N., Lake G., Dressler A., Oemler A., 1996, Nature, 379, 613
- Moran et al. (2007) Moran S. M., Miller N., Treu T., Ellis R. S., Smith G. P., 2007, ApJ, 659, 1138
- Nulsen (1982) Nulsen P. E. J., 1982, MNRAS, 192, 1007
- Oh et al. (2008) Oh S. H., Kim W.-T., Lee H. M., Kim J., 2008, ApJ, 683, 94
- Owen et al. (2005) Owen F. N., Ledlow M. J., Keel W. C., Wang Q. D., Morrison G. E., 2005, AJ, 129, 31
- Owers et al. (2012) Owers M. S., Couch W. J., Nulsen P. E. J., Randall S. W., 2012, ApJ, 750, L23
- Peng et al. (2010) Peng C. Y., Ho L. C., Impey C. D., Rix H.-W., 2010, AJ, 139, 2097
- Poggianti et al. (2015) Poggianti B. M., Fasano G., Omizzolo A., Gullieuszik M., Bettoni D., Moretti A., Paccagnella A., Jaffe’ Y. L., Vulcani B., Fritz J., Couch W., D’Onofrio M., 2015, ArXiv e-prints
- Ragone et al. (2006) Ragone C. J., Muriel H., Proust D., Reisenegger A., Quintana H., 2006, A&A, 445, 819
- Roediger & Brüggen (2006) Roediger E., Brüggen M., 2006, MNRAS, 369, 567
- Roediger et al. (201) Roediger E., Brüggen M., Owers M. S., Ebeling H., Sun M., 201, MNRAS, 443, L114
- Roediger & Hensler (2005) Roediger E., Hensler G., 2005, A&A, 433, 875
- Rose (1985) Rose J. A., 1985, AJ, 90, 1927
- Rossetti et al. (2007) Rossetti M., Ghizzardi S., Molendi S., Finoguenov A., 2007, A&A, 463, 839
- Sánchez-Blázquez et al. (2006) Sánchez-Blázquez P., Peletier R. F., Jiménez-Vicente J., Cardiel N., Cenarro A. J., Falcón-Barroso J., Gorgas J., Selam S., Vazdekis A., 2006, MNRAS, 371, 703
- Schlafly & Finkbeiner (2011) Schlafly E. F., Finkbeiner D. P., 2011, ApJ, 737, 103
- Schlegel et al. (1998) Schlegel D. J., Finkbeiner D. P., Davis M., 1998, ApJ, 500, 525
- Smith et al. (2001) Smith R. K., Brickhouse N. S., Liedahl D. A., Raymond J. C., 2001, ApJL, 556, L91
- Springel (2010) Springel V., 2010, MNRAS, 401, 791
- Springel et al. (2005) Springel V., Di Matteo T., Hernquist L., 2005, MNRAS, 361, 776
- Springel & Hernquist (2003) Springel V., Hernquist L., 2003, MNRAS, 339, 289
- Steinhauser et al. (2012) Steinhauser D., Haider M., Kapferer W., Schindler S., 2012, A&A, 544, A54
- Sun et al. (2007) Sun M., Donahue M., Voit G. M., 2007, ApJ, 671, 190
- Taylor et al. (2011) Taylor E. N., Hopkins A. M., Baldry I. K., Brown M. J. I., Driver S. P., Kelvin L. S., Hill D. T., Robotham A. S. G., et al. 2011, MNRAS, 418, 1587
- Teyssier et al. (2010) Teyssier R., Chapon D., Bournaud F., 2010, ApJ, 720, L149
- Tonnesen & Bryan (2010) Tonnesen S., Bryan G. L., 2010, ApJ, 709, 1203
- Tonnesen & Bryan (2012) Tonnesen S., Bryan G. L., 2012, MNRAS, 422, 1609
- Toomre & Toomre (1972) Toomre A., Toomre J., 1972, ApJ, 178, 623
- Valotto & Giovanelli (2004) Valotto C., Giovanelli R., 2004, AJ, 128, 115
- Vazdekis et al. (2010) Vazdekis A., Sánchez-Blázquez P., Falcón-Barroso J., Cenarro A. J., Beasley M. A., Cardiel N., Gorgas J., Peletier R. F., 2010, MNRAS, 404, 1639
- Veilleux et al. (1999) Veilleux S., Bland-Hawthorn J., Cecil G., Tully R. B., Miller S. T., 1999, ApJ, 520, 111
- Veilleux & Osterbrock (1987) Veilleux S., Osterbrock D. E., 1987, ApJS, 63, 295
- Veilleux et al. (2010) Veilleux S., Weiner B. J., Rupke D. S. N., McDonald M., Birk C., Bland-Hawthorn J., Dressler A., Hare T., Osip D., Pietraszewski C., Vogel S. N., 2010, AJ, 139, 145
- Vikhlinin et al. (2006) Vikhlinin A., Kravtsov A., Forman W., Jones C., Markevitch M., Murray S. S., Van Speybroeck L., 2006, ApJ, 640, 691
- Vogelsberger et al. (2012) Vogelsberger M., Sijacki D., Kereš D., Springel V., Hernquist L., 2012, MNRAS, 425, 3024
- Vollmer et al. (2005) Vollmer B., Braine J., Combes F., Sofue Y., 2005, A&A
- Vollmer et al. (2005) Vollmer B., Huchtmeier W., van Driel W., 2005, A&A
- Vollmer et al. (2010) Vollmer B., Soida M., Chung A., Beck R., Urbanik M., Chyży K. T., Otmianowska-Mazur K., van Gorkom J. H., 2010, A&A, 512, 36
- Williams et al. (2011) Williams B. F., Dalcanton J. J., Johnson L. C., Weisz D. R., Seth A. C., Dolphin A., Gilbert K. M., Skillman E., Rosema K., Gogarten S. M., Holtzman J., de Jong R. S., 2011, ApJ, 734, L22
- Wong et al. (2014) Wong O. I., Kenney J. D. P., Murphy E. J., Helou G., 2014, ApJ, 783, 109
- Woods et al. (2006) Woods D. F., Geller M. J., Barton E. J., 2006, aj, 132, 197
- Yagi et al. (2013) Yagi M., Gu L., Fujita Y., Nakazawa K., Akahori T., Hattori T., Yoshida M., Makishima K., 2013, ApJ, 778, 91
- Yagi et al. (2007) Yagi M., Komiyama Y., Yoshida M., Furusawa H., Kashikawa N., Koyama Y., Okamura S., 2007, ApJ, 660, 1209
- Yagi et al. (2010) Yagi M., Yoshida M., Komiyama Y., Kashikawa N., Furusawa H., Okamura S., Graham A. W., Miller N. A., Carter D., Mobasher B., Jogee S., 2010, AJ, 140, 1814
- Yoshida et al. (2012) Yoshida M., Yagi M., Komiyama Y., Furusawa H., Kashikawa N., Hattori T., Okamura S., 2012, ApJ, 749, 43
Appendix A The origin of the double peak of luminosity in SOS 90630
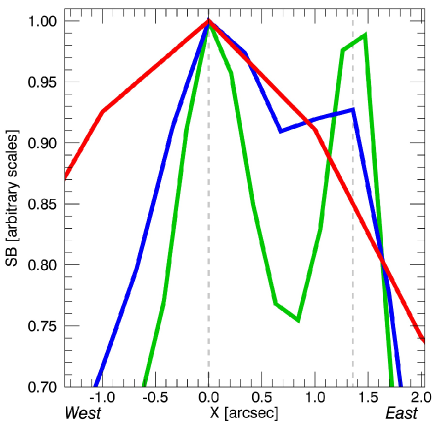
The optical () images of SOS 90630 in Fig 4 present two peaks of luminosity in the centre suggesting the presence of two nuclei which are not distinguishable in the -band image. To understand whether this might originate from dust absorption, we downgraded the -band image (FWHM=0.64 arcsec, 0.21 arcsec pxl-1) to mimic the resolution and sampling in the band (FWHM=1.1 arcsec, 0.339 arcsec pxl-1).
Figure 28 shows the surface brightness profiles along a line joining the two maxima in the band (incidentally, this line coincides with the apparent major axis in the -band image of the galaxy). The green curve is the original profile in band, the blue curve is the profile in the same band after downgrading, and the red curve is the -band profile. All profiles are arbitrarily normalized to the maximum in band. It is clear that even with the downgraded resolution the separation of the two ‘nuclei’ persists in the -band profile, while in band there is instead only one clear maximum with a fairly symmetric distribution around it. The minimum of the -band SB is located about 0.75 arcsec East from the nucleus. To explain the different profiles between optical and NIR, we should also assume that the western side (left in the figure) is more dust-attenuated than the eastern one. In Sect. 7.3 we show that this is the case. We therefore conclude that the appearance of a ‘double nucleus’ is caused by dust absorption.