Translational symmetry breaking and the disintegration of the Hofstadter butterfly
Abstract
We study the effect of interactions on the Hofstadter butterfly of the honeycomb lattice. We show that the interactions induce charge ordering that breaks the translational and rotational symmetries of the system. These phase transitions are prolific and occur at many values of the flux and particle density. The breaking of the translational symmetry introduces a new length scale in the problem and this affects the energy band diagram resulting in the disintegration of the fractal structure in the energy flux plot, the Hofstadter butterfly. This disintegration increases with increase in the interaction strength. Many of these phase transitions are accompanied with change in the Hall conductivity. Consequently, the disintegration of the Hofstadter butterfly is manifested in the Landau fan diagram also.
pacs:
71.10.Fd, 71.27.+a, 71.30.+hI Introduction
The two dimensional electron gas (2DEG) in the presence of magnetic field has been of special interest to the condensed matter physicists since the discovery of the quantum Hall effect Klitzing et al. (1980) and the fractional quantum Hall effect Tsui et al. (1982). The 2DEG in a periodic potential and magnetic field has been the cradle of several interesting and important theoretical concepts like the identification of a topological invariant with the Hall conductivity Thouless et al. (1982); Kohmoto (1985) and the existence of a fractal structure in the energy gaps, the Hofstadter butterfly Hofstadter (1976); Wannier (1978). Interest in this phenomenon has been recently revived with the experimental observation of the Hofstadter butterfly in graphene superlattices Ponomarenko et al. (2013); Dean et al. (2013); Hunt et al. (2013); Yu et al. (2014a, b) and the realization of the Hofstadter Hamiltonian in the optical lattice systems Aidelsburger et al. (2013); Miyake et al. (2013). This has motivated us to study the effect of interactions on the Hofstadter butterfly.
The Hofstadter butterfly emerges from the interplay of two length scales in the lattice systems: the periodicity of the lattice and the magnetic length Hofstadter (1976); Wannier (1978); MacDonald (1983). It is an effect that emerges when we look at the single particle energy gaps and Hall conductivities of a large number of physical systems, in principle, an infinite number of systems with flux per plaquette, , where are co-prime integers and . For non-interacting systems with fermion densities corresponding to filled bands, the gaps exhibit a self similar structure. Further, if the Hall conductivities, in units of are plotted as a function of and the number of fermions per unit cell, the contours with the same Hall conductivities are straight lines with integer intercepts. The Hall conductivity of each contour and the intercept are solutions of a Diophantine equation. This plot, the Landau fan diagram, is the experimental evidence of the Hofstadter butterfly in graphene superlattices Ponomarenko et al. (2013); Dean et al. (2013); Hunt et al. (2013); Yu et al. (2014a, b).
Interaction can induce charge ordering that can break the translational symmetry of the system. Interaction induced translational symmetry breaking phases have been studied previously in the honeycomb lattice in the absence of magnetic field Weeks et al. (2010); Hou et al. (2010); Castro et al. (2011); Grushin et al. (2013). Effect of interactions on the Hofstadter butterfly has been studied in the past using mean field approximation in both square lattice Gudmundsson and Gerhardts (1995); Doh and Salk (1998) and honeycomb lattice (for Dirac fermions)Apalkov and Chakraborty (2014); Chakraborty and Apalkov (2013). Electron electron interaction in square lattice in magnetic field has also been studied using exact diagonalization method Czajka et al. (2006). However, none of these past works consider translational symmetry breaking and its effect on the fractal structure of the Hofstadter butterfly. Moreover, the effect of interactions on the experimental probe of the Hofstadter butterfly, the Landau fan diagram, has not been mentioned in previous work.
In interacting systems, the translational symmetry breaking introduces a third length scale in the problem which can affect the self similarity of the Hofstadter butterfly. In this paper, we investigate whether this actually happens. In our recent paper Mishra et al. (2016), we had studied the effect of interaction in one of the many systems required to realize the Hofstadter butterfly in honeycomb lattice, lattice with flux per plaquette (in units of ). We studied the interaction induced translational symmetry broken phases in the Hofstadter regime of the honeycomb lattice for this flux value. In this paper, we study the effect of interactions on the spinless fermions of the honeycomb lattice in the presence of magnetic field such that the flux per plaquette is of the form where are co-prime integers. We consider fermion densities corresponding to filled bands and address following two questions: (i) How common are translation symmetry breaking transitions and how often are they accompanied by the change in the Hall conductivity ? (ii) Do they destroy the fractal structure ?
The rest of this paper is organized as follows: In Sec. II, we discuss the model and the phase transitions in the system due to the interactions. Sec. III, gives a brief review of the non-interacting Hofstadter butterfly in the honeycomb lattice and describes the self similarity of the fractal structure of the butterfly. The effect of interactions on the Hofstadter butterfly is described in Sec. IV. In Sec. V, the Landau fan diagram for both the non-interacting and interacting cases are discussed and compared. Finally, we conclude in Sec. VI.
II Model and phase transitions
The model we consider is spinless fermions on the honeycomb lattice in the Hofstadter regime with nearest neighbor hopping and nearest neighbor interaction. The Hamiltonian is
| (1) |
where is the annihilation (creation) operator for electrons at site on the honeycomb lattice, is the number density operator and is the nearest neighbor hopping parameter and is the nearest neighbor interaction strength. We consider and is in units of . are the gauge fields on the nearest neighbor links such that the magnetic flux passing through each plaquette is where are co-prime integers with and . We refer different values of flux per plaquette as different systems. For the range of considered in this paper, there are flux values in total and thus systems. For each of these systems, we solve the interacting problem for the filled band cases only. Hence, for a particular interaction strength, we have cases in total.
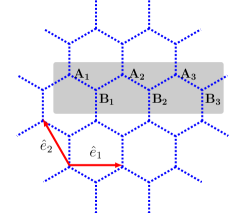
The Hamiltonian is invariant under magnetic translations and which are along and directions respectively. . We choose the magnetic unit cell to be adjoining original unit cells along the direction as shown in Fig. 1 for . Each magnetic unit cell contains sites. Other symmetries of the system are 6-fold rotations about the centers of the hexagons, 3-fold rotations about the sites and 2-fold rotations (inversion) about the centers of the links. At half filling, the system also has particle-hole (chiral) symmetry, , where for belonging to one of the sublattices and for the other.
The Brillouin zone is the set of wave vectors , where are the reciprocal lattice vectors of the underlying triangular lattice with and .
To solve this interacting problem, we use mean field approximation discussed in our previous work Mishra et al. (2016),
| (2) | ||||
| (3) |
where denotes all the nearest neighbors of . The self consistency equations, Eq. (3), have to be solved keeping the number density fixed. We solve them numerically for interaction strength . For each flux value , there are complex bond order parameters and real charge order parameters.
The choice of the magnetic unit cell is not unique. For the non-interacting case, when the translation symmetry is not broken, the choice of the unit cell is irrelevant. For the interacting case, the choice of unit cell matters. It determines the pattern of the translation symmetry breaking. With increasing , the number of distinct magnetic unit cell choices increase and it is not feasible to solve all the possibilities numerically. We restrict ourselves to the linear magnetic unit cell choice, as shown in Fig. 1 for . There could be phases with other patterns of translation symmetry breaking with lower energy and they could appear at lower values of the interaction strength. Our analysis thus underestimates the effects of the interactions.
We work with a lattice of magnetic unit cells and a fixed number of particles corresponding to a particular band filling. The self consistency equations are solved for filled bands till half filling. The self consistency solutions for the upper half filling cases is same as the lower half due to particle hole symmetry.
We solve the mean field Hamiltonian for these cases for the interaction strength . We observe that for , of the cases show phase transitions and of the cases show topological transitions, for , of the cases show phase transitions and of the cases show topological transitions and for , of the cases show phase transitions and of the cases have topological transitions. Hence, we see that even for interaction strength significant number of cases show phase transitions and topological phase transitions which increases with increase in the interaction strength.
Fig.2 shows the probability of phase transitions, , and topological phase transitions, , as a function of the filling fraction, . is defined as the number of systems with filling between and that show phase transitions (topological transitions) divided by the total number of systems with filling between and . In Fig.2, we have taken .
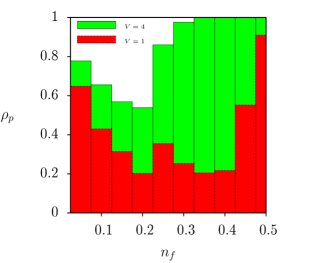
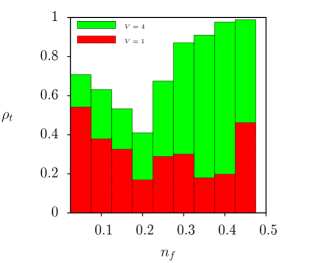
Fig.2 shows that the number of phase transitions peak at half filling and at the dilute limit. As expected the number increases with increase in the interaction strength. The peak near half-filling seems intuitively reasonable, since the inter-particle distance decreases with increasing particle density and so the effect of the nearest neighbor interaction increases. However, by the above reasoning, there should be minimum number of phase transitions in the dilute limit, quite contrary to what we see in Fig.2.
The answer to this puzzle comes from examining the energy bands of the non-interacting system. We observe that for flux per plaquette , at low filling, bands come close to each other and the energy gap between these bands decreases with the increase in . Since the band gaps tend to become low in these regions for the systems with larger , it is easier for the interaction to mix the bands leading to the transitions. Near half filling bands bunch up and tend to get degenerate at large . Fig. 3 illustrates this for flux value . In the Fermi regime, the energy gap between the lowest two bands in Fig. 3 is very small and are bunched together. These gaps become negligible as increases. Similarly, the four energy bands near the half filling, the Dirac regime, bunch together as can be seen from the Fig. 3. On increasing , these bands become degenerate.
This phenomenon of bands bunching as increases can be understood by examining two extreme limits of this problem: (i) Hofstadter regime (small ) (ii) Weak field limit (). At small , we typically have well separated bands, each of them contributing a particle density of per unit cell, when completely filled.
At large , we can analyze the system in the continuum limit, separately for the dilute limit and near half-filling. In the dilute limit, the system behaves like a single species of non-relativistic fermions in a magnetic field. The spectrum in this regime, dubbed as the Fermi regime by Hatsugai et. al. Hatsugai et al. (2006), consists of Landau levels each contributing a particle density of per unit cell, when completely filled. Thus we may expect of the bands to become degenerate in the weak field limit, consistent with the bunching that we observe.
Near half-filling is the so called Dirac regime Hatsugai et al. (2006). Here the system behaves like two species of Dirac quasiparticles. The spectrum consists of relativistic Landau levels. Since there are two species, each Landau level has a particle density of . Thus in this regime we expect a bunching of bands with increasing , which form the degenerate Landau level in the limit.
From the above argument, we also expect the Chern number of the bunch of bands to sum up to 1 in the dilute limit and that of the bunch of bands to sum up to 2 near half-filling. We have computed the Chern numbers numerically and have found that this is indeed true.
III Self similar structure of the non-interacting Hofstadter butterfly in honeycomb lattice
Before describing the effect of interactions on the Hofstadter butterfly, we briefly review its fractal structure for the non-interacting honeycomb lattice. In this section, we also show that the range of we are considering is large enough to see the self similarity to first order, namely the first step of the recursion.
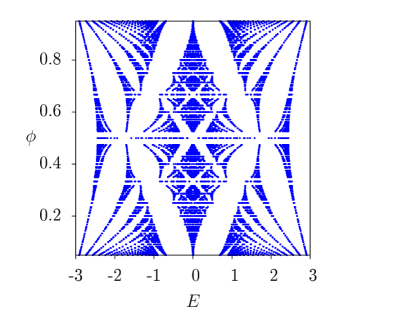
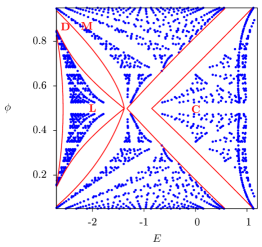
The Hofstadter butterfly for the non-interacting honeycomb lattice Rammal (1985); Gumbs and Fekete (1997); Goldman (2009); Claro and Wannier (1979) is shown in Fig. 4. This plot is self similar, in the sense that there is a mapping of the whole plot into a block in the plot which is described in detail in this section. When this block is suitably scaled and rotated, it reproduces the original plot. We describe the recursion below.
First we construct the so called ‘skeleton’ of the Hofstadter butterfly. We define of the form and for to be ‘pure cases’. The skeleton is formed from the set of curves constructed as described below: (a) Connect the outer edges of and band of neighboring pure cases for . This forms a huge box which we denote as the block. We divide this block into sub-blocks. These sub-blocks are the portions of the block between and flux values. We label these sub-blocks as as shown in Fig. 5a. (b) Connect the right outer edges of band and the left outer edges of the lowest band of neighboring pure cases for . This forms a huge box which we denote as the block. The block is further divided into and sub-blocks. Connecting the right outer edges of the lowest band of the neighboring pure cases form the sub-block and connecting the left outer edge of the second lowest band and the right outer edge of the bands of the neighboring pure cases form the sub-block. This construction is shown in Fig. 5a.
The whole plot in a compressed form with some rotation is present inside each of the sub-blocks Rhim and Park (2012). This statement is quantified using a recursive relation from the original plot to the sub-blocks Rhim and Park (2012). In each of these sub-blocks, there is a local variable, , for flux per plaquette defined in terms of the variable representing the flux per plaquette of the original plot. For we define as . stands for the greatest integer less than or equal to . The recursive relation between and is given by Rhim and Park (2012)
| (4) |
Thus the local variable has values in like the flux in the original plot. Self-similarity requires that the number of energy bands and gaps at a value of in the original plot is the same as the number of energy bands and gaps at in each sub-block.
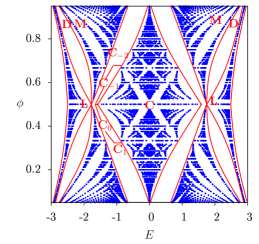
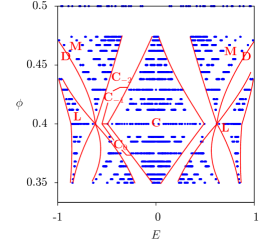
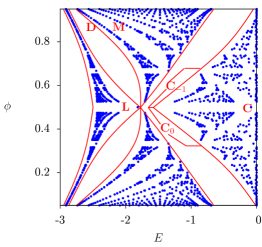
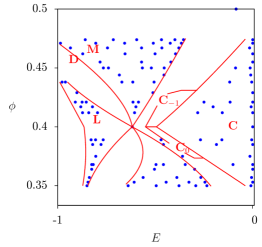
We now show that in the range is enough to verify the first step of the recursion . In Fig. 5a, the block has sub-blocks for the considered range of . Each value of in can be mapped to a value of using Eq. (4). Similar to , we can define ‘pure cases’ in . For example: ; in this case sub-block has bands which is the same number of bands for in original plot, ; here sub-block has bands which is the same number of bands for in original plots as seen in Fig. 5. In general, the number of bands for a particular value of in sub-block is same as that of in the original plot. Using the same method of constructing blocks in the original unit cell, as described before, we construct the secondary and blocks in the sub-block. This secondary block is further divided into sub-sub-blocks some of which are shown in Fig. 5b. We verify that each of these secondary blocks have the same number of energy bands and gaps and are arranged in similar fashion for a particular value of as the original plot for the same value of . Hence, the energy spectrum of the original plot is seen to be repeating in the sub-block and the self-similarity criterion is satisfied upto first order for the .
IV Effect of Interactions
The Hofstadter butterfly described in the previous section is defined for the non-interacting case in terms of the single particle energies and the single particle gaps. However, single particle energies are not defined for the interacting system. In presence of interactions, the well defined quantities are the many body ground state at each electron densities and the chemical potential at these number densities. In the non-interacting system, the chemical potential is the highest occupied single particle energy. Hence, in the interacting case, it is natural to plot the magnetic flux per plaquette with respect to the chemical potential for different fillings.
We solve this interacting problem using mean field theory. The mean field Hamiltonian, . can be defined as
| (5) |
where is a component vector with components . is the Fourier transform of the fermion operators and is defined as,
| (6) |
where is the fermionic operator that annihilates an electron at unit cell and sublattice index , is the total number of sites and Brillioun zone. is the single particle mean field Hamiltonian in the momentum space which is a matrix. The spectrum of is given by the eigenvalue equation
| (7) |
where is the single particle energy for the band and is its eigenfunction. is the fermionic operator that creates a fermion in the single particle state with quasi momentum vector in the band.
For filled bands, the mean field ground state can be written as
where is the vacuum state. The ground state energy is the sum of the single particle energies . If the state, is a good approximation of the single quasi-particle state, then the gap is the lowest single particle energy in the band, .
While this is often the case, it is not always so. For example, in the case of quantum Hall skyrmions Sondhi et al. (1993); Brey et al. (1993), the order parameter deforms locally when one electron is added to the system and the gap can get reduced by a factor of 2. When we solve our mean field equations for a dilute density of fermions in the band, we find that even for very small filling the mean field Hamiltonian and consequently the ground state changes significantly i.e is quite different from even for small . We feel that this may imply that the order parameters deform locally when an extra particle is added and hence that the mean field gap is not reliable. Exploring this issue in detail is ongoing work.
In this work, we consider only the filled band cases where the mean field theory is reliable. While we do not know the single particle energy gaps, nevertheless, we can take the band edge to be the single particle energy of the highest occupied level (which is the chemical potential). Hence, to investigate the effects of the interactions on the Hofstadter butterfly, we first plot the magnetic flux per plaquette versus the maximum energy of the band for the non-interacting case and show that this plot also shows the self-similar structure. We then compare it with the interacting case.
Fig. 6a is the plot for flux per plaquette versus the maximum energy of each band for the non-interacting case. The plot is restricted to half-filling here.
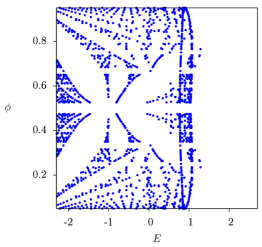
As seen in Fig. 6a, the plot is divided into blocks and (including and blocks). The block is further divided into sub-blocks where this pattern repeats itself as seen in Fig. 6b. In this case, the self similarity criterion is satisfied by verifying that the number of energy points for a particular value of in sub-block is same as that of = in the original plot. Fig. 6b is the plot of the Hofstadter butterfly in the absence of interaction for the flux in the range i.e. the sub-block of the block. For the range of considered in this paper, we verify that each of these secondary blocks have the same number of energy points and are arranged in similar fashion for a particular value of as the original plot for the same value of . Thus, we show that the recursive pattern is present even for plot of magnetic flux per plaquette versus the maximum energies of the bands upto first step.
Now we study the effect of the interaction on Fig. 6a. As described in our previous work Mishra et al. (2016), there is always a scaling solution for this interacting problem which satisfies the self consistency equations. The state corresponding to this solution is the same as the noninteracting case. However, the strength of the hopping parameters get scaled as and the single particle energies get scaled as where is the number of bands filled and . We call this the symmetric phase as all the symmetries of the system still remain intact in this phase. In this phase, the single particle energies just get scaled. But, these scalings are not uniform and depend on the bands filled. However, the band gap never closes and the whole fractal structure of the Hofstadter butterfly remains intact.
The recursive relations for the non-interacting case still remain valid for the symmetric phase. The plot can be divided into and blocks. Further, the block can be divided into sub-blocks and in each sub-blocks, the whole energy spectrum is repeated in a similar fashion as discussed in the non-interacting case.
The scaling solution is not always the minimum energy solution. As discussed in section II, there are a large number of flux values and filling fractions where there are phase transitions to translational symmetry broken states.
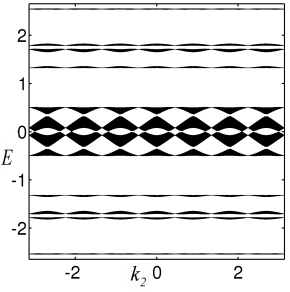
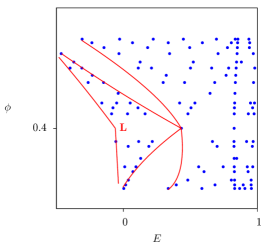
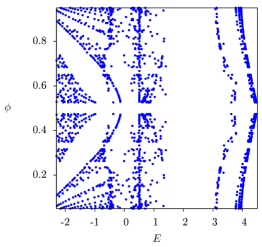
The plot for flux per plaquette versus the maximum energy of each band is given in Fig. 7 for and . As seen from Fig. 7a and Fig. 7b, for , the Hofstadter butterfly, like non-interacting case, can be divided into and blocks. Viewing a particular sub-block in block, as shown in Fig. 7b, we see that the form of the energy spectrum is not repeated inside this sub-block. Thus, the plot is not self-similar. For , a larger portion of the fractal structure gets destroyed compared to as seen from Fig. 7c.
The fact that the fractal structure increasingly disintegrates with the increase in the interaction strength is a consequence of the increase in the number of phase transitions with the increase in the interaction strength. The block contains energy bands near half filling which, as seen from Fig. 2, have very high probability of phase transitions which increases with . These phase transitions, except at exact half filling, break the translational symmetries of the system. Thus, the translational symmetry breaking phase transitions seem to play a crucial role in the destruction of the fractal structure. As we have stated earlier, this can be expected on the basis of general arguments.
For very dilute case, there are high number of phase transitions and they affect the block. However, in this case, for small value of interaction strength, the system is in symmetric phase for bands filled for flux as there is a comparatively high energy gap between the and band. Thus, these high energy gaps in the block still remains for small interaction strength and will slowly vanish with increase in the interaction strength.
V Landau fan diagram for the system in absence and presence of interactions
Experimental evidence for the Hofstadter butterfly has come from the Landau fan diagram. Each gap in the Hofstadter butterfly can be characterized by two integer topological invariants that satisfy the Diophantine equation MacDonald (1983); Goldman (2009)
| (8) |
where labels the gap and the flux passing per plaquette is , number of particles per unit cell is . where is the Hall conductivity at the gap and is the change in the electron density when there is an adiabatic change in the periodic potential MacDonald (1983). The plot of the Hall conductivity with respect to the number of particles per unit cell and the magnetic flux passing per plaquette is called the Landau fan diagram. Fig. 8 shows the Landau fan diagram for the non-interacting case.
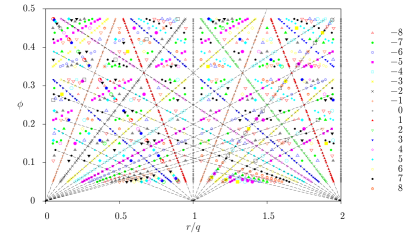
In Fig. 8, the points with the same Hall conductivities can be joined to give a straight line which when extrapolated meets the x-axis at an integer point. This intercept gives the value of whereas the slope gives the value of . In this figure, the colorbar is restricted to the values of from to for convenience in plotting; the maximum value of for non-interacting case for is . Hence, is enough to show and analyze the Landau fan diagram and realize that these topological invariants indeed satisfy the Diophantine equation.
As mentioned earlier, many of the Landau transitions are accompanied by topological transitions where the Hall conductivity of the system changes. In the presence of interactions, the topological phase transitions get reflected in the Landau fan diagram as shown in Fig. 9 for . Here the Landau fan diagram is plotted only for bands with non-trivial topology, i.e. removing the points with zero Hall conductivity. In Fig. 9a, for , though most of the points with the same Hall conductivities can be joined in a straight lines but there are some points in these lines which have different Hall conductivities. But in Fig. 9b, for , the points with the same Hall conductivities cannot be joined to form a straight line as most of the points are scattered. This is due to the topological transitions accompanied with the Landau phase transitions which increases with the increase in the interaction strength. Moreover, we can see that most of the region near half filling have a topological transition to zero Hall conductivity as shown in Fig. 9. This region also increases with the increase in the interaction strength. The maximum value of the Hall conductivity, considering all filled bands for all values of flux per plaquette of the form with , decreases with the increase of interaction strength. For example, in the absence of interactions, the maximum value of the Hall conductivity is , while for case of it is , for it is and for the maximum value of the Hall conductivity is .
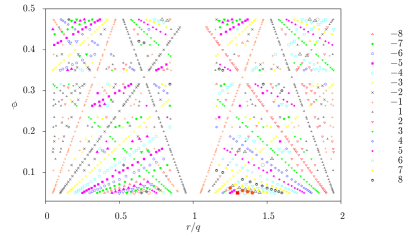
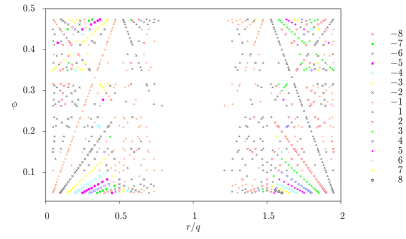
Hence, from Fig. 8 and Fig. 9, it is clear that due to the topological transitions accompanying the phase transitions to spatial symmetry breaking phases, the points with same Hall conductivity in the Landau fan diagram are more scattered and the number of transitions to zero Hall conductivity near the half filling increases as the interaction strength is increased. In addition, on using the same Diophantine equation as for the non-interacting case, no longer remains an integer. For example, for and , , so . Hence, the Diophantine equation used for the non-interacting case is no more valid in the presence of interactions.
VI Conclusions
We have studied spinless fermions on the honeycomb lattice with nearest neighbor hopping and nearest neighbor interaction in the presence of magnetic field. The magnetic flux per plaquette is of the form with being co-prime integers and , . We solve this interacting problem in the mean field approximation for the filled band cases. In particular, we look for translation symmetry broken phases and study the effect of these phase transitions on the Hofstadter butterfly and the Landau fan diagram.
We find that a large number of the systems at different values of flux and filling exhibit these transitions. Many of the transitions are also topological, i.e. the symmetry breaking is accompanied by a change in the Hall conductivity. When the number of transitions is plotted with respect to the filling factor, we find that they are peaked near the dilute limit and near half-filling. We have provided an explanation of this feature based on the bunching of bands in the non-interacting system. The number of these phase transitions increases with the increase in the interaction strength as expected.
The Hofstadter butterfly is generally understood as arising from the interplay of the two length scales in the system, the periodicity of the potential and the magnetic length. The translation symmetry breaking introduces a third length scale into the system and hence we expect a strong effect of it on the fractal structure. We have shown that this is indeed so. The self similarity structure of the energy spectrum disintegrates as a result of these transitions. The amount of disintegration increases with the strength of the interactions.
This result is with respect to the choice of the unit cell shown in Fig.1, corresponding to a particular pattern of translation symmetry breaking. In this choice, the translational symmetry is broken only in the direction. There could be states with different patterns of symmetry breaking with lower energy and hence for many fillings and flux values, the translation symmetry could break at a smaller interaction strength than our case. Thus if all patterns of translation symmetry breaking were taken into account, we may expect the Hofstadter butterfly to disintegrate at lower interaction strengths than shown in this work.
Landau fan diagram is the experimental manifestation of the Hofstadter butterfly. We show that the change in the Hall conductivity in the transitions gets reflected in the Landau fan diagram. The points with same Hall conductivity no longer lie in a straight line and are rather scattered. On increasing the interaction strength, there are more number of topological transitions and thus it becomes difficult to join the points with same Hall conductivities in a straight line as they get more scattered in the Landau fan diagram. In the presence of interaction, the Diophantine equation used for non-interacting case does not hold.
Hence we have shown that interactions disintegrate the Hofstadter butterfly. Further, the Landau fan diagram also drastically changes and the Diophantine equation obeyed by the topological invariants in the non-interacting system breaks down in the interacting system.
References
- Klitzing et al. (1980) K. v. Klitzing, G. Dorda, and M. Pepper, Phys. Rev. Lett. 45, 494 (1980), URL http://link.aps.org/doi/10.1103/PhysRevLett.45.494.
- Tsui et al. (1982) D. C. Tsui, H. L. Stormer, and A. C. Gossard, Phys. Rev. Lett. 48, 1559 (1982), URL http://link.aps.org/doi/10.1103/PhysRevLett.48.1559.
- Thouless et al. (1982) D. J. Thouless, M. Kohmoto, M. P. Nightingale, and M. den Nijs, Physical Review Letters 49, 405 (1982).
- Kohmoto (1985) M. Kohmoto, Annals of Physics 160, 343 (1985).
- Hofstadter (1976) D. R. Hofstadter, Physical Review B 14, 2239 (1976).
- Wannier (1978) G. H. Wannier, Physica Status Solidi B Basic Research 88, 757 (1978).
- Ponomarenko et al. (2013) L. Ponomarenko, R. Gorbachev, G. Yu, D. Elias, R. Jalil, A. Patel, A. Mishchenko, A. Mayorov, C. Woods, J. Wallbank, et al., Nature 497, 594 (2013).
- Dean et al. (2013) C. Dean, L. Wang, P. Maher, C. Forsythe, F. Ghahari, Y. Gao, J. Katoch, M. Ishigami, P. Moon, M. Koshino, et al., Nature 497, 598 (2013).
- Hunt et al. (2013) B. Hunt, J. Sanchez-Yamagishi, A. Young, M. Yankowitz, B. J. LeRoy, K. Watanabe, T. Taniguchi, P. Moon, M. Koshino, P. Jarillo-Herrero, et al., Science 340, 1427 (2013).
- Yu et al. (2014a) G. Yu, R. Gorbachev, J. Tu, A. Kretinin, Y. Cao, R. Jalil, F. Withers, L. Ponomarenko, B. Piot, M. Potemski, et al., Nature Physics 10, 784 (2014a).
- Yu et al. (2014b) G. Yu, R. Gorbachev, J. Tu, A. Kretinin, Y. Cao, R. Jalil, F. Withers, L. Ponomarenko, B. Piot, M. Potemski, et al., Nature physics 10, 525 (2014b).
- Aidelsburger et al. (2013) M. Aidelsburger, M. Atala, M. Lohse, J. T. Barreiro, B. Paredes, and I. Bloch, Physical Review Letters 111, 185301 (2013).
- Miyake et al. (2013) H. Miyake, G. A. Siviloglou, C. J. Kennedy, W. C. Burton, and W. Ketterle, Physical Review Letters 111, 185302 (2013).
- MacDonald (1983) A. H. MacDonald, Physical Review B 28, 6713 (1983), URL http://link.aps.org/doi/10.1103/PhysRevB.28.6713.
- Weeks et al. (2010) C. Weeks, and M. Franz, Physical Review B 81, 085105 (2010).
- Hou et al. (2010) Chang-Yu Hou, and Claudio Chamon, and Christopher Mudry, Physical Review Letters 98, 186809 (2007).
- Castro et al. (2011) E. V. Castro, A. G. Grushin, B. Valenzuela, M. A. H. Vozmediano, A. Cortijo, and F. de Juan, Physical review letters 107, 106402 (2011).
- Grushin et al. (2013) A. G. Grushin, E. V. Castro, A. Cortijo, F. de Juan, M. A. H. Vozmediano, and B. Valenzuela, Physical Review B 87, 085136 (2013).
- Gudmundsson and Gerhardts (1995) V. Gudmundsson and R. R. Gerhardts, Physical Review B 52, 16744 (1995).
- Doh and Salk (1998) H. Doh and S.-H. S. Salk, Physical Review B 57, 1312 (1998).
- Apalkov and Chakraborty (2014) V. M. Apalkov and T. Chakraborty, Physical Review Letters 112, 176401 (2014).
- Chakraborty and Apalkov (2013) T. Chakraborty and V. M. Apalkov, Solid State Communications 175, 123 (2013).
- Czajka et al. (2006) K. Czajka, A. Gorczyca, M. M. Maśka, and M. Mierzejewski, Physical Review B 74, 125116 (2006).
- Mishra et al. (2016) A. Mishra, S. R. Hassan, and R. Shankar, Phys. Rev. B 93, 125134 (2016), URL http://link.aps.org/doi/10.1103/PhysRevB.93.125134.
- Hatsugai et al. (2006) Y. Hatsugai, T. Fukui, and H. Aoki, Phys. Rev. B 74, 205414 (2006).
- Goldman (2009) N. Goldman, Journal of Physics B: Atomic, Molecular and Optical Physics 42, 055302 (2009).
- Rammal (1985) R. Rammal, Journal de Physique 46, 1345 (1985).
- Gumbs and Fekete (1997) G. Gumbs and P. Fekete, Phys. Rev. B 56, 3787 (1997).
- Claro and Wannier (1979) F. H. Claro and G. H. Wannier, Phys. Rev. B 19, 6068 (1979).
- Rhim and Park (2012) J.-W. Rhim and K. Park, Physical Review B 86, 235411 (2012).
- Sondhi et al. (1993) S.-L. Sondhi, A. Karlhede, S. A. Kivelson and E. H. Rezayi, Physical Review B 47, 16419 (1993).
- Brey et al. (1993) L. Brey, H. A. Fertig, R. Côté and A. H. MacDonald, Springer, 275 (1997).