Hierarchical Clustering in Face Similarity Score Space
Abstract
Similarity scores in face recognition represent the proximity between pairs of images as computed by a matching algorithm. Given a large set of images and the proximities between all pairs, a similarity score space is defined. Cluster analysis was applied to the similarity score space to develop various taxonomies. Given the number of subjects in the dataset, we used hierarchical methods to aggregate images of the same subject. We also explored the hierarchy above and below the subject level, including clusters that reflect gender and ethnicity. Evidence supports the existence of clustering by race, gender, subject, and illumination condition.
I Introduction
Face recognition is an appealing modality of biometrics because it seeks to mimic the natural way in which individuals identify one another. From a recognition standpoint, images of faces can be acquired easily and non-intrusively, which can be especially beneficial when dealing with uncooperative subjects. Furthermore, images containing a person’s face are readily available.
Face recognition is not without its challenges, however. As the human body ages, the appearance of a person’s face also changes. Changes in body weight affect the shape of one’s face, and one’s appearance may also be altered by facial hair and wrinkles[14]. Two persons can appear very similar, as with the case of identical twins, and recognition can be very difficult in non-ideal conditions[15]. Recognition under variable lighting and pose also creates challenges for recognition systems[7].
Early deployment of face recognition software was primarily used in security applications such as identifying persons on a watch list or verifying a person’s claimed identity. Today, commercial applications of face recognition are becoming just as popular. In mobile applications, face recognition is used to secure content on cellular phones. Clustering and organizing of consumer photos[8][9] can be seen in applications such as Google Picasa and Facebook. In these applications, images of faces are clustered at the subject level (images of the same person are grouped together). Our research aims to explore the clusters that form above and below these clustering levels. We hypothesize these clusters to characterize images having the same gender, ethnicity, illumination, or expression. Furthermore, we attempt to partition the dataset into clusters of subjects and explore attributes of images which are incorrectly clustered. Using the similarity scores of pairs of images from recognition algorithms, also known as match scores, we utilized hierarchical clustering schemes to explore this “face space.”
This paper begins with an introduction to hierarchical clustering and related work in face clustering. The dataset and clustering methods used are then presented. Initial analyses of the clustering methods chosen are discussed and the experimental setup is described. Afterwards, results from hierarchical clustering for classification of race, gender, illumination, and expression are presented with analysis.
II Background and Related Work
Hierarchical clustering[11] is a method of partitioning a set of objects into mutually exclusive groups, containing members that are homogeneous with respect to some criterion. This technique is considered intrinsic, also known as unsupervised, because no category labels denoting a piori information are used in a training step. Hierarchical clustering is particularly useful for determining an ordering of objects. Some applications described by Ward include the establishment of taxonomies of plants and animals with respect to genetic backgrounds, cataloging and organizing materials such as library documents, and in identifying job “types” and “subtypes”[19].
Hierarchical clustering may be performed in a top-down or bottom-up fashion. When objects begin in their own cluster and are merged into larger clusters as the algorithm works, the method is agglomerative. A divisive clustering algorithm performs these steps in the reverse order, beginning with a single cluster containing all objects and dividing the clusters into smaller subclusters. The results of hierarchical clustering algorithms are often displayed as dendrograms, which are tree structures used to present the arrangement of objects. A cut across the dendrogram creates clusters.
Our goal is to apply these principles to similarity scores for frontal face images. While it is possible to classify people in many ways, the scope of our classifications is limited to the information available though a cropped face image. This information includes gender, ethnicity, expression, the presence or absence of eyeglasses, and the environment in which the image was taken.
A simple procedure for evaluating a clustering method is to compare the category assigned labels of objects within the same cluster. Each image within our dataset is assigned a sequence and subject number. Images with the same subject number belong to the same person. Other information such as a subject’s year of birth, ethnicity, and gender are stored in a table corresponding to the image sequence and subject identification number.
Limited research has been conducted in relation to establishing a hierarchy of attributes of face images. In [3], hierarchical face clustering of face images is performed using SIFT features. Fan and Yeung explore hierarchical clustering as a method to group similar faces for recognition[6]. Other face clustering methods and applications are explored in [4]; however, none of this previous research explores clustering above or below the subject level.
III Overview of Hierarchical Clustering Methods
The following sections will detail the three clustering methods for which we present data: single-link, complete-link, and Ward’s method. A longer description can be found in [11]. These sections will be followed by a synopsis of multidimensional scaling and its use in face image clustering.
Single-link and complete-link clustering are agglomerative methods. Each object begins in its own cluster. This is the first of a three-step process. The next step is merging, which defines the difference between the single-link and complete-link methods. To begin merging, the lowest threshold value is selected and a threshold graph is created. The ordering in which objects are connected in the threshold graph forms the hierarchy. The merging height of two objects is equal to the threshold value of the threshold graph in which the two objects were joined.
The complete-link method is more complex. In this method, objects are merged in the hierarchical structure when a clique is formed among them. A clique is a fully connected subgraph. The final step is determining the stopping criteria. Since a link is formed at each stage of the threshold graph in the single-link method, this process takes () iterations, where is equal to the number of objects. The complete-link method terminates when there is an edge between every pair of objects, a total of iterations.
Ward’s method of clustering differs from that of the single and complete-link approaches by using statistical measures to compute clusters. Ward’s method is also an agglomerative approach; however, unlike the two previously described methods that required a threshold graph, this method uses an analysis of variance approach to evaluate the hierarchy and distance between objects. At each iteration, objects are assigned to clusters in a manner that minimizes the sum of the square distances from all objects to their cluster centers.
IV Dataset
Data for this experiment was taken from the Face Recognition Grand Challenge dataset (FRGC 2.0)[16]. Only the validation partition was used in this study. The validation set consists of data collected from 4,007 subject sessions, with each subject session containing four controlled still images, two uncontrolled still images, and one three-dimensional image. Our data consisted only of still images. Controlled stills were taken under two studio lighting conditions, each setting consisting of two facial expressions, happiness and neutral. The uncontrolled images were taken in various locations and conditions such as hallways, atria, or outdoors. Each pair of uncontrolled stills was also taken with the same two expressions. Example images are shown in Figure 1.


Templates of the faces in these images were created using the Cognitec FaceVACS system[1]. Artifacts such as harsh illumination and excessive blurriness caused some enrollment failures. Furthermore, we removed from the dataset subjects who appeared in fewer than three acquisition sessions. In total, our subset of the FRGC ver2.0 dataset consisted of 23,355 images taken from 383 subjects. The maximum number of images for a single subject was 132, the minimum was 18, and the average was 61. The majority of images used in the study were taken from Asian (6,648) and white (14,853) subjects. 678 images came from individuals identifying themselves as Hispanic, 414 from Asian-Southern, 150 from African-American, 96 from Asian Middle-Eastern, and 516 did not carry an ethnicity label. Gender was nearly evenly distributed: 12,392 images were male and 10,963 were female. Subjects wearing glasses appeared in 1,361 images and the other 21,994 images were taken with subjects not wearing glasses. 11,667 images are of subjects depicting a neutral expression or blank stare and the other 11,668 images contain subjects with a prompted smiling expression.
Using the templates created by Cognitec, an all vs. all matching experiment was conducted. The probe and gallery sets were identical. For each image pair, a score was generated in the range of 0 to 1, higher scores indicating greater similarity. Data was output in matrix form. Analysis was performed in R, an open-source software package for statistical computing[18]. Hierarchical clustering methods were implemented using the flashClust algorithm[13]. To convert the matching score matrix into a usable format for hierarchical clustering, the similarity matrix was transformed into a distance matrix by subtracting each entry in the matrix from the maximum element.
V Selecting a Hierarchical Clustering Methods Using Preliminary Analysis
Because there is no universal best clustering method for all data sets, we initially applied all three hierarchical methods to our dataset to determine which method(s) would perform well. Our initial criterion of a method’s success was predicated on the appearance of a hierarchical structure within the dendrogram. A secondary criterion for good performance was based on a cluster purity for a particular feature. Preliminary observations of the single-link and complete-link clustering methods are presented first, followed by our ultimate decision which was Ward’s clustering method.
The single-link method is a “greedy” algorithm. Clusters are formed by linking unlinked objects in closest proximity. Therefore, this technique is not robust to outliers and can create a cascade of errors. For instance, if an outlier joins the cluster, objects that are close in proximity to the outlier will continue to join the cluster and increase the number of errors. Therefore, this method tended to create long cluster strings for our data which generally indicates poor performance. No natural or representative groupings were obtained.
As opposed to the single-link method, the complete-link method is much more “cautious”. Clusters are based upon cliques in the distance matrix. Because of this property, the first few clusters can be produced quite accurately. Outliers still play an important factor in the resulting data. An object that should be classified with a group could have a large distance to an object already in the group. Because of this, the complete-link method will prevent the cluster from being formed until much later. While smaller clusters are tightly connected, underlying structures with larger granularities form at much higher levels, thus producing a large proportion of very tall branches and no natural separation.
After initial analysis, it was evident that neither the single-link nor the complete-link methods would perform well with the data that we were attempting to classify. One of the most difficult issues stemming from both methods was the ability to identify a height level at which the dendrogram could be cut to produce useful clusters. These issues are understandable given the large number of objects being clustered; however, this led us to explore Ward’s Method. Unlike the two previous methods, by visual inspection it is apparent that some hierarchy exists within the data. After preliminary results, we decided to continue with Ward’s method for our subsequent analysis.
VI Analysis of Dataset using Ward’s Clustering Method
One of the many difficult problems in clustering is determining the number of groups into which the data should be clustered[5]. These different grouping occur at various heights within the dendrogram. Long branches between merges often indicate a change in classification, but this may be difficult to identify visually. Horizontal lines across a dendrogram also intercept a number of branches. These values may be used to predict a particular height at which the dendrogram should be cut to produce clusters.
We used the same approach in clustering face images; however, we were not certain what hypes of hierarchies would be present. We began by grouping data into two classes: gender, illumination conditions, and expression. These classes were chosen from the available metadata of the dataset. Our analysis continued in attempting to cluster images by race. Results are initially shown with seven classes, one class per known race, and continued as a two-class problem, due to the largely imbalanced class sizes. Next, a 383-cluster solution is presented, which attempts to classify the dataset into clusters of subjects. Finally, 383 individual cluster analyses are performed using only the genuine images of each subject. In this manner, we attempt to separate illumination conditions and expression.
VI-A Partitioning by Gender, Eyeglasses, or Expression: A Two-Cluster Solution
In the coarsest level of granularity, the set of images was divided into two clusters. From our initial analysis, we observed that images of the same subjects tended to cluster together. Therefore, we did not expect attributes such as similar expression or the presence of glasses to form large clusters. Our experiments verified this expectation. Most notably, the two-cluster solution also did not favor gender, which is a primary way in which humans classify one another.
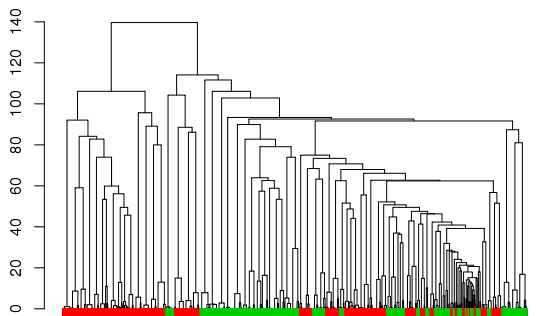
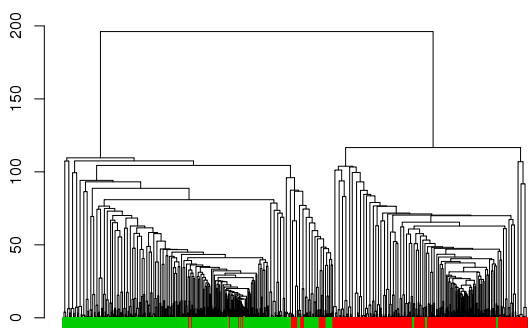
In a second attempt to classify images by gender, we considered images of a single race at a time. Images of Asian and white subjects were clustered separately and then divided into two clusters. Plots of the two resulting dendrograms can be seen in Figure 2. Images of white subjects tended to cluster well by gender. The first cluster consisted primarily of images from male subjects (7,886 male / 770 female), and the second cluster was consisted primarily of images from female subjects (6,005 female / 192 male). Images of Asian subjects were not so well behaved. Grouping the images of Asian subjects into two clusters, the first cluster consisted of 1,476 females and 0 males. However, the second cluster consisted of 2,046 females and 3,126 males. Moreover, the structure of the dendrogram (Figure 2(a)) presents little evidence to support a secondary divide of the larger, two-gender cluster.
VI-B Partitioning by Ethnicity: Seven-Cluster and Two-Cluster Solutions
Noticing that the overall hierarchy using all face images did not favor gender, the data was then divided into seven clusters, aiming to bucket each of the reported ethnic groups. Notably, a total of 516 images were taken from 11 subjects that did not wish to report an ethnicity. Therefore, while our data is split into seven ethnicities, including one group for unknown ethnicities, the number of ethnicities may be in the range of six to seventeen.
Using a seven-cluster solution, complete separation was not evident; however, some ethnicities tended to cluster together. For instance, 3 out of the 7 clusters were comprised purely of Asian subjects and another cluster contained mostly Asian subjects. Additionally, a cluster contained images of only white subjects and the remaining two clusters were dominated by images of white subjects. We attempted to incrementally increased the number of clusters from seven to seventeen in attempt purify clusters; however, this showed no significant increase in separation between the ethnic groups. We attributed this to the large imbalance of classes.
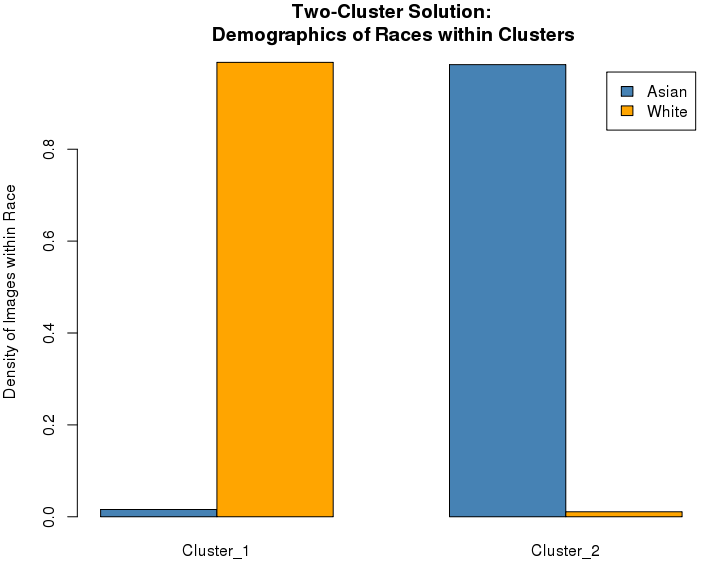
Because our data was dominated by two races and all the clusters of the seven-cluster solution were majority Asian or white subjects, we provide a two-cluster solution for partitioning by race. As expected, the majority of images of Asian subjects resided in one cluster and the majority of white subjects resided in the second cluster. Alternatively, we subsampled the dataset to contain only images of Asian and white subjects and clustered this data into two groups. Purity of clusters was nearly identical in both demographics (see Figure 3).
VI-C Subject-wise Partitioning the Dataset
Ward’s method performed well when separating subjects into clusters of individual subjects. Out of 383 clusters, 370 were homogeneous, consisting of one subject (95.8% purity). The set of thirteen error clusters contained 998 images. 788 of those images were of white subjects (5.32% of white population) and 189 were of Asian subjects (2.84% of Asian population). Surprisingly, illumination conditions did not play a role in misclassification. Of the misclassified images, 607 images were taken in controlled illumination and the remaining 259 images were taken in uncontrolled illumination. Similarily, misclassified images did not favor gender or expression and the ratio of each class in the set of misclassified images was approximately equal to the total distribution. 406 images were of females and 592 were of males, and 503 images were of subjects with a blank stare and 495 were of subjects expressing happiness.
Seven out of 13 clusters containing multiple subjects were clusters of two subjects, all of which were of the same race. Six of those seven clusters were of subjects of the same gender. Clusters of multiple races occurred once, in the largest cluster containing 340 images. Upon examination, this cluster contained a large number of problematic images that were often out of focus or had harsh illumination patterns.
Cluster purity remained nearly the same when considering images of the same race. Using proximity data of just white subjects, 96.1% of clusters (248/258) consisted of just one subject. Images from Asian subjects fared slightly better; cluster purity for Asian subjects was 97.8% (87/89). Notably, the number of white subjects was nearly double that of Asian subjects.
VI-D Examining the Structure of Proximity Data within Individual Subjects
Using only the genuine proximity data of a single subject, hierarchical clustering was performed on each subject. This gave us the opportunity to explore the structure of each subject without the possibility of false classifications from other subjects. Subjects posed in neutral and smiling expressions, and in studio and unconstrained lighting. Using hierarchical clustering we observed the structure of the proximity data within each subject to see if images of similar illumination conditions or expression clustered well.
The dendrograms of subjects whose images were sorted by illumination conditions. These clusterings show a propensity to group by illumination condition. The same task was performed and images were sorted by the subject’s expression. A grouping based on expression did not appear evident. This may be explained by the matching algorithm’s robustness to facial expression or by the minimal variation of expression with images.
VII Conclusions and Future Work
Through hierarchical methods, we explored underlying structures within similarity scores of face imagery using the available metadata. When considering a balanced dataset, hierarchical methods proved efficient for separating the data into two classes of race, white and Asian. We hypothesize that this classification could be extended given a larger number of races which were uniformly distributed. Asian subjects were less likely to cluster by gender when compared to white subjects; however, this was not attributed to poor matching performance. Comparatively, Asian subjects performed considerably better than white subjects. Hierarchical clustering also proved strong in separating groups into classes of subjects. Given an approximate number of subjects within a dataset, hierarchical clustering could be perceived as a potential method for subject grouping or cohort analysis[2].
Improvements to subject clustering may be made using alternative clustering techniques. Our analysis was based on hierarchical methods; however, other methods include centroid-based clustering, such as k-means[10], or density based clustering[12]. Clusters formed by by hierarchical methods are created by forming tree-like structures and cutting branches at a constant height value. This method is inflexible and may not be well suited for grouping face images. Studies suggest that individual faces may vary in the degree of difficulty for recognition[20]. To account for potential biases of the matching algorithm[17], our next step will be to cluster fusion scores from multiple face matching algorithms.
References
- [1] Cognitec Systems GmbH FaceVACS Software Developers Kit. http://www.cognitec.com.
- [2] G. Aggarwal, N. Ratha, R. Bolle, and R. Chellappa. Multi-biometric cohort analysis for biometric fusion. In IEEE International Conference on Acoustics, Speech and Signal Processing, pages 5224–5227, Apr. 2008.
- [3] P. Antonopoulos, N. Nikolaidis, and I. Pitas. Hierarchical face clustering using sift image features. In IEEE Symposium on Computational Intelligence in Image and Signal Processing, pages 325–329, April 2007.
- [4] J. R. Barr, K. W. Bowyer, P. J. Flynn, and S. Biswas. Face recognition from video: A review. International Journal of Pattern Recognition and Artificial Intelligence, 26(05), 2012.
- [5] R. C. Dubes. How many clusters are best? - an experiment. Pattern Recognition, 20(6):645–663, Nov. 1987.
- [6] W. Fan and D.-Y. Yeung. Face recognition with image sets using hierarchically extracted exemplars from appearance manifolds. In In Proceedings of the 7th International Conference on Automatic Face and Gesture Recognition, pages 177–182, April 2006.
- [7] A. S. Georghiades, P. N. Belhumeur, and D. J. Kriegman. From few to many: Illumination cone models for face recognition under variable lighting and pose. IEEE Transactions on Pattern Analysis and Machine Intelligence, 23:643–660, 2001.
- [8] A. Girgensohn, J. Adcock, and L. Wilcox. Leveraging face recognition technology to find and organize photos. In Proceedings of the 6th ACM SIGMM International Workshop on Multimedia Information Retrieval, MIR ’04, pages 99–106, New York, NY, USA, 2004. ACM.
- [9] L. Gu, T. Zhang, and X. Ding. Clustering consumer photos based on face recognition. In IEEE International Conference on Multimedia and Expo, pages 1998–2001, Jul. 2007.
- [10] J. A. Hartigan and M. A. Wong. Algorithm as 136: A k-means clustering algorithm. Applied statistics, pages 100–108, 1979.
- [11] A. K. Jain and R. C. Dubes. Algorithms for clustering data. Prentice-Hall, Inc., Upper Saddle River, NJ, USA, 1988.
- [12] H.-P. Kriegel, P. Kroger, J. Sander, and A. Zimek. Density-based clustering. Wiley Interdisciplinary Reviews: Data Mining and Knowledge Discovery, 1(3):231–240, 2011.
- [13] P. Langfelder and S. Horvath. Fast R functions for robust correlations and hierarchical clustering. Journal of Statistical Software, 46(11):1–17, 2012.
- [14] H. Ling, S. Soatto, N. Ramanathan, and D. Jacobs. A study of face recognition as people age. In IEEE 11th International Conference on Computer Vision, pages 1–8, Oct. 2007.
- [15] J. Paone, P. Flynn, P. Phillips, K. Bowyer, R. Vorden Bruegge, P. Grother, G. Quinn, M. Pruitt, and J. Grant. Double trouble: Differentiating identical twins by face recognition. Information Forensics and Security, IEEE Transactions on, 9(2):285–295, Feb 2014.
- [16] P. Phillips, K. Bowyer, T. Scruggs, E. Ortiz, J. Chang, K. Hoffman, J. Marques, J. Min, and W. Worek. Overview of the face recognition grand challenge. In Computer Vision and Pattern Recognition, 2005. CVPR 2005. IEEE Computer Society Conference on, volume 1, pages 947–954 vol. 1, Jun. 2005.
- [17] P. J. Phillips, F. Jiang, A. Narvekar, J. Ayyad, and A. J. O’Toole. An other-race effect for face recognition algorithms. ACM Transactions Applied Perception, 8(2):14:1–14:11, Feb. 2011.
- [18] R Core Team. R: A Language and Environment for Statistical Computing. R Foundation for Statistical Computing, Vienna, Austria, 2012. ISBN 3-900051-07-0.
- [19] J. H. Ward. Hierarchical grouping to optimize an objective function. Journal of the American Statistical Association, 58(301):236–244, 1963.
- [20] N. Yager and T. Dunstone. The biometric menagerie. IEEE Transactions on Pattern Analysis and Machine Intelligence, 32(2):220–230, Feb. 2010.