Effect of the polydispersity of a colloidal drop on the drying induced stress as measured by the buckling of a floating sheet
Abstract
We study the stress developed during the drying of a colloidal drop of silica nanoparticles. In particular, we use the wrinkling instability of a thin floating sheet to measure the net stress applied by the deposit on the substrate and we focus on the effect of the particle polydispersity. In the case of a bidisperse suspension, we show that a small number of large particles substantially decreases the expected stress, which we interpret as the formation of lower hydrodynamic resistance paths in the porous material. As colloidal suspensions are usually polydisperse, we show for different average particle sizes that the stress is effectively dominated by the larger particles of the distribution and not by the average particle size.
Drying of colloidal droplets is ubiquitous in processes such as ink-jet printing technologies James2011 or spray painting. Recently, new directions for printing techniques have been developed for soft materials to enable applications such as conformable electronics, soft robotics and wearable devices. For instance, electronic circuits can be printed on elastomers Rogers2010 ; Boley2015 and human skin Jeong2013 . However, deformations of the surface can be induced by the surface tension of a liquid drop Jerison2011 ; Marchand2012 ; Dervaux2015 or the consolidation of a colloidal material Boulogne2014b , which could affect the final quality and the function of the printed device. Here, we report measurements of the drying induced stress and highlight the role of polydispersity of the suspension.
Previous reported measurements of drying or cracking stresses rely on the deflection of a cantilever beam Petersen1999 ; Yow2010 ; Thomas2011 ; Chekchaki2013 where a liquid film of a polymer solution or colloidal suspension is coated on a thin flexible plate. In such a geometry, the film dries from the edge toward the center of the film Li2012a , which leads to spatially inhomogeneous states of the material.
However, besides the bending, when a stress is applied above a certain limit to a thin sheet, a wrinkling instability can be observed Cerda2003 ; Geminard2004 ; Oshri2015 ; Damman2015 . Recent studies focused on an elastomeric disk floating on a liquid bath with a liquid drop in the center of the disk Huang2007 ; Davidovitch2011 ; King2012 ; Toga2013 ; Pineirua2013 . In these situations, the stress applied to the membrane is due to the surface tension of the involved liquids. Therefore, these studies of a deformable sheet established models based on Föppl-von Kàrmàn equations to predict the length and the number of wrinkles.
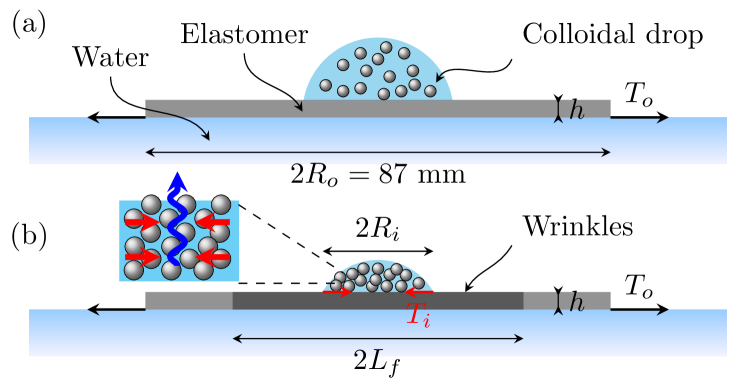
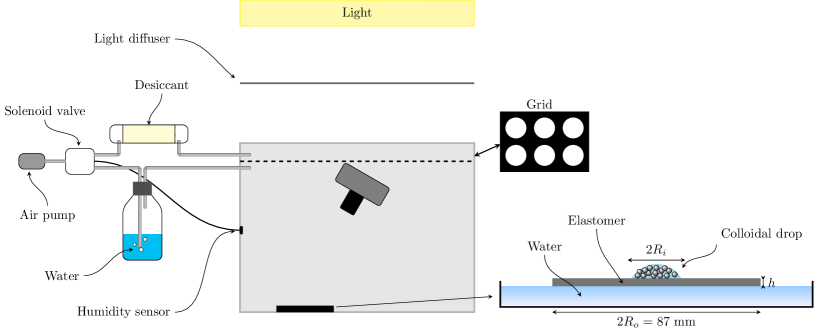
In this Letter, we focus on visualizing and measuring the stress induced by the drying of a colloidal drop on a floating membrane (Fig. 1). The mechanical properties of the membrane are chosen carefully to satisfy two conditions. First, the surface tension of the pure liquid drop alone and its weight do not trigger the wrinkling instability (Fig. 1(a)). Second, the drying-induced consolidation of the colloidal droplet, which induces a larger tensile stress in the membrane, triggers the instability (Fig. 1(b)). From the length of the wrinkles, we can deduce the tension in the film. Our aim is to examine the effect of particle size and polydispersity on the net stress that a drying drop of silica nanoparticles applies on the substrate.
Elastomeric sheets are prepared with polydimethylsiloxane (PDMS) by a spin coating technique on a silicon wafer (see Section S1 in Supplementary Information (SI) SI ). The measured film thickness ranges from m, the elastic modulus of the floating film is MPa and the Poisson ratio . Thus, the bending modulus of the thin sheet is Pa m3. The floating film is detached from the wafer in a water bath, which has a surface tension mN/m.
The colloidal suspensions are silica nanoparticles. SM, HS and TM are Ludox suspensions (purchased from Sigma-Aldrich), and Kleb and Lev denote Klebosol 50R50 and Levasil30, respectively (Table S1). To ensure that all suspensions have the same pH, ionic strength and volume fraction, each suspension is dialysed Bouchoux2009 and has an initial volume fraction . The particle size distributions are characterized by Dynamic Light Scattering (DLS) and the average particle diameters span from to nm. Details on the sample preparation and on the particle size characterisation are presented in Section S2 in the SI SI . A drop of colloidal suspension of is dispensed with a micropipette in the center of the floating sheet (Fig. 1). Pictures of the floating film are recorded in a humidity controlled chamber ( %) every minute.
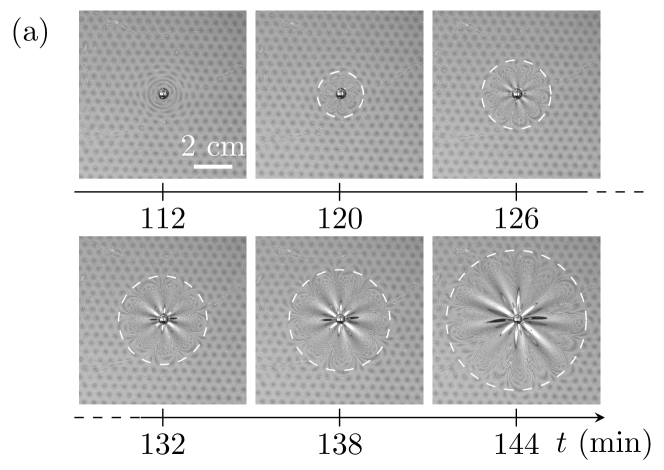
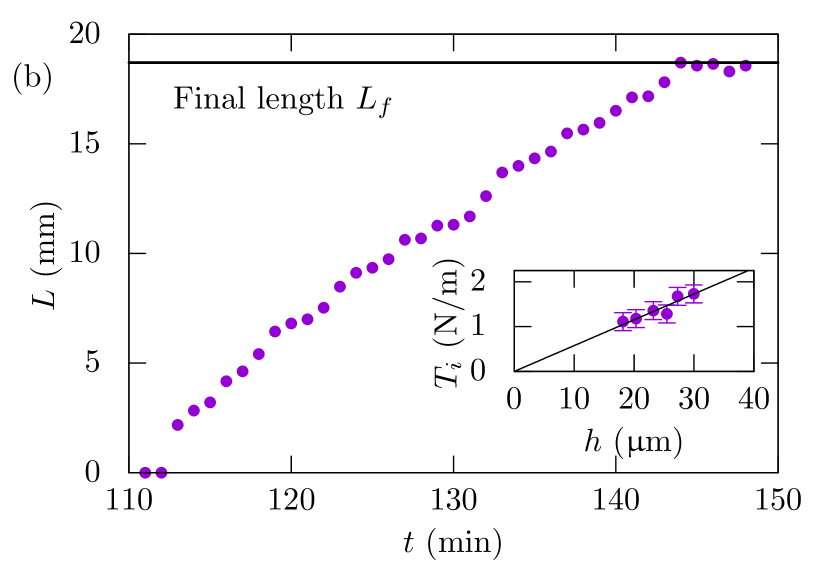
Initially, no wrinkles are present on the floating film. As the colloidal drop dries, the contact line first exhibits a stick-slip motion. Ultimately, the contact line pins, the deposit height decreases and, concurrently, the wrinkling instability appears at min (Fig. 2(a)). The length of the wrinkled region grows linearly in time until it reaches a final length when the colloidal drop becomes solid at min (Fig. 2(b)). During the consolidation, no relaxation of the wrinkles is observed, which indicates that the deposit is in good adhesion with the substrate (Fig. 2). This observation is supported by a side view showing that the contact line is pinned during the development of the wrinkling instability and the drop height decreases (see Movie in SI SI ). Furthermore, no cracks are visible in the final colloidal deposit, which is due to the substrate elasticity Smith2011 .
To obtain an estimate of the time evolution of the volume fraction, the time derivative of the liquid volume is where is the evaporative flux Deegan2000a . To estimate this flux, we consider that the aggregation occurs at Boulogne2014a . Thus, we have and . Therefore, the evaporation speed scales as m/s where is the characteristic evaporating area. The instability appears for , which is the typical volume fraction for which the material becomes visco-plastic DiGiuseppe2012 ; Boulogne2014a .
As we observed, the growth of the wrinkle length is associated with the consolidation of the deposit, which applies a tensile stress on the membrane. We employ the final length of wrinkles to quantify this stress. Davidovitch et al. predicted the wrinkle’s length as a function of the inner tension applied by the deposit at and the outer tension due to the surface tension of the liquid bath at (Fig. 1) Davidovitch2011 . The wrinkles morphology is set by the tension ratio and the bendability . With a stability analysis of the Föppl-von Kàrmàn equations for , the length of the wrinkles is predicted to be
| (1) |
This relation is valid for infinitesimal deformation amplitudes and is called the Near Threshold limit (NT).
A second limit was also established for finite deformation amplitudes . For , Davidovitch et al. assume that in the post-buckling region, the hoop stress and the shear stress vanish. In this Far From Threshold limit (FFT), the wrinkle length is predicted to be
| (2) |
In our experimental conditions, the total number of wrinkles is established early in the development of the wrinkles as previously observed in wetting experiments Toga2013 . Also, this number varies weakly, typically between 6 and 12, as the physical parameters are changed, which does not allow a prediction from this quantity described by scaling laws in the literature Davidovitch2011 ; King2012 ; Toga2013 . From the final length of wrinkles , the inner tension can be estimated in NT and FFT limits from equations (S8) and (S9), respectively. In our experimental conditions, the values are about an order of magnitude above the range of NT tension values predicted by Davidovitch et al. Davidovitch2011 (Section S4, SI SI ). Consequently, inner tension values are calculated in the FFT limit from Eq. (S9).
We performed experiments with a TM suspension, a drop volume of 8 , and different film thicknesses. The tension resulting from the final wrinkle length (Eq. (S9)) is plotted as a function of the film thickness in the inset of Fig. 2(b). The linear relationship between and suggests that the relevant parameter to describe the consolidation of the deposit on the membrane is the average stress .
Since the deposit has a good adhesion on the elastomer Boulogne2014b , the drying strain in the deposit is transmitted to the flexible membrane, which leads to the formation of wrinkles. In the following, we consider that the deposit generates an effective stress in the membrane located at the deposit edge.
To study the effect of the particle size polydispersity Iler1979 ; Lidon2014 on the drying stress, we prepared blended suspensions from SM and Lev samples (Table S1). Since Lev particles are larger than the largest particles present in the SM suspension, we consider as a first approximation that the mixture is a bidisperse suspension; the size ratio is approximately a factor of 10. We denote and , the average radii of small and large particles, respectively. The volume ratio of large particles is defined as
| (3) |
where is the volume of particles. Equivalently, denoting and as the number of small and large particles, we define the particle number ratio of large particles as
| (4) |
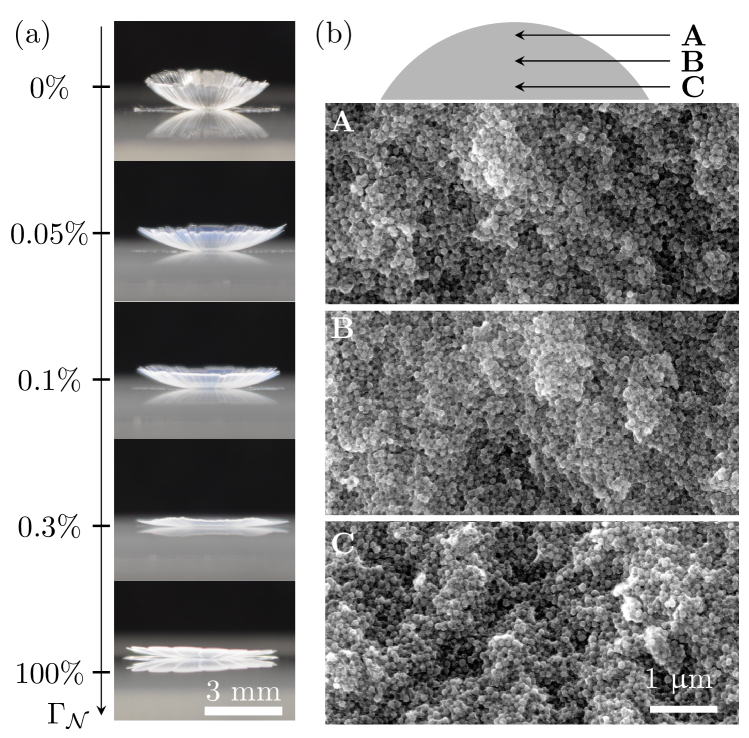
We conducted a first set of experiments that consist in drying drops of colloids on a hydrophilic glass slide. The drying occurs from the contact line toward the center as the edge is thinner and the evaporative flux is highest at the edge. During the consolidation, the material delaminates from the substrate and the curvature increases with the tensile stress Pauchard2006 . In Fig. 3(a), we observe that the addition of a small number of large particles reduces significantly the delamination, which could be crucial for coating applications. Next, we investigate the stress reduction caused by the presence of these large particles.
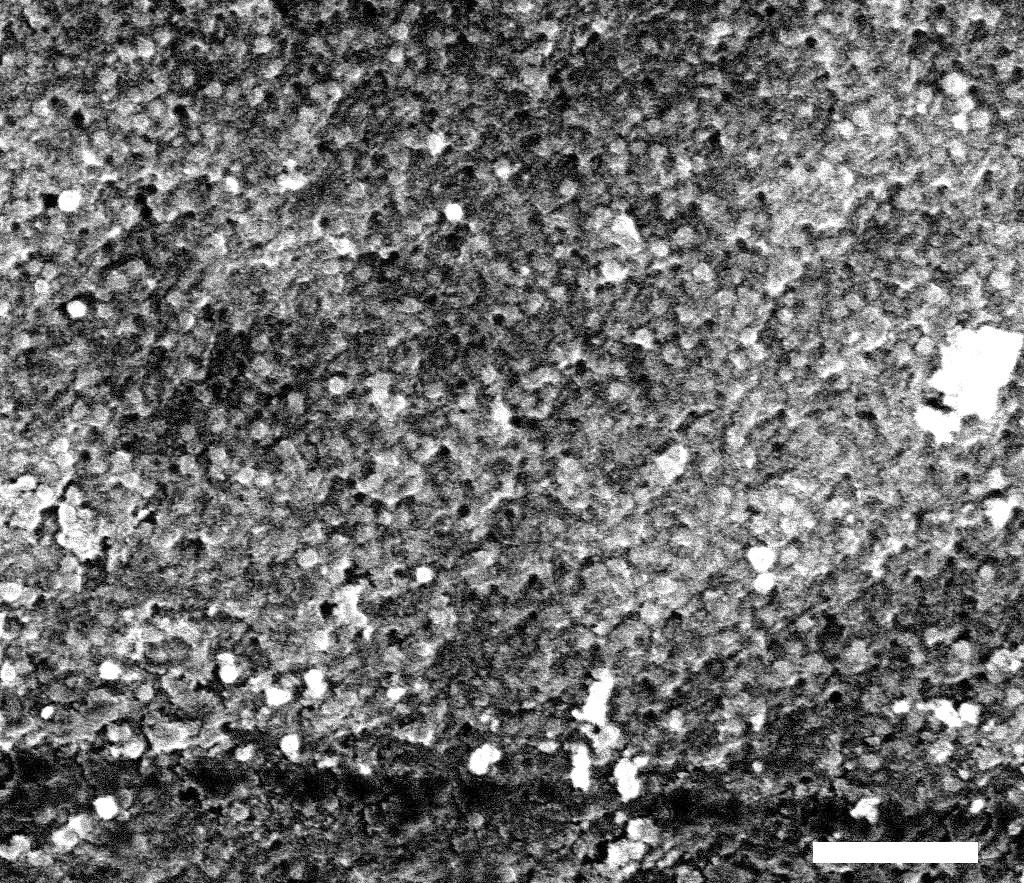
Since measurements of the drying stress are possible with the floating film (Fig. 2), we quantify the effect of the particle size ratio. As the evaporation may lead to particle segregation in the deposit Trueman2012 ; Routh2013 ; Fortini2016 , we checked the particle organization across the thickness of the deposit by Scanning Electron Microscopy. We observed that the particles remains homogeneously distributed at the end of the drying (Fig. 3(b) and SI, Section S3 SI ).
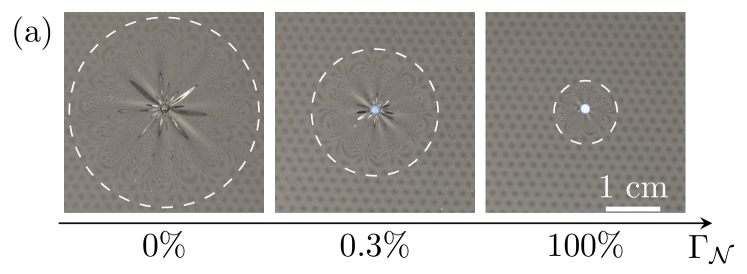
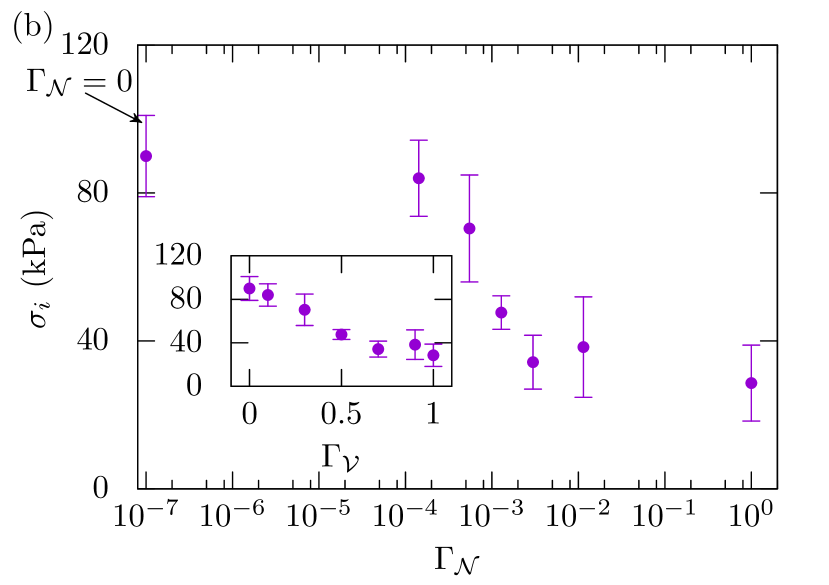
Our experiments showed that the length of the wrinkles decreases as the number fraction of large particles increases (Fig. 4(a)). The stress after drying is reported in Fig. 4(b) as a function of and . First, we find that the drying stress for a pure suspension of large particles () is about half as large as the case of a pure suspension of small particles (), which confirms that the final stress depends on the particle size. These results also show that the addition of a number density of large particles () leads to a stress value comparable to a suspension of only large particles.
To interpret these results, we refer to the description developed by Sherwood Sherwood1929 and further detailed in particular by Brinker and Scherer Brinker1990 . During the drying of the colloidal suspension, the particles concentrate and form a porous material for which the surface remains wet. The liquid flow driven by the evaporation generates a pressure gradient due to the Darcy law, which is responsible for a tensile stress in the deposit Brinker1990 ; Boulogne2015 . When the compression exceeds the repulsive interactions between the colloids, silica particles irreversibly aggregate Iler1979 and the menisci penetrate in the material Thiery2015 .
We use the Darcy approximation , where Pas is the solvent viscosity, is the fluid velocity, is the pressure and is the permeability. We can estimate the tensile stress from the pressure gradient in the porous network as
| (5) |
where is the deposit size, and is the evaporation speed. For a characteristic particle size nm and mm, we have kPa, which is comparable to the measured . For a monodisperse suspension of particle radius , the permeability depends on the square of the pore size and can be calculated by the Carman-Kozeny relation , where is the final volume fraction. We observed that the large particles dominate the stress even if they are present at a low number fraction (Fig. 4(b)). We interpret this observation as indicating the formation of a continuous path for flow due to large pore sizes formed by the large particles, which increases the permeability.
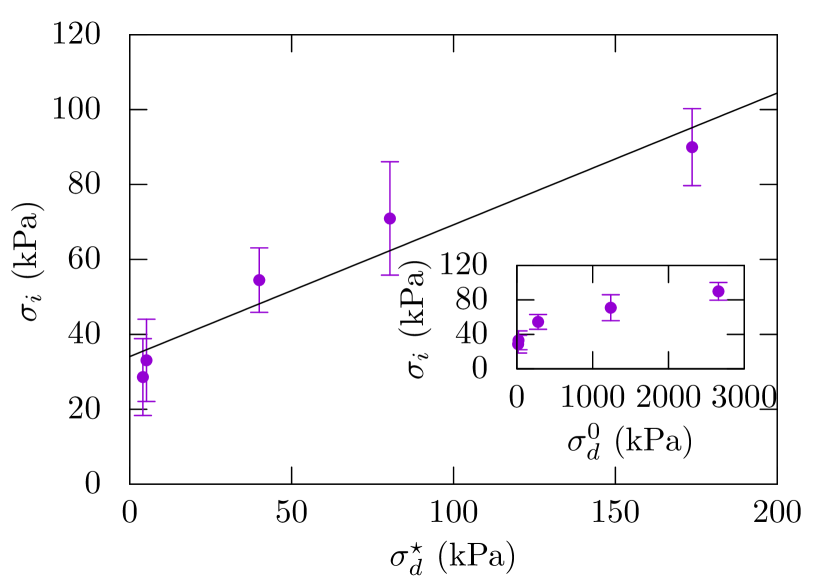
We performed experiments for different average particle sizes. The results are represented in Fig. 5 and the inset shows the stress calculated from the wrinkle length as a function of the Darcy stress for the average particle size (Eq. 5). For the permeability, the Carman-Kozeny relation is used to calculate a characteristic value. Moreover, we define a particle size to take into account the particle polydispersity. This size is defined as the average particle size of the % largest particles of the distribution (Section S2, SI SI ). From these values, we calculate the Darcy stress shown in Fig. 5. These results indicate that the stress measured from the length of the wrinkles is comparable to , while it is significantly different if the average particle size is considered. Thus, we conclude that the large particles plays a major role in the final drying stress of a colloidal suspension. The detailed relationship between the drying stress and the stress in the membrane remains to be established and has to account for the geometrical aspects of the deposit and the deformation of the membrane beneath the deposit.
In summary, we have studied the consolidation of colloidal silica nanoparticles in the geometry of a drop placed in the center of a thin circular elastomeric sheet floating on a liquid bath. As the drying proceeds, the consolidation of the colloidal drop triggers a wrinkling instability of the membrane. We demonstrated that this technique allows a measurement of the final tensile stress applied by the deposit on the substrate. We used this method to measure the effects of the particle size and the polydispersity.
For a mixture of small and large particles with a typical size ratio of about 10, the addition of about 1 % of large particles reduces the stress value obtained for the suspension of small particles to the value observed for large particles only. Indeed, colloidal suspensions are generally polydisperse. Our work provides evidence that the contribution of the particle size polydispersity on the tensile stress is dominated by the largest particles. We interpreted these results by the percolation of the largest particles that creates paths with a larger pore size, which reduces the tensile stress due to the pressure gradient of the Darcy flow, accompanying evaporation of the liquid.
We believe that these results are significant for future investigations regarding the quantitative measurement of the drying stress in more complex materials. Our findings could influence the study of the emergence of tensile stress in drying materials, which often leads to delamination or substrate deformations that must be avoided in many technological applications. As future work, it will be important to derive a numerical or theoretical model to understand more quantitatively the effect of the polydispersity on the tensile stress.
Acknowledgements.
We are very grateful to I. Cantat, B. Davidovitch, B. Saintyves and J.-B. Salmon for stimulating discussions. We thank J.-M. Copin and M. Persson for providing Klebosol and Levasil samples, respectively. We also thank R. K. Prud’homme for the use of the Malvern Zetasizer, J. Feng and B. K. Wilson for assistance, as well as J. Schreiber for assistance with SEM images. F.B. acknowledges that the research leading to these results received funding from the People Programme (Marie Curie Actions) of the European Union’s Seventh Framework Programme (FP7/2007-2013) under REA grant agreement 623541.References
- (1) D. James, B.K.C Kjellander, W.T. Smaal, G. Gelinck, C. Combe, I. McCulloch, R. Wilson, J. Burroughes, D.C. Bradley, and J.-S. Kim. Thin-film morphology of inkjet-printed single-droplet organic transistors using polarized Raman spectroscopy: effect of blending TIPS-pentacene with insulating polymer. ACS Nano, 5:9824–9835, 2011.
- (2) J. A. Rogers, T. Someya, and Y. Huang. Materials and mechanics for stretchable electronics. Science, 327(5973):1603–1607, 2010.
- (3) J. Boley, E. White, and R. Kramer. Mechanically sintered gallium-indium nanoparticles. Advanced Materials, 27:2355–2360, 2015.
- (4) J.-W. Jeong, W.-H. Yeo, A. Akhtar, J.S. Norton, Y.-J. Kwack, S. Li, S.-Y. Jung, Y. Su, W. Lee, J. Xia, H. Cheng, Y. Huang, W.-S. Choi, T. Bretl, and J. Rogers. Materials and optimized designs for human-machine interfaces via epidermal electronics. Advanced Materials, 25:6839–6846, 2013.
- (5) E. Jerison, Y. Xu, L. Wilen, and E. Dufresne. Deformation of an elastic substrate by a three-phase contact line. Phys. Rev. Lett., 106:186103, 2011.
- (6) A. Marchand, S. Das, J. Snoeijer, and B. Andreotti. Contact angles on a soft solid: from Young’s law to Neumann’s law. Phys. Rev. Lett., 109:236101, 2012.
- (7) J. Dervaux and L. Limat. Contact lines on soft solids with uniform surface tension: analytical solutions and double transition for increasing deformability. Proceedings of the Royal Society of London., 471, 2015.
- (8) F. Boulogne and H.A. Stone. Self-crumpling elastomers: bending induced by the drying stimulus of a nanoparticle suspension. EPL, 108:19001, 2014.
- (9) C. Petersen, C. Heldmann, and D. Johannsmann. Internal stresses during film formation of polymer latices. Langmuir, 15(22):7745–7751, 1999.
- (10) H.N. Yow, M. Goikoetxea, L. Goehring, and A.F. Routh. Effect of film thickness and particle size on cracking stresses in drying latex films. J. Coll. and Int. Sci., 352:542–548, 2010.
- (11) K.R. Thomas and U. Steiner. Direct stress measurements in thin polymer films. Soft Matter, 7:7839–7842, 2011.
- (12) M. Chekchaki and V. Lazarus. Mechanical stresses induced by evaporation in consolidated colloidal suspensions of hard particles. poroelasticity theory versus experiments. Transport in Porous Media, 100(1):143–157, 2013.
- (13) J. Li, B. Cabane, M. Sztucki, J. Gummel, and L. Goehring. Drying dip-coated colloidal films. Langmuir, 28:200–208, 2012.
- (14) E. Cerda and L. Mahadevan. Geometry and physics of wrinkling. Phys. Rev. Lett., 90:074302, 2003.
- (15) J.-C. Géminard, R. Bernal, and F. Melo. Wrinkle formations in axi-symmetrically stretched membranes. Eur. Phys. J. E., 15:117–126, 2004.
- (16) O. Oshri, F. Brau, and H. Diamant. Wrinkles and folds in a fluid-supported sheet of finite size. Phys. Rev. E, 91:052408, May 2015.
- (17) P. Damman. Polymer Surfaces in Motion: Unconventional Patterning Methods, chapter Elastic Instability and Surface Wrinkling, pages 183–200. Springer International Publishing, 2015.
- (18) J. Huang, M. Juszkiewicz, W. De Jeu, E. Cerda, T. Emrick, N. Menon, and T. Russell. Capillary wrinkling of floating thin polymer films. Science, 317:650–653, 2007.
- (19) B. Davidovitch, R. Schroll, D. Vella, M. Adda-Bedia, and E. Cerda. Prototypical model for tensional wrinkling in thin sheets. Proc. of the Nat. Acad. of Sci., 108:18227–18232, 2011.
- (20) H. King, R. Schroll, B. Davidovitch, and N. Menon. Elastic sheet on a liquid drop reveals wrinkling and crumpling as distinct symmetry-breaking instabilities. Proc. Nat. Acad. of Sci., 109:9716–9720, 2012.
- (21) K.B. Toga, J. Huang, K. Cunningham, T.P. Russell, and N. Menon. A drop on a floating sheet: boundary conditions, topography and formation of wrinkles. Soft Matter, 9:8289–8296, 2013.
- (22) M. Pineirua, N. Tanaka, B. Roman, and J. Bico. Capillary buckling of a floating annulus. Soft Matter, 9:10985–10992, 2013.
- (23) See Supplemental Material [url], which includes Refs. Davidovitch2011 ; Taylor2015 .
- (24) M. Taylor, B. Davidovitch, Z. Qiu, and K. Bertoldi. A comparative analysis of numerical approaches to the mechanics of elastic sheets. Journal of the Mechanics and Physics of Solids, 79:92 – 107, 2015.
- (25) A. Bouchoux, P.-E. Cayemitte, J. Jardin, G. Gésan-Guiziou, and B. Cabane. Casein micelle dispersions under osmotic stress. Biophysical Journal, 96:693–706, 2009.
- (26) M. I. Smith and J. S. Sharp. Effects of substrate constraint on crack pattern formation in thin films of colloidal polystyrene particles. Langmuir, 27(13):8009–8017, 2011.
- (27) R. Deegan, O. Bakajin, T. Dupont, G. Huber, S. Nagel, and T. Witten. Contact line deposits in an evaporating drop. Phys. Rev. E, 62:756–765, 2000.
- (28) F. Boulogne, L. Pauchard, F. Giorgiutti-Dauphiné, R. Botet, R. Schweins, M. Sztucki, J. Li, B. Cabane, and L. Goehring. Structural anisotropy of directionally dried colloids. EPL, 105:38005, 2014.
- (29) E. Di Giuseppe, A. Davaille, E. Mittelstaedt, and M. François. Rheological and mechanical properties of silica colloids: from Newtonian liquid to brittle behaviour. Rheologica Acta, 51:451–465, 2012.
- (30) R. Iler. The Chemistry of Silica: Solubility, Polymerization, Colloid and Surface Properties and Biochemistry of Silica. Wiley-Interscience, 1979.
- (31) P. Lidon and J.-B. Salmon. Dynamics of unidirectional drying of colloidal dispersions. Soft Matter, 10:4151–4161, 2014.
- (32) L. Pauchard. Patterns caused by buckle-driven delamination in desiccated colloidal gels. EPL, 74(1):188, 2006.
- (33) R. E. Trueman, E. Lago Domingues, S. N. Emmett, M. W. Murray, J. L. Keddie, and A. F. Routh. Autostratification in drying colloidal dispersions: experimental investigations. Langmuir, 28(7):3420–3428, 2012.
- (34) A.F. Routh. Drying of thin colloidal films. Reports on Progress in Physics, 76(4):046603, 2013.
- (35) Andrea Fortini, Ignacio Martín-Fabiani, Jennifer Lesage De La Haye, Pierre-Yves Dugas, Muriel Lansalot, Franck D’Agosto, Elodie Bourgeat-Lami, Joseph L. Keddie, and Richard P. Sear. Dynamic stratification in drying films of colloidal mixtures. Phys. Rev. Lett., 116:118301, 2016.
- (36) T.K. Sherwood. The drying of solids I. Industrial & Engineering Chemistry, 21:12–16, 1929.
- (37) C.J. Brinker and G.W. Scherer. Sol-Gel Science: The Physics and Chemistry of Sol-Gel Processing. Academic Press, 1990.
- (38) F. Boulogne, F. Giorgiutti-Dauphiné, and L. Pauchard. Surface patterns in drying films of silica colloidal dispersions. Soft Matter, 11:102–108, 2015.
- (39) J. Thiery, S. Rodts, E. Keita, X. Chateau, P. Faure, D. Courtier-Murias, T. E. Kodger, and P. Coussot. Water transfer and crack regimes in nanocolloidal gels. Phys. Rev. E, 91:042407, 2015.
- (40) J. M. Salamanca, E. Ciampi, D. A. Faux, P. M. Glover, P. J. McDonald, A. F. Routh, A. C. I. A. Peters, R. Satguru, and J. L. Keddie. Lateral drying in thick films of waterborne colloidal particles. Langmuir, 17(11):3202–3207, 2001.
Supporting Information
S1. Detailed experimental setup
Floating films
Polydimethylsiloxane (PDMS, sylgard 184, Dow Corning) is mixed and degassed at C to slow down the reaction and to ensure a reproducible viscosity. A silicon wafer is first coated with a 10% wt. aqueous solution of polyvinyl alcohol (PVA, Sigma-Aldrich, kDa). The coating is dried until a uniform color is obtained. Then, the PDMS is spin coated on this wafer and placed in an oven at C for 10 hours. The edge of the coated PDMS is removed to obtain a circular film of diameter mm. A petri dish, painted in black to enhance the contrast on the picture, is partially filled with deionized water. The wafer is dipped in this bath to dissolve the sacrificial layer of PVA and to detach the PDMS film. Once the PDMS film is fully detached and floats at the surface, the wafer is removed. We used a white light spectrometer (OceanOptics USB2000+ used with a LS-1-LL tungsten halogen light source) to measure the film thicknesses, which range between m. The presence of PVA lowers the surface tension of the bath, which is mN/m.
Visualisation
Our experiments of controlled drying of drops are performed in a transparent glove box, which has humidity controller presented in Fig. S1. The relative humidity is set to % in all of our experiments. A grid is placed in the glove box on the top of the sample and a light source is placed behind a light diffuser to obtain an even illumination. The deformation of the membrane is visualised by the distortion of the pattern made by the grid. The time evolution of the system is recorded by a Nikon camera (D7100) mounted with a 18-55mm Nikon objective (Fig. S1).
S2. Preparation and characterization of the colloidal suspensions
Dialysis
Each suspension was dialysed to ensure that they have the same properties (ionic strength and pH). Dialysis bags (12-14 kDa, Fisherbrand) are partially filled with the colloidal solutions. A solution denoted s1 is prepared from deionized water, the pH is raised to 9.5 by the addition of NaOH and the ionic strength is adjusted by the addition of mM of NaCl. To wash these suspensions, the bags are plunged in large baths of solution s1 for 10 days and baths are replaced twice. Then, the diluted suspensions are concentrated by osmotic stress. This second step consists in preparing a bath in which polyethylene glycol (Sigma-Aldrich, 35 kDa) is dissolved in a solution s1. Mass fractions are measured and the suspensions are diluted with a solution s1 to reach a mass fraction , which corresponds to a volume fraction .
Particle size
The particle size distributions are characterized by Dynamic Light Scattering (DLS) with a Malvern Zetasizer Nano ZS instrument. Samples are diluted to a volume fraction of . We denote the distribution function of particle number and , the distribution function in volume, and satisfy
| (S1) | |||
| (S2) |
The average particle radius is defined as
| (S3) |
The particle radius , representative of the large particles of the distribution is defined as follow. We consider 30% of the tail of the particle distribution , i.e. with
| (S4) |
The radius is the average particle size of the distribution tail, i.e
| (S5) |
The suspension properties are summarized in Table S1.
![[Uncaptioned image]](/html/1605.05915/assets/x9.png)
| Name | SM | HS | TM | Kleb | Lev |
|---|---|---|---|---|---|
| (nm) | 7 | 11 | 23 | 81 | 92 |
| (nm) | 20 | 30 | 42 | 117 | 132 |
S3. Particle organization
For blend suspensions, we define the particle volume ratio as
| (S6) |
and the particle number ratio as
| (S7) |
where and are the average radii of small and large particles, respectively.
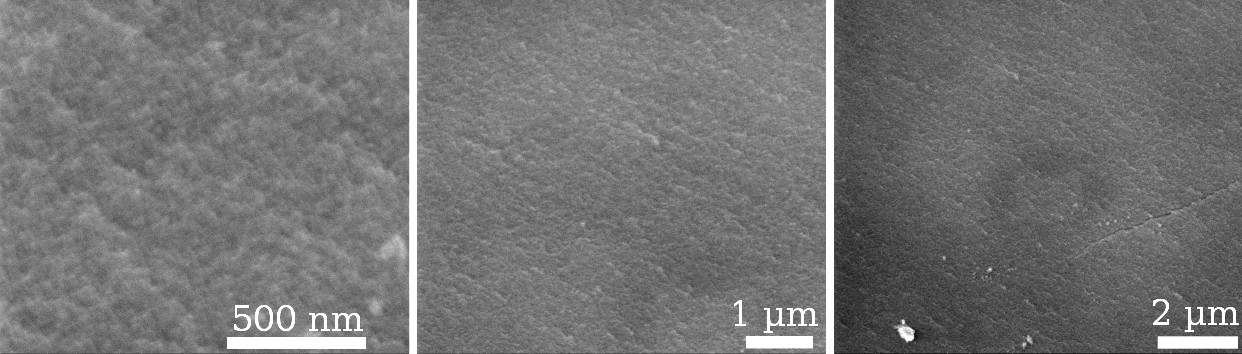
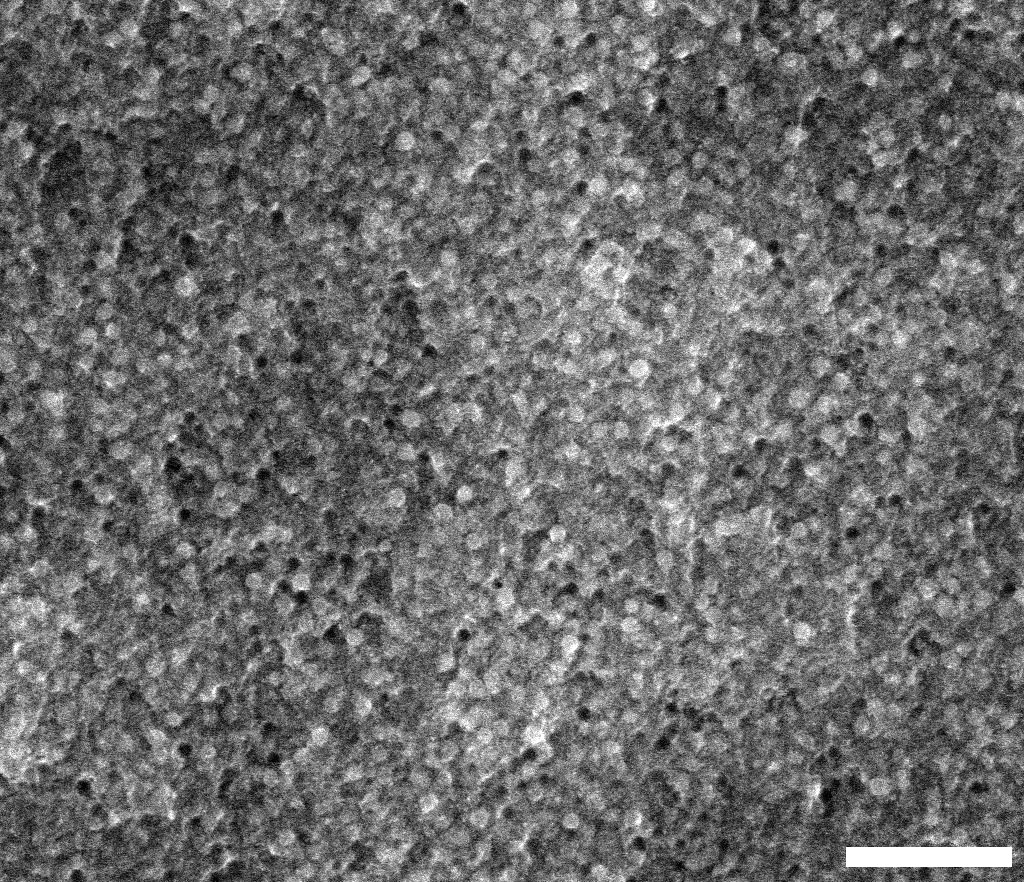
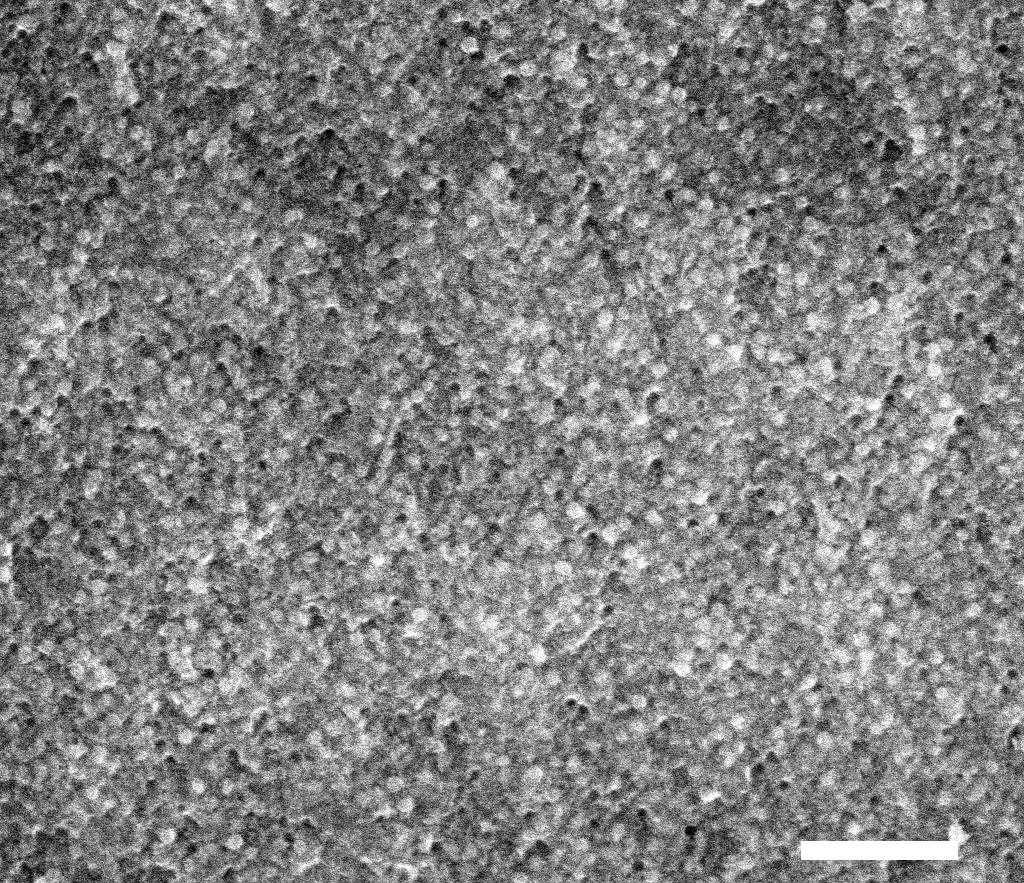
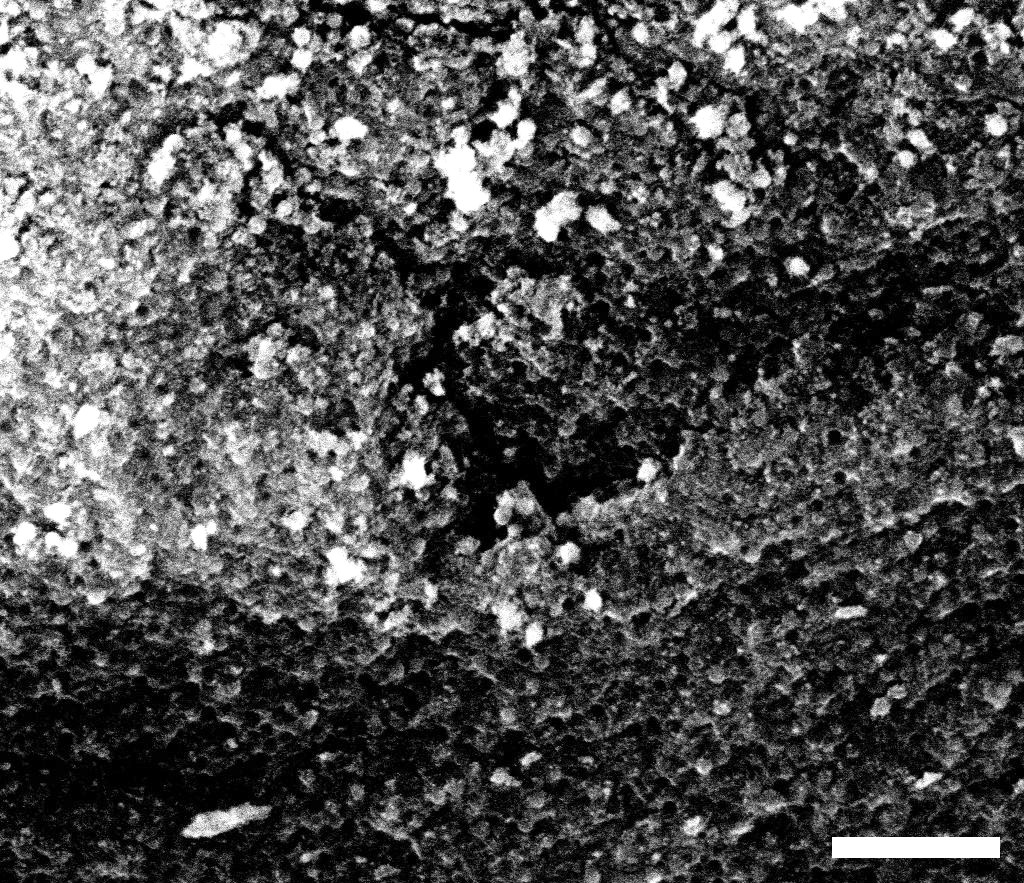
SEM images of dried drops of colloidal suspensions were captured with the FEI Quanta 200 FEG Environmental-SEM in low vacuum mode. Samples are prepared in the same conditions as presented in section S1. To image cross-sections, a razor blade is gently pressed on the top of the deposit to nucleate a crack along the diameter. The two pieces are then separated and placed on a sample holder.
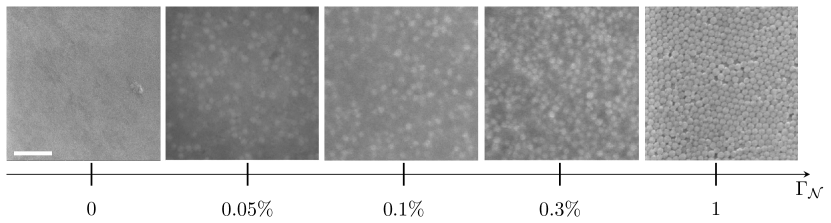
In this section, we present additional images. In Fig. S3, the cross section of a dried deposit containing only SM particle is imaged and we see that the particle size is smaller than the resolution we could obtain. In Fig. S4, we present cross sections images for %. As for the pictures in the main text, we do not see a segregation of the large particles across the thickness. Also, similar particle organisations are obtained on the top and near the contact line. In Fig. S5, we imaged the surface of the deposits for different where we notice the presence of the large particles as their concentration increases.
In our experiment, we can estimate the Péclet numbers for small () and large () particles. The Péclet number is defined as where is the evaporation speed, the characteristic thickness and the diffusion coefficient. We use the Stokes-Einstein diffusion coefficient , where is the Boltzmann constant, is the absolute temperature, Pas is the solvent viscosity and the particle radius.
For our bidisperse suspensions and considering the average particle size of each species, we have and for mm. Fortini et al. evidenced numerically and experimentally a segregation effect in drying films with for both species (Fortini et al. PRL 116, 118301 (2016)). However, as shown in our SEM images, we could not observe a significant segregation of the two species in the dried film. Nevertheless, as pointed by Fortini et al., the segregation is a dynamic process that is observed after a transient state. The duration of this transient must be function the specific interactions between the particles and the initial volume fraction. In our system, the material becomes visco-plastic at a volume fraction about and our initial volume fraction is . Thus, a possible explanation is that the system cannot evolve to a segregated state. This observations would deserve further investigations, which are beyond the scope of the present study.
S4. Bendability-tension diagram
In our experiments, we measure the final length of the wrinkles . Then, from models derived by Davidovitch et al. Davidovitch2011 , we calculate the inner tension applied by the deposit on the film.
Davidovitch et al. predict this tension in two different domains. The first domain is named Near Threshold (NT) limit and correspond to the limit of infinitesimal deformation amplitude and large bendability (. In that domain, the tension ratio is given by
| (S8) |
which corresponds to equation (1) in the Letter. The tension ratios for this limit and for all our experiments are presented in Fig. S6(a). The second domain is the Far From Threashold (FFT) limit and it assumes that the deformation is finite and . Therefore, the tension ratio is
| (S9) |
which corresponds to equation (2) in the Letter. Similarly, we plot this prediction for our data in Fig. S6(b).
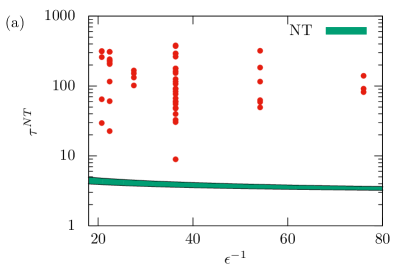
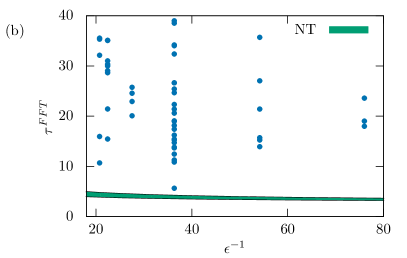
In Fig. S6, we also represent the NT domain predicted by Davidovitch et al. Davidovitch2011 and we observe that both estimations are above the NT limit. If the NT limit would describe our results, we expect that values to be in the NT green domain, but the prediction is about at least an order of magnitude higher. Thus, the estimate from the NT limit is not self-consistent. Let us now consider the values deduced from the FFT limit. These values are also above the NT domain (represented in green in Fig. S6(b)), which is self-consistent. Also, we observe that , which further validates that the NT prediction is not valid as the prediction is significantly above the NT domain. Consequently, for all our measurements, we considered .
Let us remark that equations (S8) and (S9) are valid for . More general equations have been established recently Taylor2015 but they do not modify significantly the estimate of the tension in the film in our experiments, which confirms this assumption.
References
- (1) B. Davidovitch, R. Schroll, D. Vella, M. Adda-Bedia, and E. Cerda. Prototypical model for tensional wrinkling in thin sheets. Proc. of the Nat. Acad. of Sci., 108:18227–18232, 2011.
- (2) M. Taylor, B. Davidovitch, Z. Qiu, and K. Bertoldi. A comparative analysis of numerical approaches to the mechanics of elastic sheets. Journal of the Mechanics and Physics of Solids, 79:92 – 107, 2015.