Raman spectroscopy of KxCo2-ySe2 single crystals near the ferromagnet-paramagnet transition
Abstract
Polarized Raman scattering spectra of the KxCo2-ySe2 single crystals reveal the presence of two phonon modes, assigned as of the A1g and B1g symmetry. Absence of additional modes excludes the possibility of vacancy ordering, unlike in KxFe2-ySe2. The ferromagnetic (FM) phase transition at K leaves a clear fingerprint on the temperature dependence of the Raman mode energy and linewidth. For the temperature dependence looks conventional, driven by the thermal expansion and anharmonicity. The Raman modes are rather broad due to the electron-phonon coupling increased by the disorder and spin fluctuation effects. In the FM phase the phonon frequency of both modes increases, while an opposite trend is seen in their linewidth: the A1g mode narrows in the FM phase, whereas the B1g mode broadens. We argue that the large asymmetry and anomalous frequency shift of the B1g mode is due to the coupling of spin fluctuations and vibration. Our density functional theory (DFT) calculations for the phonon frequencies agree rather well with the Raman measurements, with some discrepancy being expected since the DFT calculations neglect the spin fluctuations.
pacs:
78.30.-j; 74.25.Kc; 63.20.kg; 63.20.kd1 Introduction
In the last few years considerable attention was focused on the iron-based superconductors in an effort to gain deeper insight into their physical properties and to determine the origin of high- superconductivity [1, 2, 3, 4]. Discovery of superconductivity in alkali-doped iron chalcogenides, together with its uniqueness among the iron based superconductors, challenged the physical picture of the superconducting mechanism in iron pnictides [5]. Absence of hole pockets even suggested the possibility for the different type of pairing mechanism [6]. Another striking feature in KxFe2-ySe2 was the presence of the intrinsic nano to mesoscale phase separation between an insulating phase and a metallic/superconducting phase [7, 8, 9, 10]. Insulating phase hosts antiferromagnetically, ordered iron vacancies, whereas superconducting stripe-like phase is free of vacancies [7]. Theoretical study of Huang et al. [11] revealed that proximity effects of the two phases result in the Fermi surface deformation due to interlayer hopping and, consequently, suppression of superconductivity. On the other hand, large antiferromagnetic order protects the superconductivity against interlayer hopping, thus explaining relatively high in KxFe2-ySe2 [11]. However, the correlation between the two phases and its impact on superconductivity are still not fully understood.
Although the absolute values of resistivity are much smaller for the Ni-member of the KxM2-ySe2 (M = transition metal) series than for the iron member, this material does not exhibit superconductivity down to 0.3 K [12]. As opposed to KxFe2-ySe2, vacancy ordering has not been observed in the KxNi2-ySe2 single crystal [13]. These materials, together with the Co- and Ni-doped KxFe2-ySe2 single crystals, have very rich structural, magnetic and transport phase diagrams. This opens a possibility for fine tuning of their physical properties by varying the sample composition [14, 15]. First results obtained on KxCo2-ySe2 single crystal revealed the ferromagnetic ordering below 74 K, as well as the absence of the superconducting phase [16].
Raman spectroscopy is a valuable tool not only for measuring vibrational spectra, but also helps in the analysis of structural, electronic and magnetic properties, and phase transitions. There are several recent studies of the influence of the antiferromagnetic order, [17, 18] ferromagnetism, [19, 20] and magnetic fluctuations [21] on the Raman spectra.
In this paper the Raman scattering study of KxCo2-ySe2 single crystal (x=0.3, y=0.1), together with the lattice dynamics calculations of KCo2Se2, is presented. The polarized Raman scattering measurements were performed in the temperature range from 20 K up to 300 K. The observation of only two Raman active modes when measuring from the (001)-oriented samples suggests that KxCo2-ySe2 single crystal has no ordered vacancies. The temperature dependence of the energy and linewidth of the observed Raman modes reveals a clear fingerprint of the phase transition. Large linewidth of the B1g mode and its Fano line shape indicate the importance of spin fluctuations.
The rest of the manuscript is organized as follows. Section II contains a brief description of the experimental and numerical methods, Section III are the results, and Section IV contains a discussion of the phonon frequencies and linewidths and their temperature dependencies. Section V summarizes the results.
2 Experiment and numerical method
Single crystals of KxCo2-ySe2 were grown by the self-flux method, as described in Ref. [12]. The elemental analysis was performed using energy-dispersive x-ray spectroscopy (EDX) in a JEOL JSM-6500 scanning electron microscope. Raman scattering measurements were performed on freshly cleaved (001)-oriented samples with size up to 331 mm3, using a TriVista 557 Raman system equipped with a nitrogen-cooled CCD detector, in backscattering micro-Raman configuration. The 514.5 nm line of an Ar+/Kr+ ion gas laser was used as an excitation source. A microscope objective with magnification was used for focusing the laser beam. All measurements were carried out at low laser power, in order to minimize local heating of the sample. Low temperature measurements were performed using KONTI CryoVac continuous flow cryostat with 0.5 mm thick window. Spectra were corrected for the Bose factor.
The electronic structure of the ferromagnetic (FM) and paramagnetic (PM) phases is calculated within the density functional theory (DFT), and the phonon frequencies at the -point are obtained within the density functional perturbation theory (DFPT) [22]. All calculations are performed using the QUANTUM ESPRESSO package [23]. We have used Projector Augmented-Wave (PAW) pseudo-potentials with Perdew-Burke-Ernzerhof (PBE) exchange-correlation functional with nonlinear core correction and Gaussian smearing of 0.005 Ry. The electron wave-function and the density energy cutoffs are 40 Ry and 500 Ry, respectively. The Brillouin zone is sampled with 16168 Monkhorst-Pack k-space mesh. The phonon frequencies were calculated with relaxed unit cell parameters and, for comparison, with the unit cell size taken from the experiments and the relaxed positions of only Se atoms. The forces acting on individual atoms in the relaxed configuration were smaller than Ry/a.u. and the pressure smaller than 0.5 kbar.
3 Results
KCo2Se2 crystallizes in the tetragonal crystal structure of ThCr2Si2-type, space group, which is shown in Figure 1. The experimental values of the unit cell parameters are 3.864(2) and 13.698(2) [24]. The potassium atoms are at :, Co atoms at :, and Se atoms at : Wyckoff positions, with the experimental value .
KCo2Se2 single crystal consists of alternatively stacked K ions and CoSe layers, isostructural to the KFe2Se2 [25]. Factor group analysis for the space group yields a normal mode distribution at the Brillouin-zone center which is shown in Table 1. According to the selection rules, when measuring from the (001)-plane of the sample, only two modes (A1g and B1g) are expected to be observed in the Raman scattering experiment. Displacement patterns of the experimentally observable Raman modes are illustrated in Fig. 1. The A1g (B1g) mode represents the vibrations of the Se (Co) ions along the -axis, whereas the Eg modes (which are not observable for our scattering configuration) involve the vibration of both Co and Se ions within the (001)-plane.
| Atoms | Wyckoff positions | Irreducible representations | |
| K | 2a | A2u+Eu | |
| Co | 4d | A2u+B1g+Eg+Eu | |
| Se | 4e | A1g+A2u+Eg+Eu | |
| Raman tensors | |||
| Activity and selection rules | |||
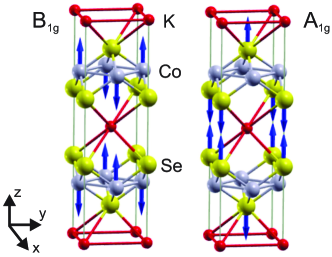
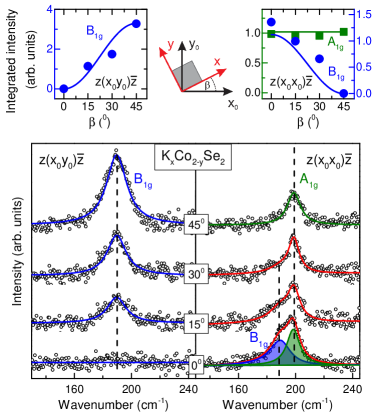
Figure 2 shows polarized Raman scattering spectra of KxCo2-ySe2 single crystal, measured from the (001)-plane of the sample at room temperature, in different sample orientations. Only two modes, at about 187 and 198 cm-1, are observed, which is in agreement with the selection rules for (001)-oriented samples. In some iron-chalcogenide compounds, the appearance of additional Raman active modes due to the iron vacancy ordering and, consequently, symmetry lowering, has been observed [8, 26]. Absence of additional phonon modes in Fig. 2 suggests that in KxCo2-ySe2 single crystals vacancy ordering does not occur in our samples.
Selection rules imply that the A1g mode may be observed for any sample orientation, provided that the polarization vector of the incident light is parallel to the scattered light polarization vector , whereas it vanishes if these vectors are perpendicular. On the other hand, the intensity of the B1g mode strongly depends on the sample orientation (, where and ) [8]. This implies that, in parallel polarization configuration (), the intensity of the B1g mode is maximal when the sample is oriented so that , gradually decreases with increasing and finally vanishes for . In crossed polarization configuration (), B1g mode intensity decreases from its maximal value for to zero, which reaches when . From Fig. 2 it can be seen that the intensity of the Raman mode at about 187 cm-1 coincides with theoretically predicted behavior for the B1g mode; thereby, this phonon mode is assigned accordingly. Phonon mode at 198 cm-1, which is present in Raman spectra only for parallel polarization configuration () and whose intensity is independent on the sample orientation, can be assigned as the A1g mode. The intensity ratio of the two Raman modes can be obtained from the spectrum measured in () scattering geometry as . Having in mind that the A1g mode intensity is given by [8] , the ratio of the appropriate Raman tensor components can be estimated as .
. (Å) (Å) FMrel 3.893 13.269 0.350 PMrel 3.766 13.851 0.368 FMfixed 3.864 13.698 0.3486 PMfixed 3.864 13.698 0.3496 Exper. 3.864 13.698 0.347

| Symmetry | Activity |
|
|
|
|
|
||||||||||
| A1g | Raman | 201.9 | 201.3 | 199.5 (193.2) | 212.6 (193.1) | Se(z) | ||||||||||
| B1g | Raman | 195.3 | 194.2 | 171.2 (172.7) | 176.6 (168.1) | Co(z) | ||||||||||
| E | Raman | 93.1 (100.7) | 92.7 (99.0) | Co(xy), Se(xy) | ||||||||||||
| E | Raman | 237.9 (237.6) | 257.2 (235.6) | Co(xy), Se(xy) | ||||||||||||
| A | IR | 115.1 (99.0) | 113.7 (102.9) | K(z), Se(-z) | ||||||||||||
| A | IR | 246.7 (241.4) | 250.9 (241.4) | Co(z), K(-z) | ||||||||||||
| E | IR | 97.9 (95.0) | 100.1 (95.0) | K(xy) | ||||||||||||
| E | IR | 239.0 (229.7) | 231.0 (229.9) | Co(xy), Se(-xy) |
The experimentally determined frequencies are compared with those obtained with DFT numerical calculations. The experimental lattice constants [24] are shown in Table II, together with their values from the DFT calculation which relaxes or keeps fixed the unit cell size. The DFPT phonon frequencies obtained using the fully relaxed atomic positions in both FM and PM phases are given in Table III, with the corresponding values obtained with the fixed unit cell size and relaxed only fractional coordinate given in the parenthesis. The equilibrium atomic positions in the FM solution are given by Å, Å, and . The corresponding phonon frequencies are 199.5 for A1g mode and 171.2 for B1g mode. When we enforce the PM solution, we obtain Å, Å, and , and 212.6 , 176.6 for the frequencies of the A1g and B1g mode, respectively. These values agree rather well with the experimental data, and agree with recently published numerical results [27, 28]. They can be used to confirm the experimental assignment of the modes, but cannot resolve subtle changes of the phonon frequencies near the FM-PM transition. This level of discrepancy is expected for metallic materials with magnetic ordering since the DFT calculations neglect spin fluctuations, as discussed in some detail in the next Section (see also Ref. [21]). A rather large difference between the calculated frequencies in the two phases is due the relatively large change in the unit cell size. This difference between the unit cell sizes in the FM and PM phases is overestimated in the calculation which neglects spin fluctuations. For comparison, we also calculated the frequencies keeping the experimental values of the unit cell size, and relaxing just the coordinate of the Se atoms, which is often done in the case of iron based superconductors and related compounds [21]. This gives in the FM solution and in the PM solution, while the change in the phonon frequencies between the two solutions is much smaller, see Table III and a discussion in Section IV.
Polarized Raman scattering spectra of KxCo2-ySe2 single crystals, measured at various temperatures from the (001)-plane of the sample, are presented in Figure 3. Orientation of the sample is chosen so that each of the observable modes appears in different polarization configuration. A pronounced feature in the spectra is an asymmetric Fano profile of the B1g mode, persisting down to low temperatures, as well as its large linewidth compared to isostructural KxFe2-ySe2 [8, 29]. This feature should by mainly due to the spin fluctuations influencing the B1g vibrational mode which modulates the distances between the magnetic Co atoms. A detailed discussion of the frequency and linewidth temperature dependence is given in the next Section.
4 Discussion
There are several factors that affect the phonon frequencies (energies) and linewidths, and their changes across the FM-PM transition. In general, the temperature dependence of the phonon frequency of the mode , , is influenced by thermal expansion and magnetostriction, anharmonicity effects, electron-phonon and magnetic exchange interaction (spin-phonon coupling) [30, 31]
| (1) | |||||
The first term is the frequency shift due to the change of the unit cell size caused by the thermal effects and magnetostriction. is the anharmonic frequency shift. appears due to the change in the electron-phonon interaction primarily influenced by changes in the electronic spectrum near the Fermi level, and is the spin-phonon contribution caused by the modulation of exchange interaction by lattice vibrations.
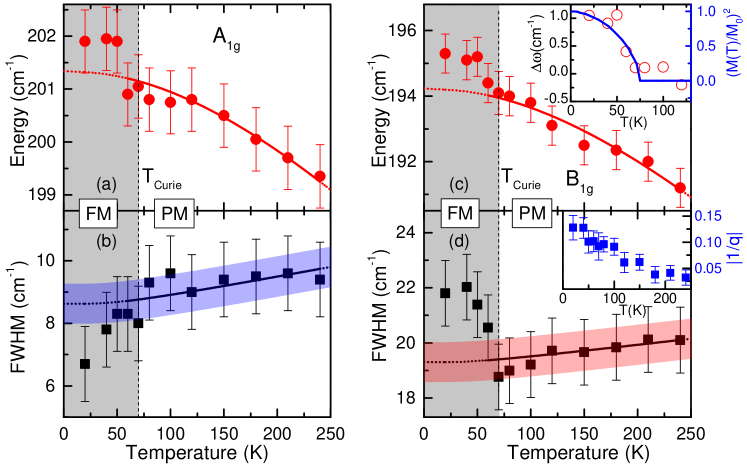
In our case of KxCo2-ySe2, for temperatures above , decreases and (full width at half-maximum, FWHM) increases with increasing temperature for and modes, similar as in the Raman spectra of many other materials. However, they show anomalous behavior near , see Figure 4. In the following, we analyze and more closely.
4.1 Phonon frequencies
The frequencies of the A1g and B1g modes change by less than 2 percent in the temperature range between 20 K and 250 K. The red solid lines in Figs. 4(a),(c) represent the fits of the phonon energy temperature dependence (see below), following the frequencies of the two modes in the high-temperature PM phase. The red dotted line is the extrapolation to . For , the temperature dependence of the frequency looks conventional for both modes: the frequency decreases with increasing temperature. This behavior is expected both due to the thermal expansion and the anharmonicity. These two effects can be standardly analyzed as follows.
The temperature dependent frequency of the vibrational mode is given by
| (2) |
where denotes the temperature independent term and can be decomposed as [32, 33, 19]
| (3) |
describes a change of the Raman mode energy as a consequence of the lattice thermal expansion and can be expressed with [32]
| (4) |
where is the Grüneisen parameter of the Raman mode and is the thermal expansion coefficient of a considered single crystal. represents the anharmonic contribution to the Raman mode energy. If we assume, for simplicity, that anharmonic effects are described by three-phonon processes, this term is given by [32, 34]
| (5) |
where is the anharmonic constant and is a fitting parameter which describes the phonon-phonon coupling, including the nonsymmetric phonon decay processes.
The relative importance of the thermal expansion and anharmonicity to frequency changes is, to the best of our knowledge, not yet firmly established for pnictides and chalcogenides. In several cases [17, 13] the anharmonic formula, Eq. (5), is used for the fit. We follow here the arguments from Refs. [35, 19, 29] that is dominated by the thermal expansion. To the best of our knowledge, the thermal expansion coefficient of KxCo2-ySe2 single crystal is unknown. For estimating the lattice thermal expansion contribution to the phonon energy change, the coefficient for FeSe, given in Ref. [36], is used. The best fit shown in our Fig. 4 is obtained with cm-1, and cm-1, .
There exists a shift in phonon frequencies as the temperature is lowered below . This shift does not show clear discontinuity (as well as the corresponding shift in the linewidths) and no additional modes are registered in the Raman spectra, which suggest that the FM-PM transition is continuous, without structural changes. There are several causes of the sudden frequency change as the sample gets magnetized. It can change due to the magnetostriction, modulation of the magnetic exchange by lattice vibrations (spin-phonon coupling), and due to the changes in the electron-phonon interaction due to spin polarization and changes in the electronic spectrum.
The effect of spin-phonon interactions, caused by the modulation of magnetic exchange interaction by lattice vibrations, may be quantitatively examined within the framework developed in Ref. [30] for insulating magnets, and recently applied also to several itinerant ferromagnets [37, 38, 39, 40]. In this model, the shift of the Raman mode energy due to the spin-phonon interaction is proportional to the spin-spin correlation function between nearest magnetic ions. This term should have the same temperature dependence as , where is the magnetization per magnetic ion at a temperature and is the saturation magnetization,
| (6) |
where is the extrapolation from the high-temperature data. This model does not predict the sign of the phonon energy shift - softening or hardening. From the inset in Fig. 4(c) it can be seen that the B1g mode energy renormalization scales well with the curve. However, the effect of the magnetostriction (change of the unit cell size due to the magnetization) cannot be excluded based just on this plot, especially since the A1g mode corresponding to the vibrations of nonmagnetic Se ions also shows a similar shift in frequency.
The DFT calculations can give us some guidance for understanding of the changes of the phonon frequencies and linewidths, but one has to be aware of its limitations. The DFT calculations (see Table II) give a rather large magnetostriction, i.e. rather large change in the size of the unit cell between the FM and PM phases ( changes by 3.2% and by 4.3%). This leads to very large changes in the phonon frequencies, see Table III. The calculated frequencies are lower in the FM phase, as opposed to the experimental data. This already points to the limitations of the DFT calculations, which is expected near the phase transition. Similar conclusion is also present in Ref. [21]. The DFT ignores spin fluctuations which often leads to quantitative discrepancy in various physical quantities [41] and, in some cases, even predicts wrong phases. In the case of KxCo2-ySe2, the DFT calculations correctly predict the FM ground state, but the calculated magnetic moment is much larger than the experimental value [16]. This already shows the importance of correlations and quantum fluctuations which are neglected within the DFT. Strong correlation effects can be captured using screened hybrid functional [42] or within the dynamical mean field theory combined with DFT (LDA+DMFT) [43], which is beyond our present work.
Since the magnetostriction effects are overestimated in the DFT calculations with relaxed unit cell size, we repeated the DFT (DFPT) calculations keeping the experimental value for the unit cell size and relaxing only the fractional coordinate (positions of the Se atoms). This is often done in the literature on iron based superconductors and related compounds [21]. Our calculated frequencies are given in the parenthesis in Table III. We see that the frequency changes between the two phases are small, in better agreement with the experiment.
4.2 Phonon linewidths
The phonon linewidths of the A1g and B1g modes are very large, and , which implies the importance of disorder (impurities, nonstoichiometry, lattice imperfections) in measured samples. In general, the broadening of the phonon lines can be a consequence of the electron-phonon interaction, disorder, spin fluctuations and anharmonicity effects. The temperature dependence of the linewidth in the PM phase is, however, very weak, which indicates that the anharmonicity effects are small. The DFT calculation of the linewidth is usually based on the Allen’s formula, [44] . Here, is the density of states (DOS) at the Fermi level, is the electron-phonon coupling constant, and is the phonon frequency of the mode and wavevector . A straightforward implementation of Allen’s formula in the limit corresponding to the point is, however, unjustified, as explained for example in Refs. [45, 46]. In addition, structural disorder and impurities break the conservation of the momentum, which means that phonons with finite wave vectors also contribute to the Raman scattering spectra. The standard DFT calculation for the Brillouin zone averaged electron-phonon coupling constant gives too small value to explain the large width of the Raman lines in pnictides and chalcogenides,[34] and several other metallic systems like MgB2 [45] and fullerides [47]. A correct estimate of the phonon linewidth can be obtained only by explicitly taking into account the disorder and electron scattering which enhances the electron-phonon interaction,[45, 47] which is beyond the standard DFT approach and scope of the present work.
The Raman mode linewidth is not directly affected by the lattice thermal expansion. Assuming that the three-phonon processes represent leading temperature dependent term in the paramagnetic phase, full width at half-maximum, , is given by
| (7) |
The first term represents the anharmonicity induced effects, where is the anharmonic constant. The second term includes the contributions from other scattering channels, i.e. structural disorder and/or coupling of phonons with other elementary excitations, like particle-hole and spin excitations. These effects, typically, depend very weakly on temperature, but can become important near the phase transition. The best fit parameters are for both modes, cm-1 and cm-1. The value cm-1 is adopted from Ref. [29] for related compound KxFe2-ySe2, where the anharmonic effects dominate the temperature dependence. We see that assume values much smaller than 1. Small and sometimes irregular changes in are also observed in other materials whose Raman spectra are considered to be dominated by spin fluctuations [34, 21]. Therefore, we believe that a simple separation of to the anharmonic and temperature independent term, which works well in many systems, is not appropriate for itinerant magnetic systems like KxCo2-ySe2. We conclude that the spin fluctuations and electron-phonon coupling are likely to affect the linewidth even above .
The electron-phonon interaction strength is proportional to the density of states at the Fermi level . Our DFT calculations for the DOS agree with those in Ref. [48]. The calculated DOS in the FM phase, /eV, is smaller than, /eV, in the PM phase. (Though, in reality, it is possible that the DOS significantly differs from the one given by the DFT calculations due to the spin fluctuations and disorder effects.) Therefore, one expects that the phonon line is narrower in the FM phase than in the PM phase. This is indeed the case for the A1g mode, but the opposite is observed for the B1g mode.
It is also interesting to note that the B1g mode is much more asymmetric than the A1g mode and almost twice broader. These two observations are in striking similarity with the Raman spectra in the quasi-one-dimensional superconductor K2Cr3As3 [21]. In this material the vibrational mode that modulates the distance between the magnetic Cr atoms also features large asymmetry and linewidth. In our case, the distances between the magnetic Co ions are modulated by the vibrations of the B1g mode, see Fig. 1. This leads us to the conclusion that the anomalous features of the B1g mode are the consequence of spin fluctuations coupled to the electronic structure via lattice vibrations (in addition to the magnetostriction and spin polarization, which change the electronic spectrum near the Fermi level and, therefore, affect the electron-phonon interaction for both modes). It should be noted that similar anomalous properties of B1g phonon were experimentally observed in cuprate high-temperature superconductor YBa2Cu3O7 [49, 50], and explained as a consequence of the out-of-phase nature of this mode which couples to oxygen-oxygen in-plane charge fluctuations [51, 52, 53] In the case of iron-based superconductors and related compounds, the chalcogen atoms and Fe (or Co) are not in the same plane and phonons of A1g symmetry can also directly couple with the electrons. A satisfactory agreement of theory and Raman experiments remains to be established [54].
The asymmetric B1g phonon line can be described by the Fano profile [55, 21, 37, 56]
| (8) |
where , is the bare phonon frequency, is the linewidth. is a constant and is the Fano asymmetry parameter. It serves as a measure of a strength of the electron-phonon coupling: an increase in indicates an increase in the electron-phonon interaction, more precisely, an increase in the electron-mediated photon-phonon coupling function [52, 54]. From the inset of Fig. 4(d) it can be seen that increases as the temperature is lowered and reaches the highest values around , when the spin fluctuations are the strongest. Spin fluctuations increase the electron-phonon scattering, similar as does the disorder. Technically, the electronic Green function acquires an imaginary component of the self energy due to the spin fluctuations, and this implies the increase in the damping term in the phonon self-energy, as explained in, e.g. Ref. [45]. This leads us to conclude that the spin fluctuations strongly enhance the electron-phonon interaction for the B1g vibrational mode affecting its frequency and linewidth near .
5 Conclusion
In summary, the Raman scattering study of the KxCo2-ySe2 single crystals and lattice dynamics calculations of the KCo2Se2, have been presented. Two out of four Raman active phonons are experimentally observed and assigned. The lack of any additional modes indicates the absence of vacancy ordering. The Raman spectra show sudden changes in the phonon energy and linewidth near the FM-PM phase transition. Above the energy and linewidth temperature dependence of the A1g and B1g modes look conventional, as expected from the thermal expansion and anharmonicity effects. The linewidth, though, has very weak temperature dependence even above which may the consequence of the proximity of the phase transition and spin fluctuations. The B1g vibrational mode has particularly large linewidth and features a Fano profile, which is likely the consequence of the magnetic exchange coupled to the vibrations of the Co atoms. Interestingly, the A1g mode linewidth decreases below , whereas the linewidth of the B1g mode increases. The DFT calculations generally agree with the measured phonon frequencies. However, fine frequency differences in the two phases cannot be correctly predicted since the DFT calculations do not account for the spin fluctuation effects.
References
- [1] G. R. Stewart. Rev. Mod. Phys., 83:1589–1652, Dec 2011.
- [2] Bao Wei, Huang Qing-Zhen, Chen Gen-Fu, M. A. Green, Wang Du-Ming, He Jun-Bao, and Qiu Yi-Ming. Chinese Physics Letters, 28(8):086104, 2011.
- [3] R. H. Liu, X. G. Luo, M. Zhang, A. F. Wang, J. J. Ying, X. F. Wang, Y. J. Yan, Z. J. Xiang, P. Cheng, G. J. Ye, Z. Y. Li, and X. H. Chen. EPL (Europhysics Letters), 94(2):27008, 2011.
- [4] Long Ma, G. F. Ji, Jia Dai, X. R. Lu, M. J. Eom, J. S. Kim, B. Normand, and Weiqiang Yu. Phys. Rev. Lett., 109:197002, Nov 2012.
- [5] Elbio Dagotto. Rev. Mod. Phys., 85:849–867, May 2013.
- [6] Y. Zhang, M.and Ye Z. R. Yang, L. X.and Xu, F. Chen, C. He, H. C. Xu, J. Jiang, J. J. Xie, B. P.and Ying, X. F. Wang, X. H. Chen, J. P. Hu, M. Matsunami, S. Kimura, and D. L. Feng. Nature Materials, 10:273–277, 2011.
- [7] Wei Li, Hao Ding, Peng Deng, Kai Chang, Canli Song, Ke He, Lili Wang, Xucun Ma, Jiang-Ping Hu, Xi Chen, and Qi-Kun Xue. Nat. Phys., 8:126–130, Feb 2012.
- [8] N. Lazarević, M. Abeykoon, P. W. Stephens, Hechang Lei, E. S. Bozin, C. Petrovic, and Z. V. Popović. Phys. Rev. B, 86:054503, Aug 2012.
- [9] Xiaxin Ding, Delong Fang, Zhenyu Wang, Huan Yang, Jianzhong Liu, Qiang Deng, Guobin Ma, Chong Meng, Yuhui Hu, and Hai-Hu Wen. Nat. Commun., 4, May 2013.
- [10] Despina Louca, Keeseong Park, Bing Li, Joerg Neuefeind, and Jiaqiang Yan. Scientific Reports, 3:2047, 2013.
- [11] Shin-Ming Huang, Chung-Yu Mou, and Ting-Kuo Lee. Phys. Rev. B, 88:174510.
- [12] Hechang Lei, Milinda Abeykoon, Kefeng Wang, Emil S Bozin, Hyejin Ryu, D Graf, J B Warren, and C Petrovic. Journal of Physics: Condensed Matter, 26(1):015701, 2014.
- [13] N. Lazarević, M. Radonjić, M. Šćepanović, Hechang Lei, D. Tanasković, C. Petrovic, and Z. V. Popović. Phys. Rev. B, 87:144305, Apr 2013.
- [14] Hyejin Ryu, Kefeng Wang, M. Opacic, N. Lazarevic, J. B. Warren, Z. V. Popovic, Emil S. Bozin, and C. Petrovic. Phys. Rev. B, 92:174522, Nov 2015.
- [15] Hyejin Ryu, Milinda Abeykoon, Kefeng Wang, Hechang Lei, N. Lazarevic, J. B. Warren, E. S. Bozin, Z. V. Popovic, and C. Petrovic. Phys. Rev. B, 91:184503, May 2015.
- [16] Jinhu Yang, Bin Chen, Hangdong Wang, Qianhui Mao, Masaki Imai, Kazuyoshi Yoshimura, and Minghu Fang. Phys. Rev. B, 88:064406, Aug 2013.
- [17] Y. J. Um, A. Subedi, P. Toulemonde, A. Y. Ganin, L. Boeri, M. Rahlenbeck, Y. Liu, C. T. Lin, S. J. E. Carlsson, A. Sulpice, M. J. Rosseinsky, B. Keimer, and M. Le Tacon. Phys. Rev. B, 85:064519, Feb 2012.
- [18] Z. V. Popović, N. Lazarević, S. Bogdanović, M.M. Radonjić, D. Tanasković, Rongwei Hu, Hechang Lei, and C. Petrovic. Solid State Communications, 193:51 – 55, 2014.
- [19] H.-M. Eiter, P. Jaschke, R. Hackl, A. Bauer, M. Gangl, and C. Pfleiderer. Phys. Rev. B, 90:024411, Jul 2014.
- [20] D. Kirillov, Y. Suzuki, L. Antognazza, K. Char, I. Bozovic, and T. H. Geballe. Phys. Rev. B, 51:12825–12828, May 1995.
- [21] W.-L. Zhang, H. Li, Dai Xia, H. W. Liu, Y.-G. Shi, J. L. Luo, Jiangping Hu, P. Richard, and H. Ding. Phys. Rev. B, 92:060502, Aug 2015.
- [22] S. Baroni, S. de Gironcoli, A. Dal Corso, and P. Giannozzi. Rev. Mod. Phys., 73:515–562, Jul 2001.
- [23] Paolo Gianozzi, Stefano Baroni, Nicola Bonini, Mateo Calandra, Roberto Car, Carlo Cavazzoni, Davide Ceresoli, Guido L Chiarotti, Matteo Cococcioni, Ismaila Dabo, Andrea Dal Corso, Stefano de Gironcoli, Stefano Fabris, Guido Fratesi, Ralph Gebauer, Uwe Gerstmann, Christos Gougoussis, Anton Kokalj, Michele Lazzeri, Layla Martin-Samos, Nicola Marzari, Francesco Mauri, Riccardo Mazzarello, Stefano Paolini, Alfredo Pasquarello, Lorenzo Paulatto, Carlo Sbraccia, Sandro Scandolo, Gabriele Sclauzero, Ari P Seitsonen, Alexander Smogunov, Paolo Umari, and Renata M Wentzcovitch. Journal of Physics: Condensed Matter, 21(39):395502, 2009.
- [24] Guohe Huan and Martha Greenblatt. Journal of the Less Common Metals, 156(1???2):247 – 257, 1989.
- [25] Jiangang Guo, Shifeng Jin, Gang Wang, Shunchong Wang, Kaixing Zhu, Tingting Zhou, Meng He, and Xiaolong Chen. Phys. Rev. B, 82:180520, Nov 2010.
- [26] N. Lazarević, Hechang Lei, C. Petrovic, and Z. V. Popović. Phys. Rev. B, 84:214305, Dec 2011.
- [27] Urszula D Wdowik, Grzegorz Jaglo, and Przemyslaw Piekarz. Journal of Physics: Condensed Matter, 27(41):415403, 2015.
- [28] There is typo in Table I of Ref. [27] in the frequency of the B1g mode.
- [29] M. Opačić, N. Lazarević, M. Šćepanović, H. Ryu, H. Lei, C. Petrovic, and Z. V. Popović. Evidence of superconductivity-induced phonon spectra renormalization in alkali-doped iron selenides. Journal of Physics: Condensed Matter, 27(48), 2015.
- [30] E. Granado, A. García, J. A. Sanjurjo, C. Rettori, I. Torriani, F. Prado, R. D. Sánchez, A. Caneiro, and S. B. Oseroff. Phys. Rev. B, 60:11879–11882, Nov 1999.
- [31] Rajeev Gupta, A. K. Sood, P. Metcalf, and J. M. Honig. Phys. Rev. B, 65:104430, Feb 2002.
- [32] José Menéndez and Manuel Cardona. Phys. Rev. B, 29:2051–2059, Feb 1984.
- [33] E. Haro, M. Balkanski, R. F. Wallis, and K. H. Wanser. Phys. Rev. B, 34:5358–5367, Oct 1986.
- [34] M. Rahlenbeck, G. L. Sun, D. L. Sun, C. T. Lin, B. Keimer, and C. Ulrich. Phys. Rev. B, 80:064509, Aug 2009.
- [35] Vladimir Gnezdilov, Yurii G. Pashkevich, Peter Lemmens, Dirk Wulferding, Tatiana Shevtsova, Alexander Gusev, Dmitry Chareev, and Alexander Vasiliev. Phys. Rev. B, 87:144508, Apr 2013.
- [36] A. E. Böhmer, F. Hardy, F. Eilers, D. Ernst, P. Adelmann, P. Schweiss, T. Wolf, and C. Meingast. Phys. Rev. B, 87:180505, May 2013.
- [37] Ankit Kumar, Sujeet Chaudhary, Dinesh K. Pandya, and Shiv K. Sharma. Phys. Rev. B, 90:024302, Jul 2014.
- [38] M. N. Iliev, M. V. Abrashev, A. P. Litvinchuk, V. G. Hadjiev, H. Guo, and A. Gupta. Phys. Rev. B, 75:104118, Mar 2007.
- [39] J. Laverdière, S. Jandl, A. A. Mukhin, V. Yu. Ivanov, V. G. Ivanov, and M. N. Iliev. Phys. Rev. B, 73:214301, Jun 2006.
- [40] Dhirendra Kumar, Satish Kumar, and Vasant G. Sathe. Solid State Communications, 194:59 – 64, 2014.
- [41] Z. P. Yin, K. Haule, and G. Kotliar. Nature Materials, 10:932–935, 2011.
- [42] Z. P. Yin, A. Kutepov, and G. Kotliar. Phys. Rev. X, 3:021011, May 2013.
- [43] K. Haule, J. H. Shim, and G. Kotliar. Phys. Rev. Lett., 100:226402, Jun 2008.
- [44] Philip B. Allen. Phys. Rev. B, 6:2577–2579, Oct 1972.
- [45] E. Cappelluti. Phys. Rev. B, 73:140505, Apr 2006.
- [46] Matteo Calandra and Francesco Mauri. Phys. Rev. B, 71:064501, Feb 2005.
- [47] V. L. Aksenov and V. V. Kabanov. Phys. Rev. B, 57:608–612, Jan 1998.
- [48] V.V. Bannikov, I.R. Shein, and A.L. Ivanovskii. Physica B: Condensed Matter, 407(2):271 – 275, 2012.
- [49] T. Ruf, C. Thomsen, R. Liu, and M. Cardona. Phys. Rev. B, 38:11985–11987, Dec 1988.
- [50] R.M. Macfarlane, Hal Rosen, and H. Seki. Solid State Communications, 63(9):831 – 834, 1987.
- [51] S. Barišić, I. Kupčić, and I. Batistić. International Journal of Modern Physics B, 03(12):2051–2063, 1989.
- [52] T. P. Devereaux, A. Virosztek, and A. Zawadowski. Charge-transfer fluctuation, d -wave superconductivity, and the raman phonon in cuprates. Phys. Rev. B, 51:505–514, Jan 1995.
- [53] Ivan Kupčić and Slaven Barišić. Electronic raman scattering in a multiband model for cuprate superconductors. Phys. Rev. B, 75:094508, Mar 2007.
- [54] N. A. García-Martínez, B. Valenzuela, S. Ciuchi, E. Cappelluti, M. J. Calderón, and E. Bascones. Coupling of the as phonon to magnetism in iron pnictides. Phys. Rev. B, 88:165106, Oct 2013.
- [55] M. N. Iliev, S. Jandl, V. N. Popov, A. P. Litvinchuk, J. Cmaidalka, R. L. Meng, and J. Meen. Phys. Rev. B, 71:214305, Jun 2005.
- [56] N. Lazarević, Z. V. Popović, Rongwei Hu, and C. Petrovic. Phys. Rev. B, 81:144302, Apr 2010.