J1216+0709 : A radio galaxy with three episodes of AGN jet activity
Abstract
We report the discovery of a ‘Triple-Double Radio Galaxy (TDRG)’ J1216+0709 detected in deep low-frequency Giant Metrewave Radio Telescope (GMRT) observations. J1216+0709 is only the third radio galaxy, after B0925+420 and Speca, with three pairs of lobes resulting from three different episodes of AGN jet activity. The 610 MHz GMRT image clearly displays an inner pair of lobes, a nearly co-axial middle pair of lobes and a pair of outer lobes that is bent w.r.t. the axis of inner pair of lobes. The total end-to-end projected sizes of the inner, middle, and outer lobes are 40′′ ( 95 kpc), 1′.65 ( 235 kpc) and 5′.7 ( 814 kpc), respectively. Unlike the outer pair of lobes both the inner and middle pairs of lobes exhibit asymmetries in arm-lengths and flux densities, but in opposite sense, the eastern sides are farther and also brighter that the western sides, thus suggesting the possibility of jet being intrinsically asymmetric rather than due to relativistic beaming effect. The host galaxy is a bright elliptical (mr 16.56) with MSMBH 3.9 109 M and star-formation rate of 4.66 M⊙ yr-1. The host galaxy resides is a small group of three galaxies (mr 17.77) and is possibly going through the interaction with faint, dwarf galaxies in the neighbourhood, which may have triggered the recent episodes of AGN activity.
=1
1 Introduction
Radio galaxies, a subclass of Active Galactic Nuclei (AGN), are powerful radio emitters and typically exhibit radio morphology that
consists of a core producing a pair of bipolar collimated jets terminating in the form of lobes.
Therefore, detection of ‘core-jet-lobe’ radio morphology is a clear indication of AGN activity.
In fact, radio morphological structure and spectral properties can be used to probe the history of AGN activity.
Morphological studies of radio galaxies have been useful in understanding the precession or change of jet axis in
X-shaped radio galaxies, effect of the motion of host galaxies in bent radio galaxies, and intermittent AGN activity in radio
galaxies showing two pairs of lobes (Dehghan et al., 2014; Roberts et al., 2015).
In recent years, there have been attempts to understand the details of recurrent AGN activity in galaxies
by studying radio galaxies exhibiting two pairs of lobes that are formed during two different phases of AGN activity
( Jamrozy et al., 2009; Konar et al., 2013).
These galaxies are generally termed as ‘Double-Double Radio Galaxies (DDRGs)’ in which a new pair of radio lobes is seen closer
to nucleus, before distant and old pair of radio lobes fades away (Saikia & Jamrozy, 2009).
The new pair of lobes are edge brightened, and therefore, it can easily be distinguished from knots in the jets.
Interestingly, despite the identification of thousands of radio galaxies in various radio surveys only few dozens
are confirmed DDRGs (Nandi & Saikia, 2012), possibly due to lack of sensitivity and resolution
such that radio structures at different spatial scales remain undetected.
Low-frequency sensitive GMRT observations with the resolution of few arcsecond are well suited to detect both steep spectrum,
low-surface-brightness radio emission from the old pair of lobes as well as kpc-scale emission from the new pair of lobes.
In this paper we report the discovery of rare ‘Triple-Double Radio Galaxy (TDRG)’ named as J1216+0709 that displays three pairs of lobes in the 610 MHz GMRT image.
This is only the third TDRG reported so far after B0925+420 (Brocksopp et al., 2007) and Speca (Hota et al., 2011).
This radio galaxy is either undetected or poorly detected in previous radio surveys (Faint Images of the Radio Sky at Twenty-cm (FIRST; Becker et al., 1995),
NRAO VLA Sky Survey (NVSS; Condon et al., 1998), VLA Low-frequency Sky Survey (VLSS; Cohen et al., 2007), and TIFR-GMRT Sky Survey
(TGSS; Intema et al., 2016) due to the lack of optimum sensitivity and resolution.
The host galaxy has been identified in the Sloan Digital Sky Survey (SDSS; Ahn et al., 2014) as an early type galaxy at
RA (J2000) = 12h 16m 32s.42 and DEC (J2000) = +07∘ 09 55.8
with a spectroscopically measured redshift (z) = 0.136.
The cosmological parameters that we adopt are H0 = 71 km s-1 Mpc-1, = 0.27
and = 0.73. Using this cosmology, 1 arcsec corresponds to 2.381 kpc at the luminosity distance of 633.8 Mpc for J1216+0709.
2 GMRT observations and data reduction
The Radio galaxy J1216+0709 was observed with the GMRT at 610 MHz on 20 June 2012 and at 325 MHz on 23 April 2016.
During our GMRT observations, we used the full array of 30 antennas and the software backend with receiver
bandwidth of 32 MHz subdivided into 256 channels.
During the 610 MHz observations the target field centered at NGC 4235 (RA (J2000) = 12h 17m 09s.9 and DEC = +07∘ 11 30)
was observed for nearly four hours.
While, in 325 MHz observations the field was centered on the target source J1216+0709 and was observed for nearly 3.5 hours.
The amplitude calibrators were observed for 20 minutes
at the start and/or end of each run, and the phase calibrators were observed for 5 minutes in every 40 minutes.
GMRT data were reduced and analysed in the standard way using the NRAO Astronomical Image Processing System (AIPS).
Calibrated visibilities were Fourier transformed to create radio images by using the ‘IMAGR’ task,
and robust weighing scheme, where robust parameter was set to ‘0’ (between uniform and natural weighing) at both frequencies.
All the images were self-calibrated and primary beam corrected.
Our final maps have noise-rms 40 Jy beam-1 with synthesized beam-size 6.2 4.5 at 610 MHz,
and 160 Jy beam-1 with synthesized beam-size 11.4 8.5 at 325 MHz.
More details on the data reduction are presented in Kharb et al. (2016).
The total flux densities of different components were measured using the AIPS task ‘TVSTAT’ that allows us to choose an area of any shape.
Error on the flux density of a component was obtained by multiplying the average noise-rms to the total area of the component measured in
the units of synthesized beams. Flux density of an individual component was obtained by considering the area shown by contours overlaid on to grey-scale image.
3 Radio properties
3.1 Radio Morphology
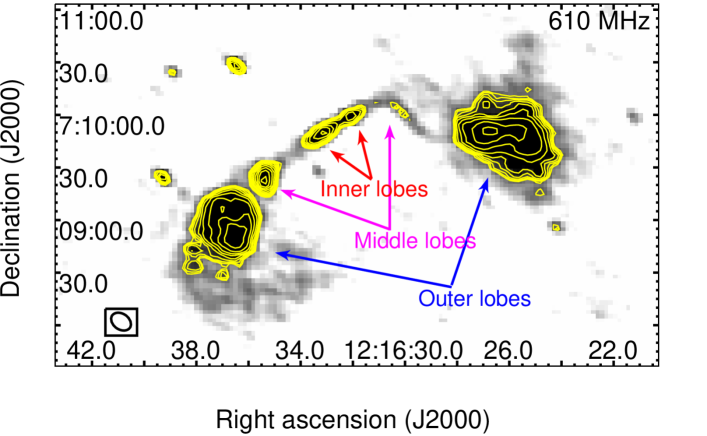
J1216+0709 is best imaged at 610 MHz in GMRT observations, while it is either undetected or poorly detected in existing radio surveys. The 610 MHz GMRT image displays an inner pair of lobes, a nearly co-axial middle pair of lobes and a pair of outer lobes that are bent w.r.t. the inner pair of lobes (see figure 1). The overall radio morphology of the source appears bent in a ‘C’ shaped like structure and resembles somewhat to a Wide Angle Tail (WAT) radio galaxy. The total end-to-end projected sizes of the inner lobes, middle lobes and outer lobes are 40 ( 95 kpc), 1.65 ( 235.7 kpc) and 5.7 ( 814 kpc), respectively (see figure 1). The three distinct pairs of lobes can be interpreted as evidence for the three different episodes of AGN jet activity. The inner and middle pair of lobes show clear edge-brightened structures which distinguish them from knots in the jets. In the 610 MHz image, there is relatively faint bridge-like radio emission connecting the two successive lobes, which tentatively indicates that the newly formed jets propagate outwards possibly through the jet-cocoon structure formed by the previous episode of activity rather than through intergalactic medium.
Radio flux densities of different components at different frequencies are given in Table 1.
Based on the 610 MHz image, Table 2 lists total radio sizes, ratios of flux densities and arm-lengths of
the eastern and western side lobes and the luminosities of the three pairs of lobes.
We note that for outer pair of lobes, both eastern and western lobes have similar flux densities and distance from the center (arm-lengths),
which suggests that the outer pair of lobes is lying nearly in the plane of sky.
For both the inner and middle pairs of lobes, the eastern side is nearly 2.3 - 2.5 times stronger than the western side
ratios of flux densities of eastern-to-western lobe for inner and middle pairs are (R) 2.3 and
(R) 2.5, respectively (see table 2).
While arm-lengths of the eastern sides are larger in comparison to the western sides
the ratios of eastern to western sides are (R) 2.0 to (R) 1.6, for the inner and middle pair, respectively.
We note that the asymmetry shown by inner and middle doubles in our source is consistent with the general trend found in DDRGs in which
the inner doubles tend to be more asymmetric in both its arm-length and its flux density ratios compared to the outer doubles (see Saikia et al., 2006).
It is worth to note that for both inner and middle doubles the asymmetries in arm-lengths and flux densities are in opposite sense
the eastern lobes being farther and also brighter that the western lobes.
The opposite asymmetry is difficult to explain by simple version of relativistic beaming effect.
Also, in radio galaxies the viewing angle is relatively large ( 45∘; Urry et al. (1995)), and therefore,
relativistic beaming effect is unlikely to be dominant.
This strengthens the possibility of jet being intrinsically asymmetric.
Indeed, asymmetric jet have been suggested for some of DDRGs reported in the literature (see Jamrozy et al., 2009).
In our TDRG the outer pair of lobes are bent w.r.t. the axis of the inner pair of lobes and this can be understood if the
outer lobes are entraining into a medium having large-scale density gradients or host galaxy has moved during the two cycles of AGN activity (Kantharia et al., 2009).
The 610 MHz radio luminosity of the inner, middle and outer pair of lobes are 3.5 1023 W Hz-1, 5.4 1023 W Hz-1 and
4.8 1024 W Hz-1, respectively (see table 2).
The higher luminosity of the outer pair of lobes in comparison to the inner pair of lobes
is consistent with other cases of TDRGs and DDRGs (see Schoenmakers et al., 2000).
The total 610 MHz radio luminosity (5.8 1024 W Hz-1) of our TDRG
(with r-band absolute magnitude (MR) -20.690.03 (Simard et al., 2011)) is close to the separation line between FR I and FR II
types (Fanaroff & Riley, 1974). Interestingly, the western outer lobe with edge-brightening is similar to FR II, while eastern one bears resemblance to a FR I type.
We note that there is no clear detection of the AGN core in both the 610 MHz and 325 MHz images.
While core is marginally detected in FIRST image at 2 level ( 0.45 mJy).
Since our 610 MHz images have typical noise-rms of 0.04 mJy and this gives an upper limit of core flux density of 0.12 mJy at 3 level.
Therefore, AGN radio core exhibits inverted spectral index between 610 MHz to 1.4 GHz (see table 1).
The compact inverted-spectrum AGN core is similar to Giga-Hertz Peaked-spectrum Sources (GPSs) that exhibit
peak in their radio Spectra between 1 GHz to 5 GHz and an inverted-shape spectrum at lower frequencies (Fanti, 2009).
GPSs are interpreted as radio AGN in early phase of their evolution, and therefore, compact inverted-spectrum radio core of TDRG
may be considered as an indication of recent AGN activity (Randall et al., 2011; Orienti, 2016).
Indeed, some DDRGs are known to show mildly inverted spectrum of the core (Machalski et al., 2010).
3.2 Radio spectrum
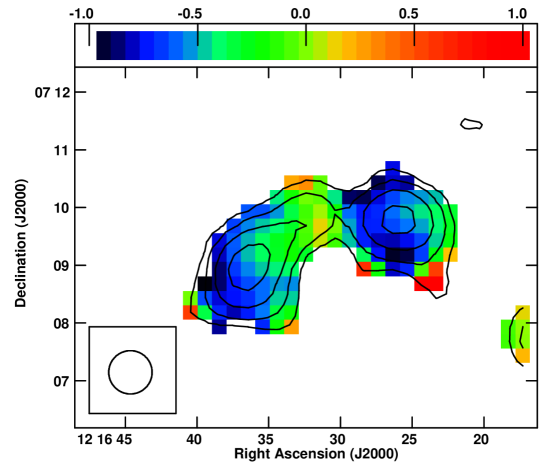
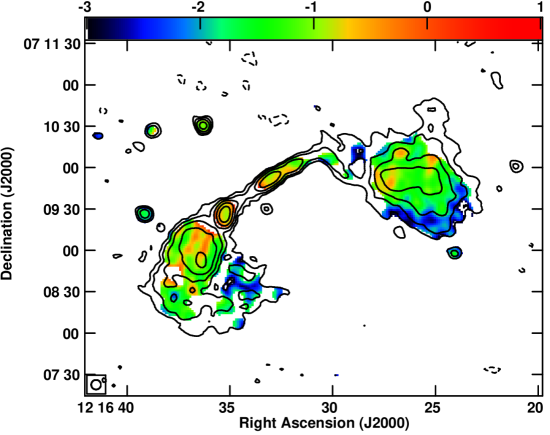
Figure 2 shows spectral index maps between 610 MHz and 1.4 GHz, and between 325 MHz and 610 MHz. We use the task ‘COMB’ in AIPS to create spectral index images after considering flux density values above 2.5 at both frequencies. The resolutions of the images at two frequencies were matched by convolving the higher resolution image with a Gaussian equivalent to the beam-size of lower resolution image. Spectral index map between 610 MHz (GMRT) and 1.4 GHz (NVSS) shows that the outer lobes have steeper spectral index ( - 1.0, where Sν ), while the inner region (covering core and inner lobes) have relatively less steep spectral index ( - 0.5). 325 MHz - 610 MHz spectral index map is of higher spatial resolution and shows all three lobes. We note that, in 325 MHz - 610 MHz spectral index map, the outer lobes have steeper spectral index ( - 1.0) in compared to the inner and middle lobes. Also, outer edges of the outer lobes have very steep spectral index ( - 2.0) which is typically seen in relic plasma. There is no signature of relatively compact hotspot-like structures with less steep spectral index, and therefore, suggesting that the supply of jet material has stopped long ago and hotspots in the outer lobes have completely faded away, if they existed.
3.3 Kinematic age estimates
It is important to estimate the time-scales of active and quiescent phase of AGN activity to understand the cause of episodic AGN activity and its duty cycle. Given the lack of multi-frequency radio data for our TDRG we can only constrain the lower limit to the active and quiescent phase time-scales by using kinematic age estimates based on projected radio sizes and a reasonable assumed value for the jet speed. We note that, in general, for a constant jet power the advancement speed of the head of lobe is higher at an early phase of evolution and it decreases (via interaction with the surrounding medium) as the source size increases (An & Baan, 2012). Based on the previous studies of young as well as evolved radio galaxies, we adopt the average speed of the advancement of the head of outer, middle and inner lobes of our source to be 0.01c, 0.05c and 0.1c, respectively, (where ‘c’ is the speed of light) (see Konar et al., 2006; Machalski et al., 2010; An et al., 2012). With these assumed speeds and the projected linear sizes of 814 kpc, 235 kpc and 95 kpc for the outer, middle and inner doubles, respectively, we obtain kinematic ages 1.3 108 years, 7.6 106 years and 1.5 106 years for the outer, middle and inner doubles, respectively. However, we caution that our estimates of kinematic ages are only order-of-magnitude approximation under the simplified assumption that the advancement speed of lobe remains constant. We also attempt to put constraint on the time-scale of quiescent phase between the two AGN episodes. The duration of quiescent phase is equivalent to the time interval between the last jet material being injected in to the outer lobes and the first jet material being ejected from AGN in the next episode. The time elapsed since the last injection of relativistic particle in the jet can be estimated by synchrotron ageing method, which requires modelling of radio spectrum to obtain break frequency that is related to the age of synchrotron emitting plasma. Due to the lack of multi-frequency radio data necessary for spectral modelling we can only put a lower limit to the quiescent phase time-scale (tq) by subtracting the kinematic ages of outer (tout-lobe) and inner doubles (tin-lobe) tq tout-lobe - tin-lobe. Therefore, the quiescent phase time-scales between outer (first episode) and middle (second episode) doubles, and the middle (second episode) and inner (third episode) are, 1.2 108 years and 6.1 106 years, respectively. These limits on the quiescent phase time-scales are consistent with the time-scale estimates in DDRGs (see Konar et al., 2013). Our proposed multi-frequency GMRT and VLA observations will allow us to put much stronger constraints on the time-scales via spectral aging measurements.
| S | S | S | |||
|---|---|---|---|---|---|
| (mJy) | (mJy) | (mJy) | |||
| Inner lobe (E) | 8.20.8 | 5.20.5 | -0.720.06 | ||
| Inner lobe (W) | 3.80.6 | 2.30.4 | -0.800.10 | ||
| Middle lobe (E) | 11.91.2 | 8.40.6 | -0.550.05 | ||
| Middle lobe (W) | 5.41.5 | 3.71.8 | -0.600.24 | ||
| Outer lobe (E) | 7511.5 | 47.913.8 | 20.01.4 | -0.710.14 | -1.050.13 |
| Outer lobe (W) | 10012 | 55.819.6 | 21.31.5 | -0.920.16 | -1.160.16 |
| Total | 20732 | 12514.6 | 51.52.4 | -0.800.08 | -1.070.05 |
| Core | 0.480.16 | 0.120.04 | 0.450.2 | +1.590.24 |
Note - Outer lobe flux densities at 1.4 GHz are only crude estimates based on the area covered by outer lobe seen in the 610 MHz image. There is no clear detection of AGN core in 325 MHz and 610 MHz image and hence we put 3 lower limit at these frequencies.
| lin | lmid | lout | R | R | R | R | R | R | P | P | P | P |
| (kpc) | (kpc) | (kpc) | (W Hz-1) | (W Hz-1) | (W Hz-1) | (W Hz-1) | ||||||
| 95 | 235 | 814 | 2.0 | 1.6 | 1.0 | 2.28 | 2.5 | 0.85 | 3.5 1023 | 5.4 1023 | 4.8 1024 | 5.8 1024 |
Note - lin, lmid and lout represent total end-to-end linear sizes of inner, middle and outer pairs of lobes, respectively. R, R and R are ratios of the linear sizes of eastern to western sides of the inner, middle and outer pairs of lobes, respectively. R, R and R are 610 MHz flux density ratios of eastern to western lobes for the inner, middle and outer pairs of lobes, respectively. P, P and P are 610 MHz luminosity of inner, middle and outer pair of lobes, respectively. The radio luminosities are k-corrected by assuming that the radio emission is synchrotron emission characterized by a power law (S ), where we use the spectral index value measured between 325 MHz and 610 MHz. The radio luminosity of the source at redshift z and luminosity-distance dL is, therefore, given by P = 4d S (1 + z)-(α+1).
4 Host galaxy and its large-scale environment
Host galaxy and its surrounding large-scale environment can play crucial role in triggering episodic AGN activity, therefore,
we examine the nature of host galaxy and its environment.
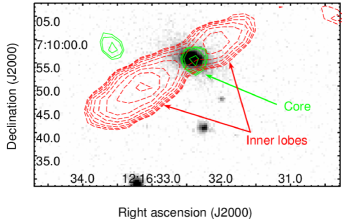
Radio contours overlaid on the SDSS optical image identify the host galaxy as an elliptical galaxy at the redshift of 0.136
(see figure 1).
Host galaxy is fairly bright (r-band magnitude 16.56) and redder in colour (u - r = 2.89).
The SDSS optical spectrum is dominated by a red continuum with noticeable 4000 Å break, a characteristic of early-type galaxies.
The optical emission line flux ratio diagnostic classifies the host galaxy as a Low Excitation Radio Galaxy (LERG).
The Wide-field Infrared Survey Explorer (WISE; Wright et al., 2010) colors of the host galaxy ([3.4] - [4.6] = 0.12 0.8 in Vega magnitudes) indicate that the mid-IR emission is dominated by star formation
and AGN contamination is not significant (see Stern et al., 2012).
We estimate star formation rate (SFR) of 4.66 M⊙ yr-1 in the host galaxy using Kennicutt (1998) empirical relation
(SFR (M⊙ yr-1) = 4.5 10-44 L (erg s-1)) based on IR luminosity.
The total IR (8 - 1000 m) luminosity is estimated from the WISE 22 m luminosity using the full range of templates in the
libraries of Chary & Elbaz (2001) and Dale & Helou (2002).
For our TDRG we estimate the mass of the super-massive black hole (MSMBH) to be 3.87 109 M
by using the ‘black hole mass -bulge luminosity’ relation for early type galaxies given in McConnell & Ma (2013).
The absolute bulge magnitude of our source is taken from Simard et al. (2011) who present bulgedisc decomposition for SDSS DR7 galaxies.
To examine if our TDRG is associated with any cluster or group we use the catalogue of Tempel et al. (2014)
who identified galaxy groups and clusters based on a modified friends-of-friends method and
present a flux (mr 17.77) and volume-limited catalogue using SDSS DR 10 data.
The value of flux limit is based on the fact that the SDSS data are incomplete for fainter sources (Strauss et al., 2010).
According to Tempel et al. (2014) catalog, the host galaxy is part of a small group of three galaxies
(other two galaxies located at RA (J2000) = 12h 16m 39s, DEC (J2000) = +07∘ 10 25,
and RA (J2000) = 12h 16m 30s, DEC (J2000) = +07∘ 06 14) with a total estimated mass
of 1.99 1013 M and virial radius of 0.28 Mpc.
There is no apparent disturbance in the host galaxy morphology, and thus, we can rule out any recent major merger.
However, a minor merger or a strong interaction with a dwarf galaxy is plausible without resulting any prominent disturbance.
In the SDSS image, two faint, blue-color, dwarf galaxy like objects
(one at RA (J2000) = 12h 16m 31s.97, DEC (J2000) = +07∘ 09 47.28 with mr 23.310.27 but without any estimate of redshift due to faintness,
and second one at RA (J2000) = 12h 16m 32s.25, DEC (J2000) = +07∘ 09 40.92 with mr 19.670.02 and zphot 0.1180.0402) are seen close
to the southern side of the TDRG host galaxy.
The apparent fuzziness and blue color may be an indication of strong interaction that might have triggered a recent star-formation.
So, it is possible that both these dwarf galaxies are interacting with TDRG host galaxy which can bring sufficient matter close to the SMBH to trigger AGN activity.
However, more sensitive optical observations are required to obtain spectroscopic redshifts of these dwarf galaxies, and to confirm this possibility.
5 Summary
We report the discovery of a rare ‘Triple-Double Radio Galaxy (TDRG)’ J1216+0709 that exhibits three distinct pairs of lobes in the 610 MHz GMRT image. This TDRG is only the third such source reported after B0925+420, and Speca, where three pairs of lobes are result of three different episodes of AGN jet activity. The 610 MHz GMRT image exhibits an inner pair of lobes, a nearly co-axial middle pair of lobes and a pair of outer lobes that are bent w.r.t. the inner pair of lobes. The total end-to-end projected sizes of the inner double, middle double and outer double are 40 ( 95 kpc), 1.65 ( 235.7 kpc) and 5.7 ( 814 kpc), respectively. We note that unlike the outer pair of lobes both the inner and middle doubles exhibit asymmetries in arm-lengths and flux densities but in opposite sense eastern sides are farther and also brighter that the western sides. The opposite asymmetry is difficult to explain by a simple version of relativistic beaming effect and suggests the possibility of jet being intrinsically asymmetric. Also, all three pairs of lobes bear edge-brightened resemblance with FR II type radio galaxies, while their total radio luminosities are lower than that for classical FR II radio galaxies. Spectral index map between 325 MHz and 610 MHz shows that the outer lobes exhibit steeper spectral index ( -1) in compared to the middle and inner lobes. The lack of hotspots and very steep spectral index in the outer edges of outer lobes indicate the presence of relic plasma.
Kinematic age estimates based on assumed advancement speed of the head of the lobes to be 0.01c, 0.05c and 0.1c, for the outer, middle and inner doubles, respectively, are 1.3 108 years, 7.6 106 years, and 1.5 106 years for the outer, middle and inner pair of lobes, respectively. The kinematic age estimates allow us to put a lower limit on the quiescent phase time-scales between outer (first episode) and middle (second episode) doubles, and the middle (second episode) and inner (third episode) doubles to be 1.2 108 years and 6.1 106 years, respectively. The host galaxy is found to be a bright elliptical (r-band magnitude 16.56) for which the optical spectrum is dominated by a red continuum and emission line ratios suggest AGN emission to be of low excitation. The host galaxy contains SMBH with the mass of 3.87 109 and exhibit SFR 4.66 M⊙ yr-1. Also, host galaxy belongs to only a small group of three galaxies with the total estimated mass of the group to be 1.99 1013 M and virial radius of 0.28 Mpc. There is no apparent disturbance in the morphology of host galaxy, however, it may be interacting with two nearby dwarf galaxies. So, the AGN activity might have been triggered by the interaction with neighboring dwarf galaxies. Although, more sensitive optical data are required to confirm this plausibility.
References
- Ahn et al. (2014) Ahn, C. P. , Alexandro, R. , Allende Prieto, C. , et al. 2014, ApJS, 211, 17
- An & Baan (2012) An, T. , & Baan, W. A. 2012, ApJ, 760, 77
- An et al. (2012) An, T. , Wu, F. , Yang, J. , et al. 2012, ApJS, 198, 5
- Becker et al. (1995) Becker, R. H. , White R. L. , Helfand D. J. 1995, ApJ, 450, 559
- Brocksopp et al. (2007) Brocksopp, C. , Kaiser, C. R. , Schoenmakers, A. P., et al. 2007, MNRAS, 382, 1019
- Chary & Elbaz (2001) Chary, R. , & Elbaz, D. 2001, ApJ, 556, 562
- Clarke & Burns (1991) Clarke, D. A. , & Burns, J. O. 1991, ApJ, 369, 308
- Condon et al. (1998) Condon, J. J. , Cotton, W. D. , Greisen, E. W. , et al. 1998, AJ, 115, 1693
- Cohen et al. (2007) Cohen, A. S. ,Lane, W. M. , Cotton, W. D. , et al. 2007, AJ, 134, 1245
- Dale & Helou (2002) Dale, D. A. , & Helou, G. 2002, ApJ, 576, 159
- Dehghan et al. (2014) Dehghan, S. , Johnston-Hollitt, M. , Franzen, T. M. O., et al. 2014, AJ, 148, 75
- Fanaroff & Riley (1974) Fanaroff, B. L. , & Riley, J. M. 1974, MNRAS, 167, 31
- Fanti (2009) Fanti, C. 2009, Astron. Nachr. , 330, 120
- Hota et al. (2011) Hota, A. , Sirothia, S. K. , Ohyama, Y., et al. 2011, MNRAS, 417, L36
- Intema et al. (2016) Intema, H. T. , Jagannathan, P. , Mooley, K. P. , et al. 2016, arXiv , 1603.04368
- Jamrozy et al. (2009) Jamrozy, M. , Saikia, D. J. , & Konar, C. 2009, MNRAS, 399, L141
- Joshi et al. (2011) Joshi, S. A. , Nandi, S. , Saikia, D. J. , et al. 2011, MNRAS, 414, 1397
- Kantharia et al. (2009) Kantharia, N. G. , Das, M. , & Gopal-Krishna 2009, J. Astrophys. Astron , 30, 37
- Kennicutt (1998) Kennicutt, Jr. , R. C. 1998, ARA&A, 36, 189
- Kharb et al. (2016) Kharb, P. , Srivastava, S. , Singh, V. , et al. 2016, MNRAS, 459, 1310
- Komissarov & Gubanov (1994) Komissarov, S. S. , & Gubanov, A. G. 1994, A&A , 285
- Konar et al. (2013) Konar, C. , Hardcastle, M. J. , Jamrozy, M., et al. 2013, MNRAS, 430, 2137
- Konar et al. (2012) Konar, C. , Hardcastle, M. J. , Jamrozy, M., et al. 2012, MNRAS, 424, 1061
- Konar et al. (2006) Konar, C. , Saikia, D. J. , Jamrozy, M., et al. 2006, MNRAS, 372, 693
- Machalski et al. (2010) Machalski, J. , Jamrozy, M. , & Konar, C. 2010 å, 510, 84
- McConnell & Ma (2013) McConnell, N. J. , & Ma, C. -P. 2013, ApJ, 764, 184
- Murgia et al. (2011) Murgia, M. , Parma, P. , Mack, K. -H., et al. 2011, A&A , 526, A148
- Nandi & Saikia (2012) Nandi, S. , & Saikia, D. J. 2012, BASI , 40, 121
- Orienti (2016) Orienti, M. 2016, Astron. Nachr. , 337, 9
- Polatidis (2009) Polatidis, A. G. 2009, Astron. Nachr. , 330, 149
- Randall et al. (2011) Randall, K. E. , Hopkins, A. M. , Norris, R. P. , et al. 2011, MNRAS, 416, 1135
- Roberts et al. (2015) Roberts, D. H. , Cohen, J. P. , Lu, J. , et al. 2015, ApJS, 220, 7
- Saikia & Jamrozy (2009) Saikia, D. J. , & Jamrozy, M. 2009, BASI , 37
- Saikia et al. (2006) Saikia, D. J. , Konar, C. , & Kulkarni, V. K. 2006, MNRAS, 366, 1391
- Schoenmakers et al. (2000) Schoenmakers, A. P. , de Bruyn, A. G. , Rottgering, H. J. A., et al. 2000, MNRAS, 315, 371
- Simard et al. (2011) Simard, L. , Mendel, J. T. , Patton, D. R., et al. 2011, ApJS, 196, 11
- Stern et al. (2012) Stern, D. , Assef, R. J. , Benford, D. J. , et al. 2012, ApJ, 753, 30
- Strauss et al. (2010) Strauss, M. A. , Weinberg, D. H. , Lupton, R. H. , et al. 2002, AJ, 124, 1810
- Tempel et al. (2014) Tempel, E. , Tamm, A. , Gramann, M., et al. 2014, A&A , 566, A1
- Urry et al. (1995) Urry, C. M. , & Padovani, P. 1995, PASP, 107, 803
- Wright et al. (2010) Wright, E. L. , Eisenhardt, Peter R. M. , Mainzer, Amy K. , et al. 2010, AJ, 140, 1868