Measurement of neutron capture on
Abstract
136Xe is a 0 decay candidate isotope, and is used in multiple experiments searching for this hypothetical decay mode. These experiments require precise information about neutron capture for their background characterization and minimization. Thermal and resonant neutron capture on 136Xe have been measured at the Detector for Advanced Neutron Capture Experiments (DANCE) at the Los Alamos Neutron Science Center. A neutron beam ranging from thermal energy to greater than 100 keV was incident on a gas cell filled with isotopically pure 136Xe. The relative neutron capture cross sections for neutrons at thermal energies and the first resonance at 2.154 keV have been measured, yielding a new absolute measurement of b for the thermal neutron capture cross section. Additionally, the cascades for captures at both energies have been measured, and cascade models have been developed which may be used by experiments using .
I Introduction
Neutrinoless double beta decay () is a hypothetical lepton-number-violating decay mode. Observation of would be a confirmation that neutrinos are Majorana particles; i.e., there is no distinction between neutrinos and antineutrinos. Nonobservation of this process, combined with information about the absolute mass of neutrinos, may be used to demonstrate that neutrinos are Dirac particles, in which case neutrinos and anti-neutrinos have an intrinsic distinction. As the nature of the neutrino is of considerable interest for understanding the standard model, several experimental collaborations are running or developing experiments to search for .
One of the most common isotopes to use for this search is Auger et al. (2012a); Gando et al. (2013); Martín-Albo et al. (2013). This isotope is ideal in many ways, including the large value (2457.83 keV Redshaw et al. (2007)), ease of enrichment, and physical characteristics allowing for scaling to large detectors. Due to the rarity of decays, a successful search requires extremely low radioactivity in detector materials to minimize backgrounds. As a noble gas, can be highly purified, and detectors can be constructed with extremely radiopure materials. Techniques such as multiplicity discrimination Auger et al. (2012b) can be used to further reduce backgrounds due to rays from radioactive decays. One background which cannot be reduced through these techniques is the decay of . In a recent search by the EXO-200 Collaboration Albert et al. (2014), decay was estimated to be responsible for 20% of backgrounds in the signal region of interest.
A separate study by the EXO-200 Collaboration Albert et al. (2016) found that in the detector was overwhelmingly produced by interactions with neutrons produced from cosmic-ray muon interactions underground. These neutrons typically thermalize in the shielding around the xenon before capturing. It is possible to reject a significant fraction of this background by identifying the production of and implementing a veto to remove the subsequent decays (3.8 minute half-life Carlson et al. (1969)) from the dataset.
To better understand backgrounds and to facilitate the development of such a veto, we have studied the interaction using the Detector for Advanced Neutron Capture Experiments (DANCE). The relative capture cross sections for thermal neutrons and neutrons at 2.154 keV, the first resonance, were measured, as well as the energies and multiplicities of cascade ’s for thermal and resonant captures. This information may be used by EXO-200 and other collaborations to improve the sensitivity of their searches, and may also provide insight into the nuclear structure of . Additionally, this measurement can yield a new absolute cross section for thermal neutrons when combined with an external measurement of neutron capture at resonance.
II Experimental Method
II.1 DANCE
DANCE is located on Flight Path 14 at the Manuel Lujan Jr. Neutron Scattering Center at the Los Alamos Neutron Science Center. This flight path is exposed to neutrons that pass through a room-temperature water moderator. The target sample, centered within the detector, is 20.25 m downstream of the moderator. Prompt rays are measured from neutron capture using 160 BaF2 crystals arranged spherically around the target, covering a solid angle of 3.5 steradians. Each crystal is 15 cm long, has a volume of 734 cm3, and is monitored by a photomultiplier tube (PMT). BaF2 crystals have fast timing resolution, which allows for precise neutron time-of-flight measurement, and the segmentation is ideal for measurement of -cascade multiplicity. The space between the evacuated beam pipe and the inner surfaces of the crystals (at 16.5 cm radius Ullmann et al. (2014)) is filled with a shell to reduce the rate of scattered neutrons capturing on the BaF2 crystals. Further information on the detector can be found in Ref. Reifarth et al. (2004).
II.2 Data Acquisition
Neutrons were incident on a 3 cm thick sample of 99.9% pure, gaseous pressurized to an average of 26 psi. The xenon gas was contained in an aluminum cell with 2.9 cm diameter, 0.003 inch thick kapton windows allowing the neutron beam to pass through. Data were also taken with the same cell evacuated, allowing for determination of the beam and target-related backgrounds. As the beam diameter was smaller than 2 cm at the target, the full flux of neutrons was incident upon xenon.
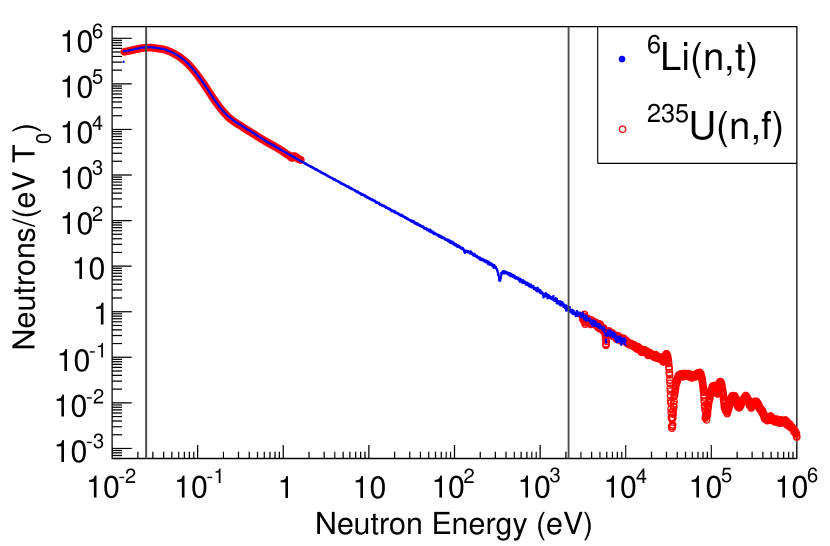
The data was collected by two digitizers each recording a 256 s long window. These time windows were set to a delay relative to the initial neutron beam trigger to select specific neutron energies based on time of flight. The first time window was set to look at the high neutron energy events, including the 2.154 keV capture resonance, while the second was delayed by 9.15 ms to look at the thermal neutron energy range of 0.0243 to 0.0256 eV. Within each of these time windows, all signals from the PMTs mounted to the crystals were recorded. The energy windows used in analysis are shown in Fig. 1.
II.3 Neutron Flux Determination
Located downstream of the sample location are three neutron monitors that are used to measure the neutron flux as a function of energy. These monitors use the reaction, the reaction, and the reaction. As the beam diameter is smaller than both the xenon target and the beam monitor, we measure the total neutron rate per beam spill as a function of time of flight (which is converted to neutron energy). The monitor has good performance at both thermal and resonant energies, so it was used for this measurement. The and monitors were used for cross-checks, and showed good agreement for the measured flux shape.
The neutron rate was determined by using a surface barrier Si detector to count interactions in a layer deposited on a thin kapton film. The number of interactions were converted to a flux measurement using knowledge of the beam and detector geometry and the known cross section Hale and Young (1991) for this interaction. The measured flux as a function of incident neutron energy is shown in Fig. 1. As only the ratio of fluxes at different energies is necessary for this analysis, uncertainties due to the absolute calibration of the neutron monitors are negligible.
III Data Analysis
III.1 Event Reconstruction
After a applying a timing calibration, all PMT signals occurring within a 20 ns window are grouped together as a single event. Only crystals with measured energy above the threshold of 250 keV are counted. We determined, based on measured event rates and Poisson statistics, that the probability for two or more neutron-induced events to overlap within a single 20 ns coincidence window is less than 1% at the capture resonance energy, and less than 0.1% at thermal neutron energies, so pile-up effects are negligible. This coincidence window is wide enough that uncertainties in relative timings for each PMT do not significantly affect efficiency.
Scintillation light in the BaF2 crystals has a fast (0.6 ns) and slow (0.6 s) component. The ratio of fast to slow scintillation light can be used to discriminate between -induced signals and those from decay or rays. This discrimination allows for a near perfect suppression of backgrounds to neutron capture signals. The decay signals were collected and used for the energy calibration of the BaF2 crystals.
The remaining events with -like fast/slow ratios were analyzed for neutron capture studies. Often, rays from neutron captures will Compton scatter and deposit energy in multiple adjacent crystals. Thus, to reconstruct the ray multiplicity and the full energy of each ray, a clustering algorithm was implemented. Adjacent crystals recording signals in a single 20 ns coincidence window are grouped together as a cluster, and it has been found that these clusters correspond well with individual rays. The reconstructed number of clusters (), individual cluster energies (), sum of all cluster energies (), and neutron energy (, measured from time of flight) are used in this analysis.
III.2 Background Subtraction
Because radioactive is a chemical homologue to barium, the crystals have some radioactive contamination. The decay chain from includes several decays, as well as some decays with ’s and ’s ( and in particular). The decays are easily rejected with the technique described in Sec. III.1, but the decays in the crystals (and from outside the detector) produce a constant-in-time (CIT) background to neutron capture. This CIT background dominates single-cluster data, and some CIT events have due to decays which are accompanied by rays, producing a multicluster event.
Another background comes from beam neutrons which may scatter off the xenon and capture on aluminum in the target vessel or beam pipe, or on barium in the crystals. Captures from scattered neutrons dominate the data for MeV.
To appropriately subtract these backgrounds, three separate datasets were used: pressurized xenon target with incident beam (pressurized xenon data), evacuated target with incident beam (evacuated target data), and no target with no neutron beam (beam-off data). The evacuated target data measure backgrounds due to scattered neutron capture (as neutrons may still scatter off the kapton windows), and beam-off data measure the CIT backgrounds. While the scattered neutron capture backgrounds seen at different times of flight scale with the number of scattered neutrons, CIT backgrounds scale only with livetime, so these must be treated separately.
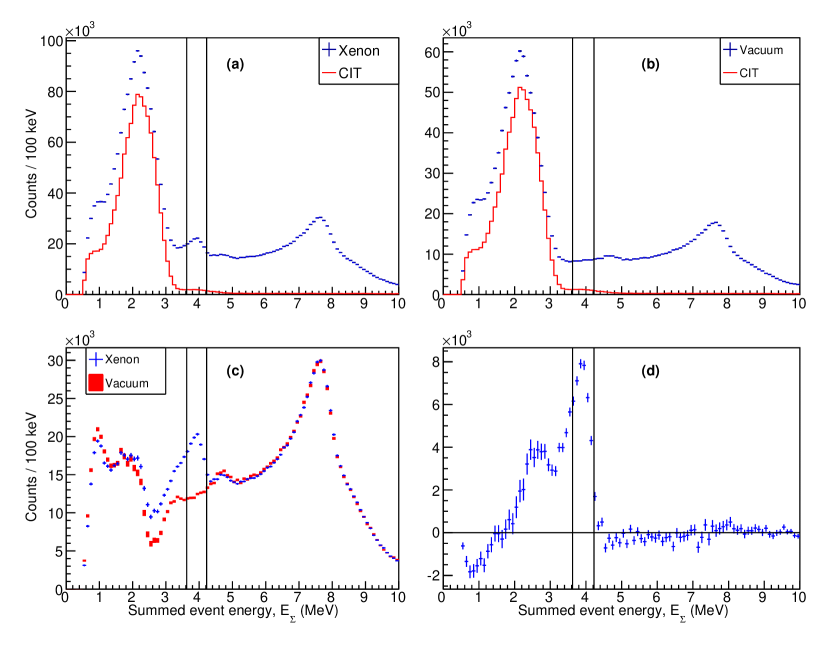
First, the CIT data were scaled to match the livetimes of both the pressurized xenon and evacuated target data, and the CIT spectra were subtracted from the pressurized xenon and evacuated target spectra at each multiplicity. Panels (a) and (b) in Fig. 2 show the CIT background scaled to the pressurized xenon and evacuated target data in the thermal neutron energy window. Only a very small fraction of the CIT background has .
Panel (c) of Fig. 2 shows the resultant spectra for the pressurized xenon and evacuated targets after the CIT background subtraction. The evacuated target spectrum was scaled to match the number of counts in the pressurized xenon spectrum in the 6 to 9 MeV range. This is well above the 4.025 MeV neutron capture value, so the events in this range are only due to scattered neutrons. In this way, CIT backgrounds and scattered neutron capture backgrounds are appropriately subtracted, as seen in panel (d) of Fig. 2, leaving a large peak at the 136Xe value and an excess at lower energies due to Xe capture events where some fraction of the cascade energy is lost. While Fig. 2 illustrates the subtraction process with spectra, the same procedure, with the same scale factors, is applied to all relevant spectra, including those of individual cluster energies.
A valley in both the signal and background is apparent between 2.2 and 3.2 MeV in panel (c) of Fig. 2. This may be due to a small energy mis-calibration with the beam-off data, or imperfect background subtraction. This valley is most apparent where the slope of the beam-off spectrum is steepest. The beam-off spectrum is small relative to capture and relatively flat in the region near the value, so any possible energy miscalibration would have a negligible effect on the analysis. The beam-on pressurized xenon and evacuated target data share the same energy calibration.
As both the CIT and scattered neutron backgrounds largely come from or emission inside a single crystal, the data for are dominated by backgrounds. Hence, this analysis largely uses only spectra. There were almost no events with . To minimize errors due to imperfect background subtraction, we further restricted the analysis to events with . This “ gate” optimizes the signal-to-background ratio and avoids most of the CIT backgrounds while still leaving good statistics. One exception, where data was used, is discussed in Sec. III.3.
One additional background source comes from rays (mainly 2.2 MeV from capture on hydrogen in the neutron moderator) that may travel down the beam pipe and pair-produce in the xenon, yielding a pair of 0.511 MeV ’s due to positron annihilation. These signals are mainly found at short time of flight, and have a total energy far below the gate. No subtraction of these beam backgrounds was necessary, as they could not affect the analysis.
III.3 Cascade Modeling
To optimize identification of the (n,) reaction in searches such as EXO-200, the cascade from the capture to the ground state of must be known as precisely as possible. We use multistep cascade (MSC) spectra to evaluate cascade models. We define MSC spectra as the spectra of at each cluster multiplicity (). We compare the MSC spectra measured with the DANCE detector to predictions derived from simulations and candidate cascade models. We use a Geant4 Allison et al. (2006); Agostinelli et al. (2003) simulation which features the DANCE geometry and detector response Jandel et al. (2007) for cascades produced with the DICEBOX code Bečvář (1998) in a way similar to that in Ref. Rusev et al. (2013). For this analysis, we added the geometry of the aluminum target and pressurized xenon into the Geant4 simulations and assumed that the captures occur uniformly in the Xe target.
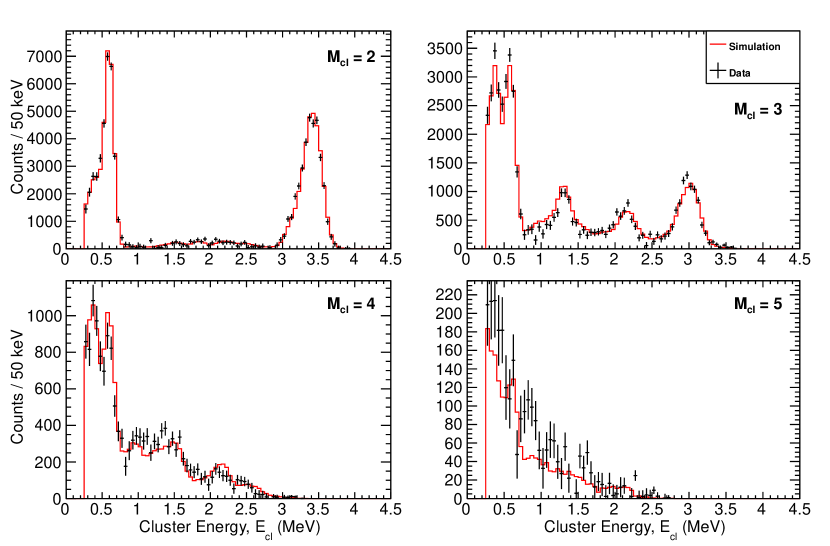
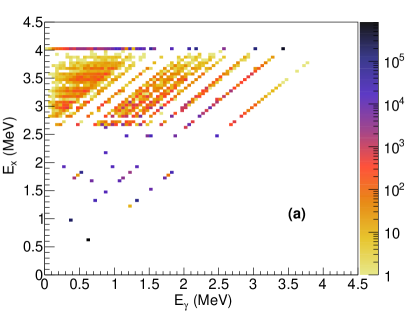
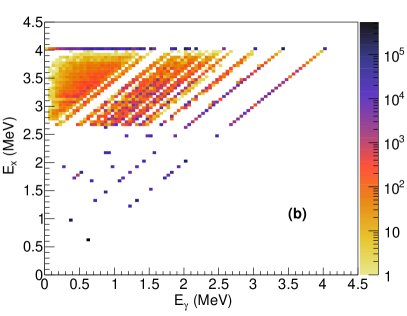
The DICEBOX code uses existing information on levels below a certain critical energy ( MeV in this analysis), including intensities of primary transition to these levels and subsequent transitions. Individual levels above and transitions from these levels are generated “randomly” based on statistical models of nuclear level density and photon strength functions. Each set of levels and transitions is called a “nuclear realization” Bečvář (1998). Assuming the data for levels below is accurate and complete, and given enough realizations, a model closely matching the cascade found in nature should be achievable. After the information on levels below was finalized, 100 nuclear realizations were simulated for thermal capture, and 200 for resonant capture, each with cascades. The nuclear realization best describing the spectra was chosen based on the global agreement for all bins in MSC spectra for . The chosen realizations were re-produced with cascades, for better statistics. Fig. 3 shows the agreement of MSC spectra for the chosen nuclear realization with the experiment for the thermal neutron energy window. There is only one common normalization factor for all multiplicities, so the good agreement indicates an accurate multiplicity distribution.
The information on the decay scheme below was taken from ENSDF Browne and Tuli (2007), largely based on the thermal neutron capture work by Prussin et al. Prussin et al. (1977). Transition intensities were slightly adjusted to improve the agreement between data and simulations. The changes to the thermal capture cascade, from that described in Prussin’s measurement, were relatively minor. On the other hand, no information on cascade transitions was available for decay of the 2.154 keV resonance. The primary transitions from this resonance were initially based on the thermal cascade model, but significant adjustments were made manually to reproduce the resonance MSC spectra.
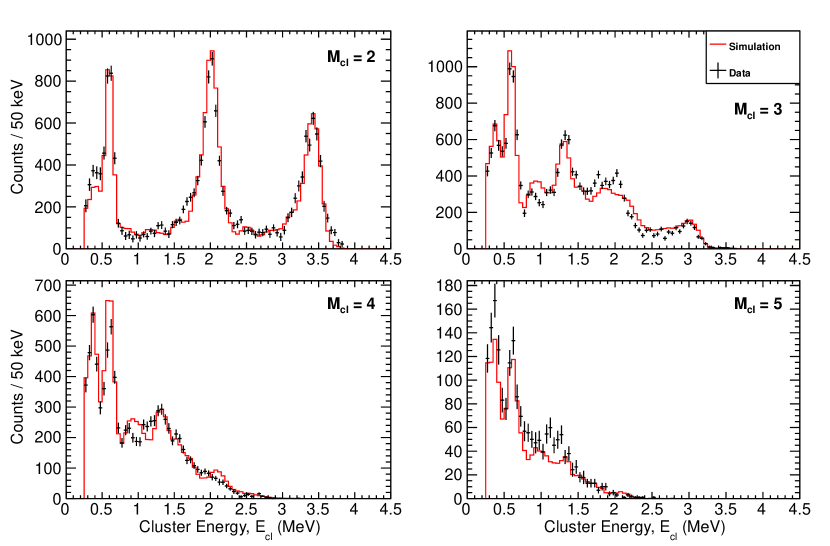
The neutron capture cascades for the thermal neutron window and 2.154 keV resonance window show significant differences, as seen in Figs. 3 and 4. This is not surprising as the initial states are different: the 2.154 keV resonance is a -wave state, while thermal neutrons (-wave) produce a state.
The most visible difference is a strong two-step cascade seen in the middle of the MSC spectrum for the resonance. Its presence indicates the existence of a state at MeV; this is the only spin which allows dipole transitions to connect the neutron capturing state (presumed to be Mughabghab (2006)) with the ground state (). A level with this spin cannot be strongly populated in thermal neutron capture as it cannot be accessed via a dipole primary transition from the thermal capture state (). Several levels near 2 MeV excitation energy have been reported from studies of decay of the ground state Browne and Tuli (2007).
Direct transition from the thermal capture state to the ground state would require an octopole transition (extremely suppressed), and has not been observed in previous experiments Prussin et al. (1977). However, for capture at the 2.154 keV resonance, a direct transition to the ground state could be achieved with an electric quadrupole transition, and would show up in the data as a peak at keV. As the data is background dominated and contains important features missed with the usual gate selection on , a separate study was performed to measure the possible intensity of this primary transition. After background subtraction (as described in Sec. III.2), the expected peaks at and 3424 keV were observed in the spectrum. Peaks at lower energies were unusable due to large unsubtracted backgrounds. Simulations of the known capture cascade were performed with varying intensities of the direct transition to the ground state until the two peaks were well reproduced, although a relatively flat background spectrum of unknown origin remained. Based on this, we determined that resonant captures will transition directly to the ground state of the time. This contribution to the decay was added to the resonant cascade model for DICEBOX. Because the data are not sensitive to this transition, and because the backgrounds are not fully understood, a separate systematic uncertainty was included to account for this transition.
The decay scheme, represented as the relative intensities of emission as a function of initial energy and -ray energy are, for both thermal and keV capture, shown in Fig. 5. The intensities are given in 50 keV wide bins. Decay cascades corresponding to these schemes are included in the supplemental material.
As evident from Figs. 3 and 4, simulations do not describe the spectra exactly, especially at higher multiplicity. However, the discrepancies there are small compared to the entire intensity, accounting for only a few percent of all transitions. It should be noted that the number of counts from a cascade is given by , so discrepancies in the MSC histograms for higher multiplicities are exaggerated.
III.4 Relative Cross Section
Using the optimal nuclear realizations, we calculated the efficiency for detecting an event within and MeV. The efficiency for detecting a thermal (2.154 keV resonance) neutron capture within the selected gate and multiplicity gate was 28.9% (24.9%).
In general, the cross sections can be calculated as
| (1) |
where is the number of captures passing selection cuts after background subtraction, is the efficiency for a capture to pass those selections, is the neutron flux, and is a term containing the xenon gas density and other parameters which are independent of neutron energy. At thermal energy (25 meV) the cross section is near constant (to ) within the measurement energy window. At resonance energy, the cross section varies rapidly with , so the integral of the cross section over the resonance is the preferred way of reporting results. Thus, the cross section ratio between resonance and thermal captures is reported in units of inverse energy. Reporting a ratio, rather than absolute cross sections, allows for considerable reduction of systematic uncertainties, and avoids complications associated with calibrating the absolute flux and efficiency.
The ratio of the cross section in the thermal window to the 2.154 keV resonance integral was found to be 4.10 0.10 (stat.) 0.24 (sys.) . The thermal neutron energy window was centered at 25 meV with a width of 1.3 meV and the resonance neutron energy window was chosen to be from 2094 to 2203 eV, which encompasses the entire resonance within the neutron energy resolution of DANCE.
The systematic uncertainty on the ratio comes from the quadrature sum of the flux ratio uncertainty (1.7%), efficiency ratio uncertainty (3.3%), 4027 keV direct transition uncertainty (0.5%) and an additional uncertainty (4.4%) which accounts for uncertainties in background subtraction. The background subtraction uncertainty was largely determined through tests of the robustness of the measurement with different gates. The efficiency ratio uncertainty was computed by examining efficiency changes due to possible energy mis-calibration, differences in efficiency between DAQ cards, crystal timing calibration, and simulation inaccuracy. The statistical uncertainty, comprising uncertainty in thermal, resonance, and background counts, is 2.5%.
We also searched for peaks in the background-subtracted event rate as a function of . No additional resonances were observed for neutron energies between 9 and 2154 eV. In particular, we did not observe the 600 eV resonance included in the TENDL-2014 evaluation Koning et al. ; Koning and Rochman (2012).
IV Absolute Cross Section
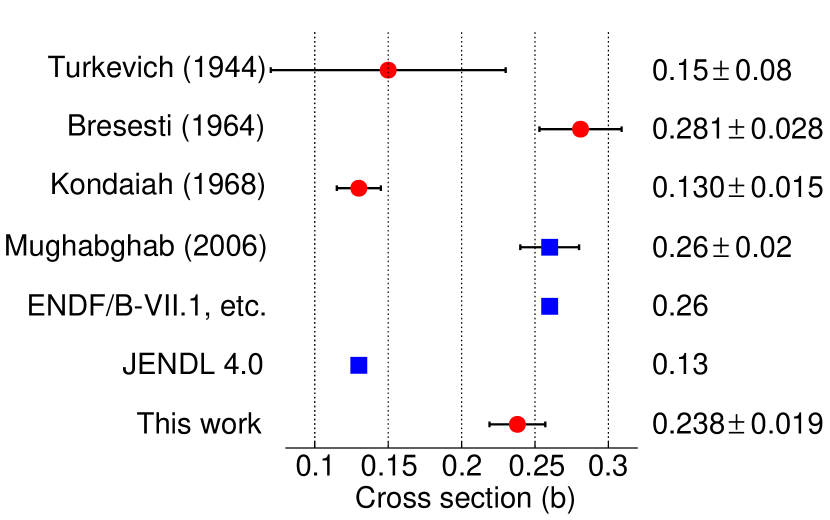
The ratio between thermal and resonance cross sections from the ENDF/B-VII.1 evaluation Shen and Mughabghab (2006) is 6.95 meV-1, considerably different than our measured ratio of 4.10 0.10 (stat.) 0.24 (sys.) . After examining the calibration data available for the particular DANCE detector configuration used, we found that we could determine a more precise absolute thermal neutron cross section by using a separate measurement of the resonance integral to calibrate our measurement. One absolute cross section measurement of the 2.154 keV resonance has been reported by Macklin Macklin (1988). Converting the resonance kernel value of meV Macklin (1988) to a resonance integral yields b eV. Combining the relative cross section ratio from our analysis with this resonance integral gives us a value of 0.238 0.019 b for the thermal cross section.
Past measurements of the thermal cross section have considerable differences, and evaluated cross sections vary similarly. A summary of thermal cross section measurements and evaluations is shown in Figure 6. Our result favors the Bresesti et al. Bresesti et al. (1965) measurement ( b) over the Kondaiah et al. Kondaiah et al. (1968) measurement ( b). Most recent evaluations Pritychenko and Mughabghab (2012) give the thermal cross section as 0.26 b, consistent with our result, though JENDL-4.0 Shibata et al. (2011) is an exception, favoring the Kondaiah measurement and giving 0.13 b.
V Discussion
The complete decay pattern from radiative neutron capture can only be obtained for light nuclei using detectors with very good energy resolution (typically Ge). More complex nuclei, such as , have too many levels to obtain a perfect cascade model. Detectors with worse energy resolution but high granularity, such as DANCE, can still provide valuable information about the cascades when simulations are used to model the detector response and experimental spectra are compared with predicted models.
Fortunately, for purposes of modeling the cascades for use in neutrinoless double beta decay experiments such as EXO-200, it is not necessary to know the decay scheme with extremely high precision, and the approximation presented here is sufficient. The Prussin et al. measurement of thermal neutron capture already produced a capture cascade model with precisely measured energy levels. The measurement presented here features coincidence data not available in the previous measurement, and is used in conjunction with the old results to produce a more refined capture cascade model. This may assist with mitigation of the beta decay background in experiments. The resonant capture model presented here is new.
The cross section measurement may help resolve discrepancies between earlier measurements of thermal neutron capture on . This can help guide future evaluations, which can in turn allow for improved simulations of neutron transport in experiments.
VI Acknowledgements
This work was partially funded by the Office of the Vice Provost of Research at Indiana University-Bloomington through the Faculty Research Support Program, and by the US Department of Energy Grant No. DE-SC0012191. This work has benefited from the use of the LANSCE facility at the Los Alamos National Laboratory. This work was performed under the auspices of the U.S. Department of Energy by Los Alamos National Security, LLC, under Contract No. DE-AC52-06NA25396 and by Lawrence Livermore National Security, LLC, under Contract No. DE-AC52-07NA27344. M.K. acknowledges the support of the Czech Science Foundation under Grant No. 13-07117S.
References
- Auger et al. (2012a) M. Auger et al. (EXO-200), JINST 7, P05010 (2012a).
- Gando et al. (2013) A. Gando et al. (KamLAND-Zen), Phys. Rev. Lett. 110, 062502 (2013).
- Martín-Albo et al. (2013) J. Martín-Albo et al. (NEXT Collaboration), Journal of Physics: Conference Series 460, 012010 (2013).
- Redshaw et al. (2007) M. Redshaw, E. Wingfield, J. McDaniel, and E. G. Myers, Phys. Rev. Lett. 98, 053003 (2007).
- Auger et al. (2012b) M. Auger et al. (EXO), Phys. Rev. Lett. 109, 032505 (2012b).
- Albert et al. (2014) J. B. Albert et al. (EXO-200), Nature 510, 229 (2014).
- Albert et al. (2016) J. B. Albert et al. (EXO-200), JCAP 1604, 029 (2016).
- Carlson et al. (1969) G. C. Carlson, W. C. Schick Jr., W. L. Talbert Jr., and F. K. Wohn, Nuclear Physics A 125, 267 (1969).
- Ullmann et al. (2014) J. L. Ullmann et al., Phys. Rev. C 89, 034603 (2014).
- Reifarth et al. (2004) R. Reifarth et al., Nucl. Inst. Methods Phys. Res., Sect. A 531, 530 (2004).
- Hale and Young (1991) G. M. Hale and P. G. Young, “ENDF/B-VI MAT 325,” (1991).
- Allison et al. (2006) J. Allison et al., IEEE Trans. Nucl. Sci. 53, 270 (2006).
- Agostinelli et al. (2003) S. Agostinelli et al. (GEANT4), Nucl. Inst. Methods Phys. Res., Sect. A 506, 250 (2003).
- Jandel et al. (2007) M. Jandel et al., Nucl. Inst. Methods Phys. Res., Sect. B 261, 1117 (2007).
- Bečvář (1998) F. Bečvář, Nucl. Inst. Methods Phys. Res., Sect. A 417, 434 (1998).
- Rusev et al. (2013) G. Rusev, M. Jandel, M. Krtička, C. W. Arnold, T. A. Bredeweg, A. Couture, W. A. Moody, S. M. Mosby, and J. L. Ullmann, Phys. Rev. C 88, 057602 (2013).
- Browne and Tuli (2007) E. Browne and J. K. Tuli, Nuclear Data Sheets 108, 2173 (2007), Data extracted from the ENSDF database, version February 12, 2015, http://www.nndc.bnl.gov/.
- Prussin et al. (1977) S. G. Prussin, R. G. Lanier, G. L. Struble, L. G. Mann, and S. M. Schoenung, Phys. Rev. C 16, 1001 (1977).
- Mughabghab (2006) S. F. Mughabghab, Atlas of Neutron Resonances: Resonance Parameters and Thermal Cross Sections. Z=1-100 (Elsevier Science, 2006).
- (20) A. Koning et al., “TENDL-2014: TALYS-based evaluated nuclear data library,” http://www.talys.eu/tendl-2014.html.
- Koning and Rochman (2012) A. Koning and D. Rochman, Nuclear Data Sheets 113, 2841 (2012).
- Shen and Mughabghab (2006) Q. B. Shen and S. F. Mughabghab, “ENDF/B-VII.1 MAT 5461,” (2006).
- Macklin (1988) R. L. Macklin, Search for Resonance Neutron Capture, Tech. Rep. ORNL/TM-10766 (1988) EXFOR database: http://www-nds.iaea.org/EXFOR/13159.002.
- Bresesti et al. (1965) M. Bresesti, F. Cappellani, A. M. Del Turco, H. Neumann, and E. Orvini, J. Inorg. Nucl. Chem. 27, 1175 (1965).
- Kondaiah et al. (1968) E. Kondaiah, N. Ranakumar, and R. W. Fink, Nuclear Physics A 120, 329 (1968).
- Pritychenko and Mughabghab (2012) B. Pritychenko and S. F. Mughabghab, Nucl. Data Sheets 113, 3120 (2012).
- Shibata et al. (2011) K. Shibata et al., Journal of Nuclear Science and Technology 48, 1 (2011).
- Macnamara and Thode (1950) J. Macnamara and H. G. Thode, Phys. Rev. 80, 296 (1950).
- Eastwood and Brown (1963) T. Eastwood and F. Brown, Prog. Rep.: Canadian report to EANDC 16, 6 (1963), EXFOR database: http://www-nds.iaea.org/EXFOR/11849.014.
- OECD/NEA Data Bank (2014) OECD/NEA Data Bank, “The JEFF-3.2 Nuclear Data Library,” http://www.oecd-nea.org/dbforms/data/eva/evatapes/jeff_32/ (2014).
- Way and Haines (1947) K. Way and G. Haines, Tables of Neutron Cross Sections (1947) AECD 2274.