The Collapse of the Wien Tail in the Coldest Brown Dwarf? Hubble Space Telescope Near-Infrared Photometry of WISE J085510.83071442.5
Abstract
We present Hubble Space Telescope (HST) near-infrared photometry of the coldest known brown dwarf, WISE J085510.83071442.5 (WISE 08550714). WISE 08550714 was observed with the Wide Field Camera 3 (WFC3) aboard HST using the F105W, F125W, and F160W filters, which approximate the , , and near-infrared bands. WISE 08550714 is undetected at F105W with a corresponding 2 magnitude limit of 26.9. We marginally detect WISE 08550714 in the F125W images (S/N 4), with a measured magnitude of 26.41 0.27, more than a magnitude fainter than the band magnitude reported by Faherty and coworkers. WISE J08550714 is clearly detected in the F160W band, with a magnitude of 23.86 0.03, the first secure detection of WISE 08550714 in the near-infrared. Based on these data, we find that WISE 08550714 has extremely red F105WF125W and F125WF160W colors relative to other known Y dwarfs. We find that when compared to the models of Saumon et al. and Morley et al., the F105WF125W and F125WF160W colors of WISE 08550714 cannot be accounted for simultaneously. These colors likely indicate that we are seeing the collapse of flux on the Wien tail for this extremely cold object.
=1
1 Introduction
Without a stable internal energy source, brown dwarfs continuously cool over time. At their lowest temperatures, their atmospheres are composed primarily of molecules in both the gas phase and solid phase (in the form of condensate clouds) and thus their emergent spectra are sculpted by broad molecular absorption bands of H2O, CH4, and NH3. The exact chemical composition of their atmospheres evolves as they cool, which gives rise to the smooth variation in spectral morphology that is reflected in the MLTY spectral sequence.
The vast majority of brown dwarfs in the field (1000) were discovered by wide-field surveys such as the Two Micron All Sky Survey and the Sloan Digital Sky Survey (e.g., Kirkpatrick et al. 1999, Hawley et al. 2002, Cruz et al. 2003, Chiu et al. 2006). These surveys were adept at identifying the relatively warm L (=2400–1400 K) and T (=1400–700 K) dwarfs because they operated at red-optical (0.71.0 m) and near-infrared (12.5 m) wavelengths. The evolution of a brown dwarf through the MT sequence is controlled by two main processes: 1) the formation of dust and 2) a shift in the carbon chemistry (see however, Tremblin et al. (2016) for an alternative explanation). The M/L transition is marked by the formation of dust clouds that remove refractory elements (TiO, VO, Fe, Si, Al) from the gas phase and generate their own continuum opacity. The L/T transition is signaled by a sudden loss of this opacity (by some as-yet unknown mechanism) and a shift in the carbon chemistry from being CO-dominated to CH4-dominated. Our confidence that the basic physics for L and T dwarfs is well understood is buoyed by the fact that atmospheric models do a reasonably good job of matching their observed spectra from the red-optical to the mid-infrared (e.g., Cushing et al. 2008, Stephens et al. 2009).
Identifying even cooler brown dwarfs required moving to mid-infrared (2.55 m) wavelengths and indeed the Spitzer Space Telescope and the Wide-field Infrared Survey Explorer (WISE) have discovered twenty-two of the twenty four brown dwarfs known with effective temperatures less than 500 K (Cushing et al. 2011, Luhman et al. 2011, Kirkpatrick et al. 2012, Tinney et al. 2012, Kirkpatrick et al. 2013, Cushing et al. 2014, Pinfield et al. 2014, Luhman 2014b, Dupuy et al. 2015, and Schneider et al. 2015), the exceptions being CFBDSIR J14581013 (Liu et al., 2011) and WISE J12171626B, a companion to a WISE identified late-T dwarf (Liu et al. 2012, Leggett et al. 2015). These brown dwarfs, which populate the Y spectral class (Cushing et al. 2011, Kirkpatrick et al. 2012), have proven much harder to understand primarily because of their paucity and intrinsic faintness (). In particular, unlike in the case of the L and T dwarfs, model atmospheres struggle to simultaneously account for near- and mid-infrared observations of Y dwarfs (Schneider et al., 2015) which suggests that they are either missing or incorrectly modeling important physics. Yet it is exactly these cold brown dwarfs that provide the best constraints on the brown dwarf mass function (Burgasser, 2004) and the ultracool model atmospheres required to interpret observations of the gas giant exoplanets discovered with the next-generation adaptive optics instruments (e.g. the Gemini Planet Imager and VLT’s SPHERE).
WISE J085510.83071442.5 (hereafter WISE 08550714) was independently identified using multi-epoch WISE observations by Luhman (2014a) and Kirkpatrick et al. (2014) as a high proper motion object, but it was Luhman (2014b) who measured a distance of only 2 pc, securing it as the fourth closest system to the Sun. The extremely red colors of [3.6][4.5] = 3.55 mag111where [3.6] and [4.5] refer to channel 1 and channel 2 of the InfraRed Array Camera (IRAC; Fazio et al. 2004) aboard the Spitzer Space Telescope and J[4.5] 9.11 mag (Luhman & Esplin 2014, Faherty et al. 2014), and faint absolute magnitude of 17.1 mag (Luhman & Esplin, 2014) make WISE 0855 the reddest, faintest, and coldest ( 250 K) brown dwarf known. To date, there have been four published efforts to image WISE 08550714 in the near-infrared, resulting in three upper limits ( 24.4 mag, Beamín et al. 2014; 24.8 mag, Kopytova et al. 2014; and 22.7 mag, Wright et al. 2014) and one tentative detection ( = 24.8 mag at 2.6; Faherty et al. 2014 (see Table 1)). WISE 08550714 is therefore the only known Y dwarf without a secure detection in the near-infrared. Since WISE 08550714 is simply too faint obtain a near-infrared spectrum, even with the Hubble Space Telescope (HST), we obtained HST near-infrared images of WISE 08550714 to measure its near-infrared spectral energy distribution.
2 HST/WFC3 Observations
We observed WISE 08550714 with the F105W ( = 1055.2 nm), F125W ( = 1248.6 nm), and F160W ( = 1536.9 nm) filters of Wide Field Camera 3 (WFC3; Kimble et al. 2008) aboard HST, where is the “pivot wavelength” (see Tokunaga & Vacca 2005). These filters coincide roughly with the , , and photometric bands. The F105W and F125W observations took place on UT 2016 Mar 1 with total exposure times of 3835s and 3635s, respectively. The F160W observations took place on UT 2016 Mar 15 and UT 2016 Mar 27, with a total exposure time of 25920s.
| Parameter | Value | Ref. |
|---|---|---|
| z | 24.8bbAB magnitude; S/N 3 mag | 2 |
| Y | 24.4ccS/N 3 mag | 3 |
| F105W | 26.9aa2 upper limit (Section 2). mag | 1 |
| J | 25.0 (or 24.0ddS/N 5) mag | 4 |
| F125W | 26.41 0.27 mag | 1 |
| H | 22.7ccS/N 3 mag | 5 |
| F160W | 23.86 0.03 mag | 1 |
| K | 18.6ccS/N 3 mag | 6 |
| W1 | 17.819 0.327 mag | 5 |
| W2 | 14.02 0.05 mag | 5 |
| 17.44 0.05 mag | 6 | |
| 13.89 0.02 mag | 6 |
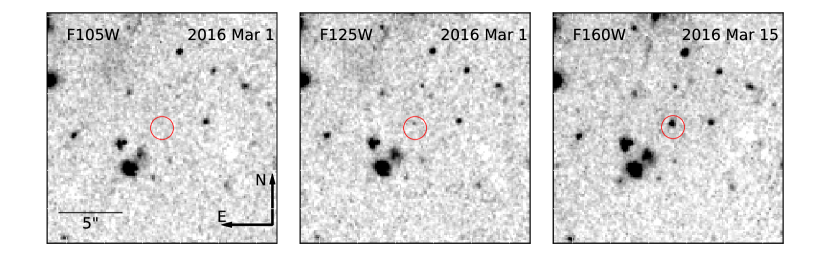
All images for each filter were aligned and then combined with the tweakreg and astrodrizzle routines available in the AstroDrizzle software (Gonzaga et al., 2012). However, there were several individual exposures for which the World Coordinate System (WCS) was in error during the first visit for the F160W observations. These few frames were omitted when constructing our F160W images. This has no affect on any resulting science conclusions because WISE 08550714 is well detected at F160W. We created drizzled images for all three visits individually. Even though some frames were excluded from the first visit, the total exposure time was the same as that of the other visits, 7770 seconds. The photometry of WISE 08550714 from each of the F160W images was consistent to within 0.03 magnitudes (less than 1). Thirty square arcsecond cut-outs of the combined F105W, F125W, and F160W images around the position of WISE 08550714 are shown in Figure 1. Any differences between expected positions and HST positions are due to either proper motion and parallax uncertainties, positional uncertainties associated with the IRAC coordinates from which the expected positions were calculated, or offsets of the HST WCS. We do not detect WISE 08550714 in the F105W image at its expected position. While WISE 08550714 does appear in the F125W image, it is very faint, with a signal-to-noise ratio (S/N) of 4. We determine F125W and F160W magnitudes following the method of Schneider et al. (2015), whereby we place random apertures around the image in order to determine the background flux. This process is used because the noise in adjacent pixels becomes correlated as part of the drizzling process, thereby making the common practice of using a sky annulus to determine the noise of the background unsuitable. The F160W image in Figure 1 and the F160W photometry in Table 1 come from the first visit.
For the F105W image, we measure an upper limit following the method in the WISE explanatory supplement222http://wise2.ipac.caltech.edu/docs/release/prelim/expsup/sec4_3c.html#ul2, where we take the flux measurement plus two times the measurement uncertainty as the 95% confidence upper limit. The aperture for this measurement is placed on the F105W image at the position of WISE 08550714 in the F125W image because both sets of observations were executed on the same day. HST photometry from this program, as well as a summary of all previously published photometry for WISE 08550714 is provided in Table 1. All photometry is on the Vega system unless otherwise noted.
3 Analysis
3.1 Colors Versus Spectral Type
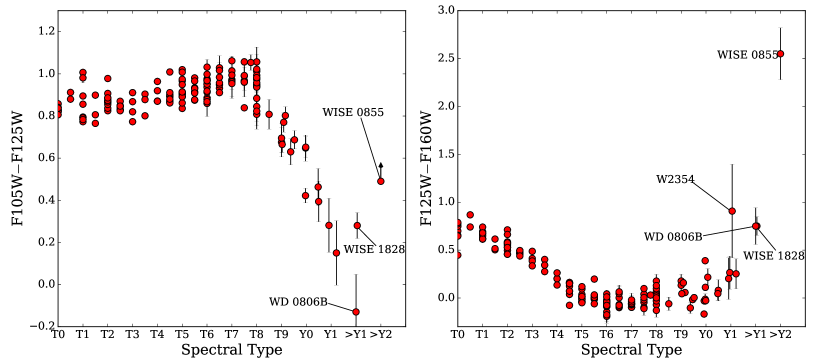
With near-infrared photometry in hand, we can now place WISE 08550714 in a broader context by comparing its near-infrared colors to those of known T and Y dwarfs. Figure 2 shows the F105WF125W and F125WF160W colors of a sample of T and Y dwarfs and WISE 08550714. All T dwarf colors are found synthetically from HST system throughput tables333http://stsci.edu/hst/wfc3/ins_performance/throughputs and near-infrared spectra found in the SpeX Prism Library444http://pono.ucsd.edu/adam/browndwarfs/spexprism/ (Burgasser, 2014). Y dwarf colors are determined synthetically from the HST spectroscopic sample of Schneider et al. (2015). Because there are very few late-T dwarfs (T7) in the SpeX Prism Library and in the HST sample of Schneider et al. (2015), we supplement these two datasets with late-T spectra from Kirkpatrick et al. (2011). Also shown is the near-infrared photometry of two other cold brown dwarfs with estimated effective temperatures less than 300 K; WD 0806661B (Luhman et al., 2011) and WISE 182831.08265037.6 (Cushing et al., 2011)555Note, however, that an independent estimate of the effective temperature of WISE 182831.08265037.6 based on its bolometric luminosity of 520 K (Dupuy & Kraus, 2013) implies that WISE 182831.08265037.6 is actually much warmer. It has been suggested that WISE 182831.08265037.6 is in fact an unresolved binary, which would help explain its unusual luminosity (Leggett et al., 2013).. The photometry for WISE 182831.08265037.6 is determined synthetically from its spectrum (Cushing et al., in preparation), while the photometry for WD0806661B is determined directly from HST images (Gelino et al., in preparation). Because a spectral type of WISE 08550714 is currently unknown, we label it as Y2. Similarly, WISE 182831.08265037.6 and WD0806661B are denoted as Y1.
The severe turn towards the blue of the F105WF125W color at the T/Y boundary is typically ascribed to the loss of the K I and Na I opacity in the red optical as these atoms condense into KCl and Na2S (Lodders 1999, Burningham et al. 2010). A similar trend is seen in the (Lodieu et al., 2013) and (Burningham et al. 2010, Liu et al. 2012, Leggett et al. 2013, Leggett et al. 2015, Schneider et al. 2015) colors of Y dwarfs. Note, however, that the measured colors for Y dwarfs are typically much bluer than models that incorporate this loss predict (e.g., Morley et al. 2014), suggesting that there may be other factors affecting the flux around 1 micron (see Liu et al. 2012).
At even lower temperatures, models predict this trend turns back towards the red with the precipitous loss of the Wien tail (Burrows et al., 2003). The position of WD 0806661B implies the blueward trend continues. However, WISE 182831.08265037.6 may be showing the first hints of this turnaround. Even though WISE 08550714 was undetected in the F105W image, the F105WF125W color limit is redder than those of every other brown dwarf with spectral type Y1, showing that the blueward trend must turn back toward the red somewhere between the Y1 dwarfs, WD0806661B, WISE 182831.08265037.6, and WISE 08550714.
The F125WF160W colors plateau for T7 to Y0 type objects, but there have been hints that this trend also turns back to the red (e.g., Cushing et al. 2011, Kirkpatrick et al. 2012, Leggett et al. 2013, Cushing et al. 2014, Leggett et al. 2015, Schneider et al. 2015). Interestingly, atmospheric models predict a turn to the blue around 300 K, since the water clouds that form at these temperatures absorb light in F160W but not in F125W (Morley et al., 2014). We do not see this blueward trend. Instead, the inclusion of WISE 182831.08265037.6, WD 0806661B, and WISE 08550714 on this diagram shows definitively that the F125WF160W color turns toward the red for the coldest brown dwarfs. In summary, both the F105WF125W color limit and F125WF160W are extremely red compared to known Y dwarfs, and can likely be attributed to the collapse of the Wien tail at the low temperature of WISE 08550714.
3.2 Color-Magnitude Diagrams
In order to properly compare the HST photometry of WISE 08550714 with that of other brown dwarfs and low-temperature models on color-magnitude diagrams, we need to determine HST photometry for those samples. For the models, colors are found synthetically from the model spectra. To obtain absolute F125W magnitudes, we measure the F125W color for each model spectrum synthetically, then apply these offsets to the absolute provided for each model666http://www.ucolick.org/cmorley/cmorley/Models.html. Colors and absolute magnitudes for known brown dwarfs and low-mass stars are found in a similar fashion: we first determine colors synthetically from spectra available in the SpeX Prism Library, Kirkpatrick et al. (2011), and Schneider et al. (2015). For the HST spectra, we measure F125W and F160W magnitudes directly since the spectra are absolutely flux calibrated. For spectra from the SpeX Prism Library and Kirkpatrick et al. (2011), we first compute the F125W color synthetically from the spectrum, and determine F125W magnitudes from measured values. The majority of and parallax measurements come from the Database of Ultracool Parallaxes maintained by Trent Dupuy777http://www.as.utexas.edu/tdupuy/plx/Database_of_Ultracool_Parallaxes.html (Dupuy & Liu, 2012). Additional photometry and parallaxes were taken from Kirkpatrick et al. (2011), Scholz et al. (2012), Mace et al. (2013), Marsh et al. (2013), Beichman et al. (2014), and Tinney et al. (2014). The average values of F125W and F160W for known Y dwarfs are 0.69 and 0.16 mag, respectively.
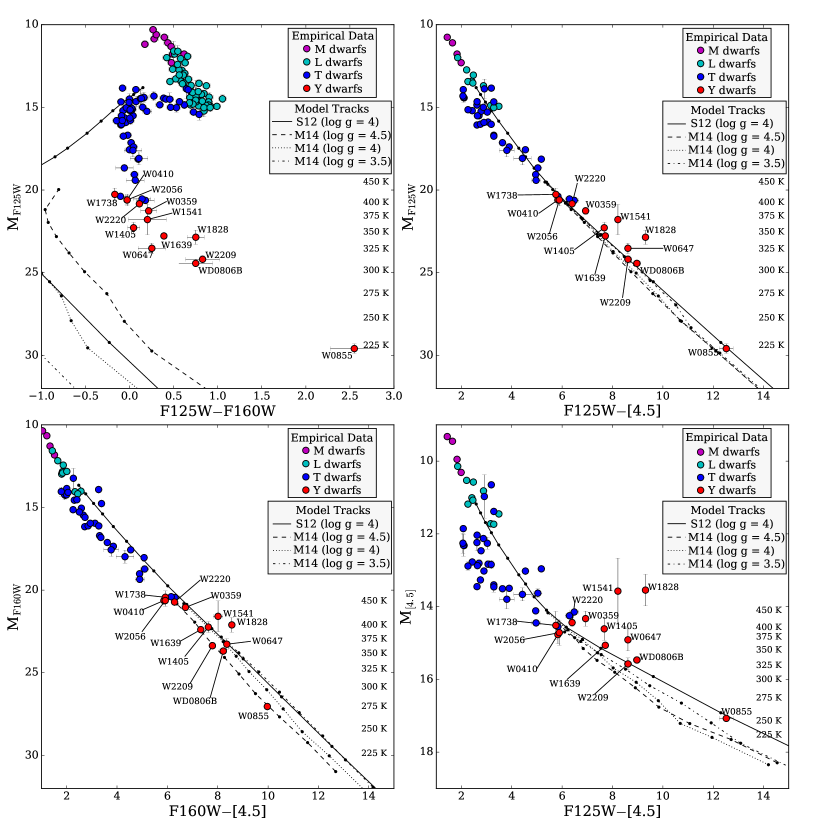
Previous studies have shown that colors of the coldest brown dwarfs are not well reproduced by low temperature models (e.g., Leggett et al. 2015, Schneider et al. 2015). Models generally predict much bluer colors for a given absolute magnitude than what is measured. The position of WISE 08550714 in the F125WF160W color-magnitude diagram in the top left panel of Figure 3 shows this issue extends down to the temperature of WISE 08550714. We use the WISE 08550714 parallax from Luhman & Esplin (2014) for this figure. We include in Figure 3 cloud-free models from Saumon et al. (2012) and models that include sulfide and water clouds and are 50% cloudy (Morley et al., 2014). The lowest temperature 100% cloudy models of Morley et al. (2012) are 400 K, much warmer than estimates for WISE 08550714, so are not considered here. All models used have solar metallicities and are in chemical equilibrium. For the 50% cloudy models of Morley et al. (2014), very little variation is seen in the photometry for different values of sedimentation efficiency (), so we choose to only compare to = 5 models. We also chose only to employ models with surface gravities consistent with the evolutionary models of Saumon & Marley (2008).
As seen in the figure, there is no single model down to 225 K that reaches a F125WF160W color as red as the color of WISE 08550714. Note that the log g = 3.5 and much of the log g = 4 model tracks have bluer colors than the limits of the figure. The F125WF160W color of the = 225 K, log g = 4.5, = 5 model of Morley et al. (2014) comes the closest to WISE 08550714. However, that model has a F105WF125W color of 0.1 mag, which is clearly ruled out by our F105W upper limit (see Figure 2).
Leggett et al. (2016) showed that the cloud-free models of Tremblin et al. (2015) are more consistent with the colors of Y dwarfs than those of Saumon et al. (2012) (see their Figure 4). Applying our F125W and F160W offsets to WISE 08550714 we find 28.9 mag and 2.0 mag. The only model track in Figure 4 of Leggett et al. (2016) that extends down to an value of 29 mag has a log g = 4.5 and is computed with equilibrium chemistry. While that model track extends beyond the boundaries of the figure, we estimate its color to be 1.5, much closer to WISE 08550714’s color of 2.0 than the color predicted by the Saumon et al. (2012) models of 0.
The top and bottom right panels of Figure 3 show the absolute F125W and [4.5] magnitudes as a function of F125W[4.5] color. Model F125W[4.5] colors reproduce the measured colors of cold brown dwarfs much better than the F125WF160W model colors. When compared to the log g = 4 Morley et al. (2014) models that extend down to 200 K, the position of WISE 08550714 on these figure suggests a temperatures between 225 K and 250 K, similar to previous estimates (Beamín et al. 2014, Faherty et al. 2014, Kopytova et al. 2014, Luhman 2014b, Luhman & Esplin 2014).
We also show the F160W absolute magnitude as a function of F160W[4.5] color in the bottom left panel of Figure 3. This diagram is notable because the F160W and [4.5] bands have the smallest photometric uncertainties of all the measurements in Table 1. In this diagram, WISE 08550714 lies very close to the log g = 4.5 model track, with a temperature between 250 and 275 K, slightly warmer than estimates using other photometric bands. It should not be too surprising that the temperature estimate from the F160W magnitude is warmer than that from the F125W magnitude, considering that the F160W magnitude of WISE 08550714 is so much brighter.
4 Discussion
Faherty et al. (2014), using their 2.6 band detection of WISE 08550714, conclude that WISE 08550714 likely contains water clouds within its atmosphere based on its position in a diagram comparing its absolute WISE channel 2 (W2) magnitudes and W2 color to those from models. However, using an updated parallax measurement and the band measurement of Faherty et al. (2014), Luhman & Esplin (2014) find that the absolute magnitude and the [4.5] color were consistent with Saumon et al. (2012) cloudless models with an atmosphere whose carbon and nitrogen chemistry is out of equilibrium due to vertical mixing in the atmosphere. Our new position for WISE 08550714 in the M[4.5] vs. F125W[4.5] color-magnitude diagram (bottom right panel of Figure 3) does little to clear up whether it better matches cloud-free, water-cloud, or non-equilibrium chemistry models because we do not have non-equilibrium models. Nevertheless, the fact that its position agrees extremely well with the Morley et al. (2014) water-cloud models in some diagrams in Figure 3, and not as well in others, suggests that drawing conclusions from a single color-magnitude diagram when considering competing models may be premature. Instead, a more comprehensive view of its full spectral energy distribution is likely needed.
Recent work has shown that non-equilibrium chemistry driven by vertical mixing is likely important in cold brown dwarf atmospheres, and may play a large role in shaping their final spectroscopic shapes (e.g., Schneider et al. 2015, Tremblin et al. 2015, Leggett et al. 2016). Non-equilibrium chemistry in the atmosphere of WISE 08550714 likely makes a large contribution to the discrepancies between models and observations (e.g., the F125WF160 color differences). A larger suite of models including the effects of non-equilibrium chemistry and cloud formation that extends down to values of 200 K will be necessary to draw any further conclusions of the atmospheric properties of this extremely cold object.
5 Acknowledgments
We thank the anonymous referee whose comments improved the clarity of this paper. We thank Mark Marley, Didier Saumon, and Caroline Morley for fruitful discussions and for graciously making their models publicly available online. This work is Based on observations made with the NASA/ESA Hubble Space Telescope, obtained at the Space Telescope Science Institute, which is operated by the Association of Universities for Research in Astronomy, Inc., under NASA contract NAS 5-26555. These observations are associated with program #14233. Support for program #14233 was provided by NASA through a grant from the Space Telescope Science Institute, which is operated by the Association of Universities for Research in Astronomy, Inc., under NASA contract NAS 5-26555. This publication makes use of data products from the Wide-field Infrared Survey Explorer, which is a joint project of the University of California, Los Angeles, and the Jet Propulsion Laboratory/California Institute of Technology. This research has benefitted from the SpeX Prism Spectral Libraries, maintained by Adam Burgasser at http://pono.ucsd.edu/adam/browndwarfs/spexprism.
References
- Beamín et al. (2014) Beamín, J. C., Ivanov, V. D., Bayo, A., et al. 2014, A&A, 570, L8
- Beichman et al. (2014) Beichman, C., Gelino, C. R., Kirkpatrick, J. D., et al. 2014, ApJ, 783, 68
- Burgasser (2004) Burgasser, A. J. 2004, ApJS, 155, 191
- Burgasser (2014) Burgasser, A. J. 2014, ASInC, 11, 7
- Burningham et al. (2010) Burningham, B., Pinfield, D. J., Lucas, P. W., et al. 2010, MNRAS, 406, 1885
- Burrows et al. (2003) Burrows, A., Sudarsky, D., & Lunine, J. I. 2003, ApJ, 596, 587
- Chiu et al. (2006) Chiu, K., Fan, X., Leggett, S. K., et al. 2006, AJ, 131, 2722
- Cruz et al. (2003) Cruz, K. L., Reid, I. N., Liebert, J., Kirkpatrick, J. D., & Lowrance, P. J. 2003, AJ, 126, 2421
- Cushing et al. (2008) Cushing, M. C., Marley, M. S., Saumon, D., et al. 2008, ApJ, 678, 1372-1395
- Cushing et al. (2011) Cushing, M. C., Kirkpatrick, J. D., Gelino, C. R., et al. 2011, ApJ, 743, 50
- Cushing et al. (2014) Cushing, M. C., Kirkpatrick, J. D., Gelino, C. R., et al. 2014, AJ, 147, 113
- Dupuy & Liu (2012) Dupuy, T. J., & Liu, M. C. 2012, ApJS, 201, 19
- Dupuy & Kraus (2013) Dupuy, T. J., & Kraus, A. L. 2013, Science, 341, 1492
- Dupuy et al. (2015) Dupuy, T. J., Liu, M. C., & Leggett, S. K. 2015, ApJ, 803, 102
- Faherty et al. (2014) Faherty, J. K., Tinney, C. G., Skemer, A., & Monson, A. J. 2014, ApJ, 793, L16
- Fazio et al. (2004) Fazio, G. G., Hora, J. L., Allen, L. E., et al. 2004, ApJS, 154, 10
- Gonzaga et al. (2012) Gonzaga, S., & et al. 2012, The DrizzlePac Handbook, HST Data Handbook, (Baltimore, STScI)
- Hawley et al. (2002) Hawley, S. L., Covey, K. R., Knapp, G. R., et al. 2002, AJ, 123, 3409
- Kimble et al. (2008) Kimble, R. A., MacKenty, J. W., O’Connell, R. W., & Townsend, J. A. 2008, Proc. SPIE, 7010, 43
- Kirkpatrick et al. (1999) Kirkpatrick, J. D., Reid, I. N., Liebert, J., et al. 1999, ApJ, 519, 802
- Kirkpatrick et al. (2011) Kirkpatrick, J. D., Cushing, M. C., Gelino, C. R., et al. 2011, ApJS, 197, 19
- Kirkpatrick et al. (2012) Kirkpatrick, J. D., Gelino, C. R., Cushing, M. C., et al. 2012, ApJ, 753, 156
- Kirkpatrick et al. (2013) Kirkpatrick, J. D., Cushing, M. C., Gelino, C. R., et al. 2013, ApJ, 776, 128
- Kirkpatrick et al. (2014) Kirkpatrick, J. D., Schneider, A., Fajardo-Acosta, S., et al. 2014, ApJ, 783, 122
- Kopytova et al. (2014) Kopytova, T. G., Crossfield, I. J. M., Deacon, N. R., et al. 2014, ApJ, 797, 3
- Leggett et al. (2013) Leggett, S. K., Morley, C. V., Marley, M. S., et al. 2013, ApJ, 763, 130
- Leggett et al. (2015) Leggett, S. K., Morley, C. V., Marley, M. S., & Saumon, D. 2015, ApJ, 799, 37
- Leggett et al. (2016) Leggett, S. K., Tremblin, P., Saumon, D., et al. 2016, arXiv:1603.09400
- Liu et al. (2011) Liu, M. C., Delorme, P., Dupuy, T. J., et al. 2011, ApJ, 740, 108
- Liu et al. (2012) Liu, M. C., Dupuy, T. J., Bowler, B. P., Leggett, S. K., & Best, W. M. J. 2012, ApJ, 758, 57
- Lodders (1999) Lodders, K. 1999, ApJ, 519, 793
- Lodieu et al. (2013) Lodieu, N., Béjar, V. J. S., & Rebolo, R. 2013, A&A, 550, L2
- Luhman et al. (2011) Luhman, K. L., Burgasser, A. J., & Bochanski, J. J. 2011, ApJ, 730, L9
- Luhman (2014a) Luhman, K. L. 2014a, ApJ, 781, 4
- Luhman (2014b) Luhman, K. L. 2014b, ApJ, 786, L18
- Luhman & Esplin (2014) Luhman, K. L., & Esplin, T. L. 2014, ApJ, 796, 6
- Mace et al. (2013) Mace, G. N., Kirkpatrick, J. D., Cushing, M. C., et al. 2013, ApJS, 205, 6
- Marsh et al. (2013) Marsh, K. A., Wright, E. L., Kirkpatrick, J. D., et al. 2013, ApJ, 762, 119
- Morley et al. (2012) Morley, C. V., Fortney, J. J., Marley, M. S., et al. 2012, ApJ, 756, 172
- Morley et al. (2014) Morley, C. V., Marley, M. S., Fortney, J. J., et al. 2014, ApJ, 787, 78
- Pinfield et al. (2014) Pinfield, D. J., Gromadzki, M., Leggett, S. K., et al. 2014, MNRAS, 444, 1931
- Saumon & Marley (2008) Saumon, D., & Marley, M. S. 2008, ApJ, 689, 1327
- Saumon et al. (2012) Saumon, D., Marley, M. S., Abel, M., Frommhold, L., & Freedman, R. S. 2012, ApJ, 750, 74
- Schneider et al. (2015) Schneider, A. C., Cushing, M. C., Kirkpatrick, J. D., et al. 2015, ApJ, 804, 92
- Scholz et al. (2012) Scholz, R.-D., Bihain, G., Schnurr, O., & Storm, J. 2012, A&A, 541, A163
- Stephens et al. (2009) Stephens, D. C., Leggett, S. K., Cushing, M. C., et al. 2009, ApJ, 702, 154
- Tinney et al. (2012) Tinney, C. G., Faherty, J. K., Kirkpatrick, J. D., et al. 2012, ApJ, 759, 60
- Tinney et al. (2014) Tinney, C. G., Faherty, J. K., Kirkpatrick, J. D., et al. 2014, ApJ, 796, 39
- Tokunaga & Vacca (2005) Tokunaga, A. T., & Vacca, W. D. 2005, PASP, 117, 421
- Tremblin et al. (2015) Tremblin, P., Amundsen, D. S., Mourier, P., et al. 2015, ApJ, 804, L17
- Tremblin et al. (2016) Tremblin, P., Amundsen, D. S., Chabrier, G., et al. 2016, ApJ, 817, L19
- Wright et al. (2014) Wright, E. L., Mainzer, A., Kirkpatrick, J. D., et al. 2014, AJ, 148, 82