Searching for molecular outflows in Hyper-Luminous Infrared Galaxies
Abstract
We present constraints on the molecular outflows in a sample of five Hyper-Luminous Infrared Galaxies using Herschel observations of the OH doublet at 119 m. We have detected the OH doublet in three cases: one purely in emission and two purely in absorption. The observed emission profile has a significant blueshifted wing suggesting the possibility of tracing an outflow. Out of the two absorption profiles, one seems to be consistent with the systemic velocity while the other clearly indicates the presence of a molecular outflow whose maximum velocity is about 1500 km s-1. Our analysis shows that this system is in general agreement with previous results on Ultra-luminous Infrared Galaxies and QSOs, whose outflow velocities do not seem to correlate with stellar masses or starburst luminosities (star formation rates). Instead the galaxy outflow likely arises from an embedded AGN.
keywords:
galaxies: active galaxies: evolution ISM: jets and outflows ISM: molecules quasars: general1 Introduction
Many hierarchical growth scenarios for galaxies have invoked co-evolution and symbiotic feedback between galaxies and their central supermassive black holes (SMBHs) (e.g., Merloni et al., 2004; Bower et al., 2006) in order to explain (1) the tight relation between host galaxy spheroid and SMBH masses (Gebhardt et al., 2000; Ferrarese & Merritt, 2000; Ferrarese et al., 2006; Côté et al., 2009), (2) the stark contrast between predicted and observed galaxy luminosity functions (Benson et al., 2003), and (3) the crude similarity between the global star formation and SMBH accretion rate histories over cosmic time (Madau & Dickinson, 2014). In particular, it is now believed that strong feedback from Active Galactic Nuclei (AGNs) plays a significant role in galaxy evolution, abruptly quenching star formation to produce the “red and dead” massive galaxies that we see today (Benson et al., 2003; Di Matteo et al., 2005; Croton et al., 2006; Bower et al., 2006), and polluting the intergalactic and intracluster media with metals (e.g., Gaspari et al., 2012). Evidence for such feedback has been steadily growing over the years (e.g., Veilleux et al., 2005; Fabian, 2012; González-Alfonso et al., 2014). For instance, detections of moderate-to-high velocity ionised outflows (100–1000 km s-1) have now been reported both as spatially resolved and kinematically distinct emission lines from ionisation regions or in absorption along the line-of-sight toward numerous QSOs and Seyfert galaxies (e.g., Reeves et al., 2003; Krongold et al., 2007; Chartas et al., 2007, 2009; Kraemer et al., 2009; Reeves et al., 2014). These studies have directly shown that AGNs can produce such feedback, and even hinted that the degree of feedback may scale with SMBH mass and accretion power. Nonetheless, many questions still remain about the underlying physics by which AGN-driven energy and momentum might be transferred to the interstellar medium and molecular clouds ultimately responsible for star formation.
A number of recent studies have provided observational evidence that neutral and molecular gas outflows also appear to be common in both AGNs and Ultra-Luminous Infrared Galaxies (hereafter ULIRGs). Rupke et al. (2005c) was among the first to spatially resolve and map the outflow within the closest powerful ULIRG Mrk 231. Rupke & Veilleux (2011) later detected strongly blueshifted ( km s-1) optical Nai D 5890, 5896 in absorption at kpc from Mrk 231’s nucleus, and Rupke & Veilleux (2013b) used Keck/OSIRIS adaptive optics observations to improve the spatial resolution of Mrk 231’s previously observed outflow by a factor , measuring a terminal velocity of km s-1. Concurrently, Fischer et al. (2010) discovered a 1000 km s-1 molecular outflow in Mrk 231 as traced by Herschel far-infrared (FIR) observations of OH in absorption, while Feruglio et al. (2010) detected spatially resolved CO emission in a km s-1 outflow using the IRAM/PdB Interferometer. Remarkably, the outflow mass rate estimated from OH and CO observations were in agreement within uncertainties (in the range 700–1000 M☉ yr-1). This estimate is significantly larger than the star formation rate (hereafter SFR) of M☉ yr-1 found in the host galaxy (Veilleux et al., 2009). Based on the energy requirements and the fact that the outflows appear to arise largely from the nucleus and not from nearby star forming regions, an AGN origin is generally favored in Mrk 231.
More generally, Sturm et al. (2011) reported the detection of massive molecular outflows traced by OH in several additional ULIRGs, suggesting that the AGN luminosity and the AGN contribution to the total infrared luminosity seem to be correlated with the outflow terminal velocities and anti-correlated with the gas depletion timescales. It is important to remark that OH lines are often associated with molecular H2 clouds that are somewhat perturbed from equilibrium. More recently, Veilleux et al. (2013, hereafter V13) presented a detailed study of a sample of 43 ULIRGs and QSOs at which were observed with Herschel using the OH doublet at 119 m to characterise their molecular outflows. V13 found that the molecular outflows in these systems do not show any obvious dependence on SFR, although they warn that the range of SFRs probed by their sample is relatively narrow ( dex). Furthermore, V13 found that ULIRGs with large AGN fractions and luminosities show OH features that are more blueshifted, particularly for objects with . Finally, Spoon et al. (2013) found that 15 out of 24 ULIRGs with showed evidence for molecular outflows in the 79 and 119 m OH doublets, with velocities km s-1, implying that AGNs were likely necessary to power these high speed outflows. Notably, none of these works included the most powerful luminous infrared galaxies, so-called Hyper-Luminous Infrared Galaxies (hereafter HLIRGs). HLIRGs are beacons pinpointing the extremes of both star formation and perhaps AGN accretion, and thus could provide clues about how the processes at work might scale with AGN power and star formation rate. Furthermore, while such systems relatively rare at low redshift, ULIRGs and HLIRGs are perhaps 100 times more common at high-z (Casey et al., 2014; Assef et al., 2015; Tsai et al., 2015), potentially providing more relevant contributions to the star formation and accretion densities at these epochs (e.g., Magnelli et al., 2011, 2013; Buchner et al., 2015) and serving as the likely progenitors for modern-day massive elliptical galaxies (e.g., Sanders et al., 1988).
In this work we analyse, for the first time, a sample of five HLIRGs in order to constrain their molecular outflows. We observed the rest-frame 118–121 m spectral region for each of these HLIRGs with Herschel to detect the molecular OH doublet at 119 m in emission or absorption and measure its outflow velocity. We found that three out of five HLIRGs present the OH doublet feature and only one of them shows unambiguous signatures consistent with a molecular outflow. In Section 2, we describe the galaxy sample. In Section 3 we outline the reduction and analysis of the observations. We present the results of this study in Section 4 and interpreted them in Section 5. Finally, we summarise our conclusions in Section 6. In this work, we adopt km s-1 Mpc-1, = 0.3, and = 0.7. We also adopt the standard convention that approaching material has a negative velocity with respect to the systemic velocity of the host galaxy due to Doppler shift.
2 Sample
2.1 Sample selection
Our sample was selected from a parent sample studied by Ruiz et al. (2007) which contains 14 HLIRGs. From this sample, we took 4 relatively local galaxies () with very high IR luminosities () to build a subsample of very bright sources ( Jy) in order to perform high signal-to-noise ratio Herschel observations in a reasonable amount of observational time. All galaxies in the sample are late-stage mergers with several lines of evidence indicating that these objects host powerful AGNs. Furthermore, we added another galaxy previously observed with Herschel and that satisfies the same selection criteria (see Section 3).
Previously measured galaxy properties are summarised in Table 1. We initially adopted redshift measurements from the literature, but found that some published values lacked associated errors and were considered less reliable. To remedy this, we obtained redshifts from new spectroscopic observations for two galaxies in our sample, which we adopt below and provide in Table 1; reduction details are presented in Appendix A.
| IRAS Name | Type | (Jy) | texp (h) | OBS–ID | |||
|---|---|---|---|---|---|---|---|
| (1) | (2) | (3) | (4) | (5) | (6) | (7) | (8) |
| F00183–7111∗ | AGN2 | 13.13 | 1.19 | 11.6 | 6.7 | 1342245966 | |
| 00397–1312 | AGN2 | 12.90 | 1.90 | – | 4.9 | 1342238350 | |
| 07380–2342 | AGN2 | 13.49 | 3.55 | 0.8 | 1342245974 | ||
| 12514+1027∗ | AGN2 | 12.92 | 0.76 | 11.8 | 1342248537, 1342248539 | ||
| 14026+4341 | QSO1 | 13.11 | 0.99 | 9.6 | 1342257687, 1342257688 |
-
•
Notes. Column 1: IRAS galaxy names. Column 2: AGN type from Ruiz et al. (2007). Column 3: redshifts from Saunders et al. (2000), except for the objects marked with an asterisk for which we used our own estimated values (see Appendix A). Column 4: IR luminosity , spanning 8–1000 m Ruiz et al. (2007). Column 5: flux density at 100 m from Ruiz et al. (2007). Column 6: X-ray luminosity spanning 0.2–10 keV from Ruiz et al. (2007). Column 7: total PACS exposure time of our observations, except for IRAS 00397–1312 which was previously observed as part of programme OT1_dfarrah_1. Column 8: Herschel observation ID.
2.2 AGN fraction and stellar masses
We proceed to characterise the AGN power of the galaxies in our sample, based on the estimated galaxy properties from the previous subsection. Firstly, we calculated the bolometric luminosity of the galaxies between 8–1000 m, the so-called IR luminosity (Sanders & Mirabel, 1996), which are listed in Table 1. To accomplish this, we used the expression from Veilleux et al. (2009), based on the average value for local ULIRGs (Kim & Sanders, 1998). Then, we calculated the so-called AGN fraction, which is the fractional contribution of the AGN to the total bolometric luminosity, i.e.
| (1) | |||||
| (2) |
where and are the AGN and starburst contributions to the total luminosity of a given galaxy, respectively. Veilleux et al. (2009) showed that the rest-frame 15 to 30 m continuum ratio was correlated with the PAH-free, silicate-free mid-IR (MIR)/FIR ratio and the AGN contribution to the bolometric luminosity more than any other Spitzer-derived continuum ratio they explored; we adopt the prescription based on this finding, which is referred as Method #6 in their work. Basically, it consists in adopting and 1.35 as zero points for pure AGN and pure starburst ULIRGs, respectively (entries in Table 9 from Veilleux et al. 2009). Then, using the bolometric corrections from Table 10 and the formula given in the notes of Table 11, both from Veilleux et al. (2009); we obtain the bolometric . To apply this procedure, we make used of Spitzer spectra in the range –40 m of the galaxies in our sample, which we obtained from the IRS Enhanced Products catalogue. As none of the rest-frame spectra sampled the continuum at 30 um (except for IRAS 00397–1312), we linearly extrapolated the data we had to estimate a value of the continuum at this wavelength. The absolute uncertainty on values is about % on average. With this estimate and the bolometric luminosity we can compute and using Equations 1 and 2. Furthermore, we measured the depth of the silicate feature at 9.7 m, (Stierwalt et al., 2013). This quantity is a measure of the obscuration in ULIRGs. This depth is estimated as the logarithm of the ratio of the measured flux at 9.7 m relative to the local continuum (i.e., more negative values indicate stronger absorption features). The results of this analysis are shown in Table 2.
| IRAS Name | (%) | Si9.7μm | ||||
|---|---|---|---|---|---|---|
| (1) | (2) | (3) | (4) | (5) | (6) | (7) |
| F00183–7111 | 0.117 | 52 | 13.19 | 12.91 | 12.87 | |
| 00397–1312 | 0.152 | 63 | 12.96 | 12.76 | 12.53 | |
| 07380–2342 | 0.855 | 99 | 13.55 | 13.54 | 11.66 | |
| 12514+1027 | 0.270 | 80 | 12.98 | 12.89 | 12.27 | |
| 14026+4341 | 0.420 | 90 | 13.17 | 13.12 | 12.19 |
-
•
Notes. Column 1: IRAS galaxy name. Column 2: 15-to-30 m flux ratio estimated from the Spitzer spectra. Column3: Percentage AGN contribution to the bolometric luminosity based on the method. Column 4: Bolometric luminosity obtained from the IR luminosity following Veilleux et al. (2009). Column 5: AGN bolometric luminosity obtained from the total bolometric luminosity and the AGN fraction. Column 6: Starburst bolometric luminosity obtained from the total bolometric luminosity and the AGN fraction. Column 7: Depth of the silicate absorption feature at 9.7 m estimated following Stierwalt et al. (2013) using the Spitzer spectral data.
Finally, we made use of photometric measurements as tracers of the stellar mass content in the galaxies. We used HST images obtained from the Mikulski Archive database111https://archive.stsci.edu/ and extracted the central point source from each galaxy, in order to exclude the AGN contribution, before performing the photometry. To do so, we generated theoretical PSFs using Tiny Tim (Krist et al., 2011) and then we subtracted them from the extended sources using GALFIT (Peng et al., 2002). Finally, we ran Source Extractor (Bertin & Arnouts, 1996) on the residual images and estimated Vega magnitudes to make direct comparisons with results from V13. Unfortunately, we found HST imaging data for only four of the five galaxies in our sample: two with H-band (F160W) and two with I-band (F814W). To augment these, we include H-band data for three sources from the 2MASS data archive, which were not PSF subtracted. The 2MASS magnitudes at least provide strict upper limits on the stellar mass. The errors in the HST photometry are mag, incorporating both the PSF subtraction and photometry errors. The results of this procedure are presented in Table 3.
| IRAS Name | ||||
|---|---|---|---|---|
| (1) | (2) | (3) | (4) | (5) |
| F00183–7111 | - | - | ||
| 00397–1312 | - | - | ||
| 07380–2342 | ||||
| 12514+1027 | ||||
| 14026+4341 | - | - |
-
•
Notes. Column 1: IRAS galaxy names. Column 2: PSF-subtracted apparent magnitude in the HST F160W band. Column 3: PSF-subtracted apparent magnitude in the HST F814W band. Column 4: Absolute magnitude in the HST F160W band. Column 5: Absolute magnitude in the HST F814W band.
-
a
H-band magnitudes without performing PSF subtraction taken from the 2MASS data archive.
3 Observations, Data Reduction and Spectral Analysis
3.1 Observations
The HLIRG observations were carried out with the Photodetecting Array Camera and Spectrometer (PACS; Poglitsch et al., 2010) installed on Herschel (Pilbratt et al., 2010). Four galaxies were observed as part of programme OT2_fbauer_1, while the fifth object (IRAS 00397–1312) of our sample was previously observed also with Herschel/PACS as part of programme OT1_dfarrah_1. We used PACS in the range scan spectroscopy mode with high-sampling, centered on the redshifted OH 119 m 18OH 120 m complex with a velocity range of km s-1 (rest-frame 118–121 m), which is needed to provide enough spectral coverage on both sides of the OH complex for reliable continuum assessment. The resolution for our targets was km s-1, which allowed us to detect outflow velocities up to 1000–2000 kms-1.
3.2 Data reduction
The reduction procedure was identical to the one performed in Sturm et al. (2011) and V13. A standard PACS reduction and calibration was applied using the pipeline ipipe from HIPE 6.0. The spectra were normalised to the telescope flux and then recalibrated with previous Neptune observations during Herschel’s performance verification phase. Although the sources were not point-source corrected, this fact would not change the spectral shape of the sources. In all that follows, we only use the central spatial pixel alone due to its better S/N. For two objects in the sample (12514+1027 and 14026+4341) we obtained two separate observations. Therefore we co-added them after confirming that they were consistent with each other. To combine them, we averaged the two observations as both exposure times were basically the same. After doing so, we analysed only the combined spectra.
3.3 Spectral analysis
Our analysis is analogous to the one performed by V13 on their ULIRGs+QSOs sample, which we describe briefly. The reduced Herschel spectra were smoothed using a Gaussian kernel with m to reduce the noise before analysing them. Then we fitted the base continuum level with a simple zero–order polynomial and divided the spectra by their continuum, in order to analyse the significance of the OH detection. When there was obvious curvature or a non-zero slope in the continuum component, we fitted a spline function instead. To characterise the OH 119.233, 119.441 m doublet, we used two velocity components (a total of four Gaussians for the OH doublet). When the fit statistic for a single velocity component model was equal to or better than that of a two-velocity component model, we favored the former. The least-square fits used the Levenberg-Marquardt algorithm to model the observed lines. Each Gaussian component is defined by its amplitude, peak position and standard deviation (FWHM). We kept fixed the separation of the lines to 0.208 m in the rest-frame ( km s-1) and required that the amplitude and the standard deviation be fixed to the same value for each component in the doublet.
We analysed the OH doublet profile by measuring characteristic velocities from our fits, i.e., both velocity components fitted to the OH doublet; (1) (abs), the median velocity of the fitted absorption profile, (2) (abs), the velocity above which 84% of the absorption takes place, (3) (emi), the median velocity of the fitted emission profile, and (emi), the velocity below which 84% of the emission takes place. Also, we included the terminal outflow velocity, , in our analysis, which is obtained from the maximum extent of the blueshifted wing of the 119.233 m profile. The uncertainties on these characteristic velocities measurements are dominated by where we placed the continuum, and therefore we estimated errors by assuming different continuum shapes (spline or polynomial) and their positions. We found errors in of km s-1, in of km s-1 and in of km s-1.
4 Results
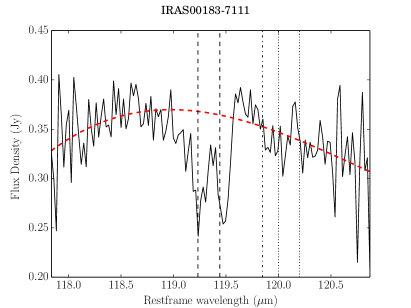
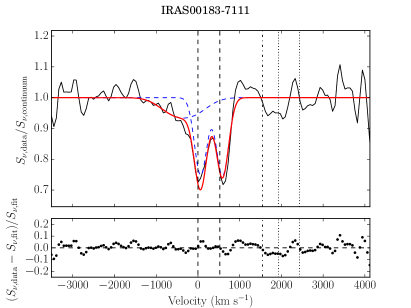
The results of the OH 119 m profile fits are shown in Figures 1–5, while the parameters derived from the spectral analysis are listed in Table 4. The OH doublet was detected in three out of five galaxies: in two galaxies (IRAS F00183-7111 and 12514+1027), the detections were purely in absorption, while in another (IRAS 00397–1312) it is purely in emission. For the two other objects (IRAS 07380–2342 and 14026+4341), we find that the spectra appear to be composed solely of continuum emission, and therefore the OH doublet may be either too weak or simply absent.
4.1 Source by source analysis
4.1.1 IRAS F00183-7111
On the left side panel of Figure 1, we show the spectrum before analysing it. We can clearly see the OH doublet feature and probably a weak emission component. From the analysis, the best fit was reached by fitting a spline function to the continuum, which is denoted by a dashed red line. The right panel shows the spectrum after being smoothed and divided by the fitted continuum. This allows us to distinguish that there is a significant blueshifted wing beyond the instrumental Gaussian tail of the strongest absorption component which we interpret as a molecular outflow with a .
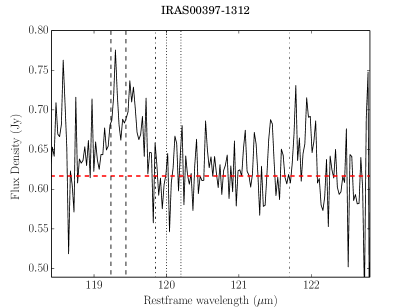
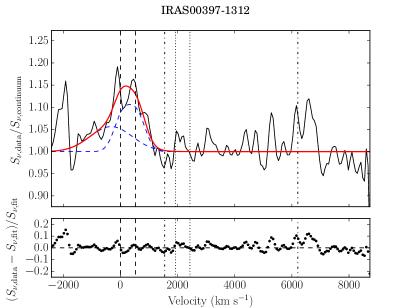
4.1.2 IRAS 00397–1312
The spectrum is shown in Figure 2 where we can recognise the OH doublet in emission and a weaker [NII]121.7 fine-structure line around . In this case, a better fit was found using a flat slope for the continuum. On the right panel, we show the spectrum fitting the OH doublet with two doublets. A second doublet is needed to take into account the blueshifted wing that departs from the primary component. This feature may indicate the presence of an outflow, however without an absorption component we cannot be certain. Furthermore, a possible redshifted [NII] emission line may be present, although the signal-to-noise is too low to characterise it well.
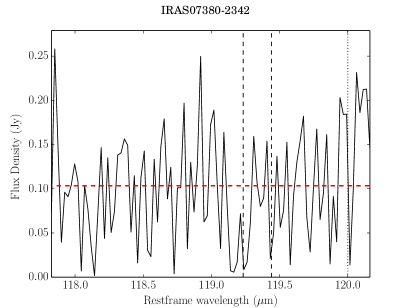
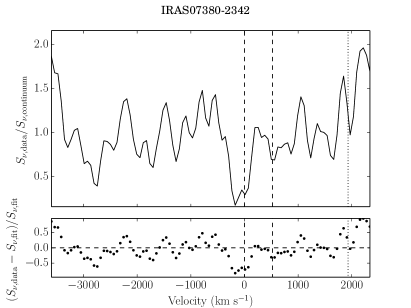
4.1.3 IRAS 07380–2342
The spectrum of this galaxy is shown in the left panel of Figure 3. Although the doublet might be detected marginally in absorption, it is difficult to infer its presence with certainty due to the fact that the spectrum seems to be heavily dominated by the noise. This might be caused by a pointing offset when observing this galaxy, as the brightest pixel of the image is not at the centre.
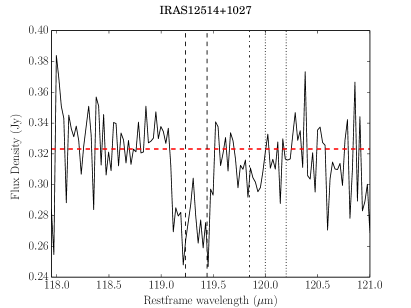
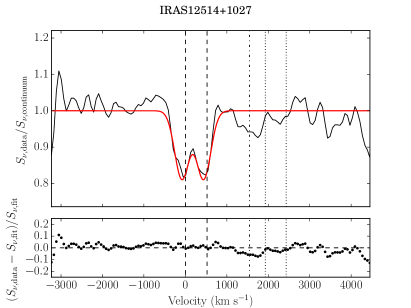
4.1.4 IRAS 12514+1027
On the left panel of Figure 4, we see prominent absorption lines which correspond to the OH doublet and a weaker feature which could indicate the presence of the 18OH 120m doublet. Although we only used a single velocity component to fit the OH 119m doublet, it is possible that a bump at km s-1 is also part of the doublet, implying more complex velocity structure. However, as the main doublet is consistent with the systemic velocity of the galaxy, we cannot confirm a molecular outflow detection from this spectrum (see right panel of Figure 4).
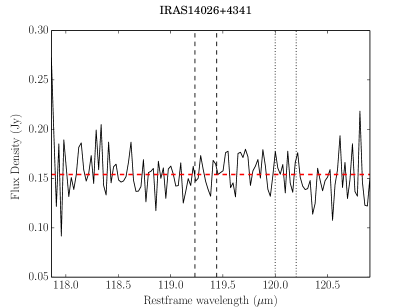
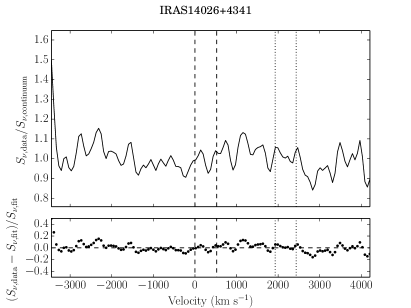
4.1.5 IRAS 14026+4341
In this case the spectrum appears only to be composed of continuum emission and is consistent with a flat model component(see Figure 5).
5 Discussion
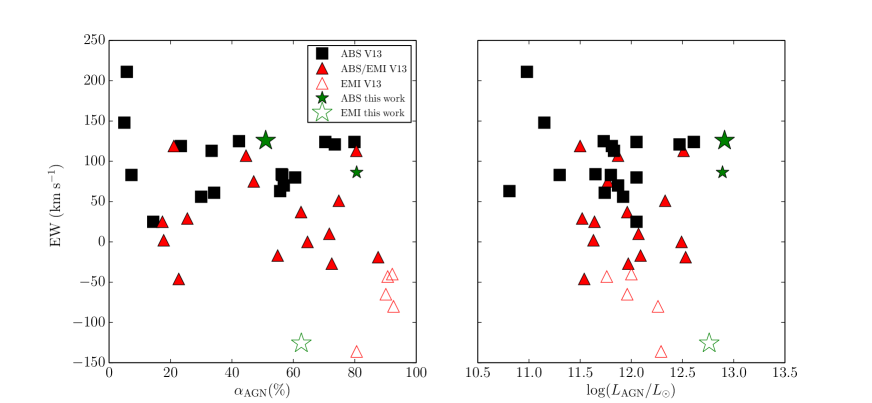
We compared the spectral measurements with derived galaxy properties from Tables 2 and 3 to look for any signs of correlations. We included here the data from V13 (shown as black squares and red triangles), who performed an analogous procedure in a larger ULIRG sample. In this analysis we included the three HLIRGs with OH detections, however we have to keep in mind that only one source has signatures of having a molecular outflow. To highlight this fact, this galaxy is shown as a big green filled star in Figures 6–9.
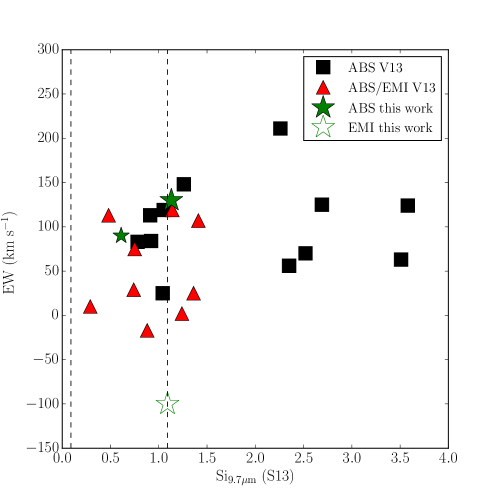
Figure 6 shows a general lack of correlation between the equivalent width of the OH feature and AGN fraction or AGN luminosity found by V13. Furthermore, we see our data points do not change this result. We have also studied the relation between the OH equivalent width and the obscuration of the systems using Si9.7μm. This comparison is shown in Figure 7, which plots the sources from V13 and this work data. The HLIRGs in our sample are not very obscured and do not have strong OH absorption, which principle supports the correlation found by V13 that more obscured objects present a stronger OH absorption. Also, objects without OH detection (shown as black dashed lines) seem to support this idea.
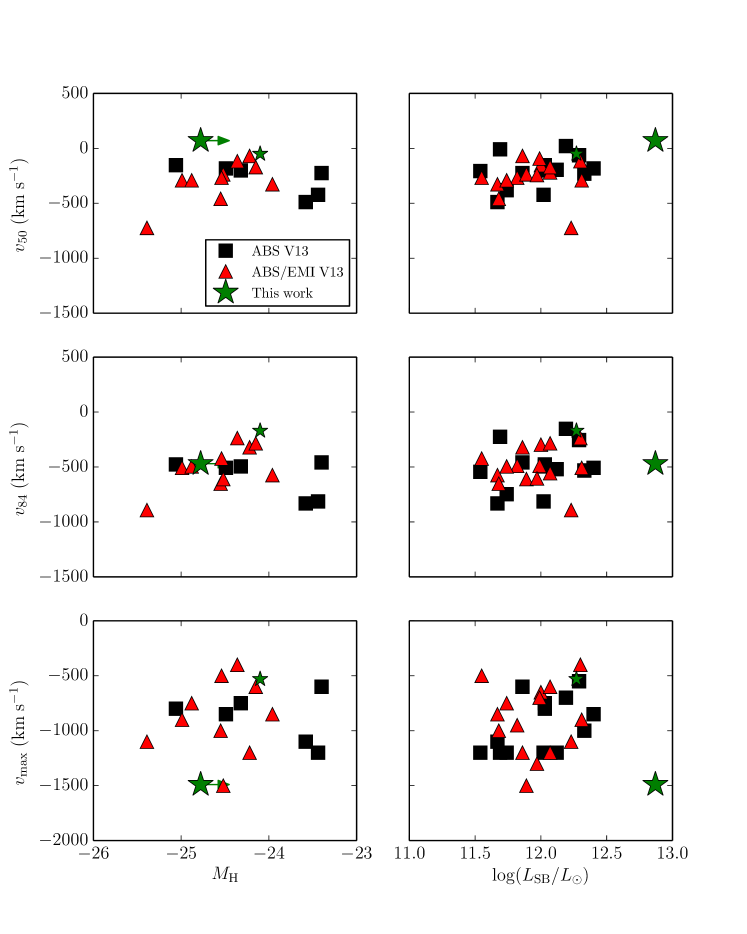
In Figure 8, we present the characteristic velocities measured from the absorption profiles of F00183–7111 and 12514+1027 as a function of H-band absolute magnitudes (left panel) and starburst luminosities (right panel). The results are largely consistent with those of V13 on ULIRGs and QSOs: there does not appear to be any strong relation between the molecular outflow velocities and the stellar masses of the hosts or the starburst luminosities (i.e., SFRs). We do note that exhibits the smallest dispersion among the velocity measures, and there is a hint of an upward trend between and SFR, which the addition of IRAS F00183-7111 appears to dramatically extend. However, it is important to stress that the V13 data do not cover a wide range of SFRs or stellar masses and, unfortunately, our new data do not extend these ranges either. Therefore, one should be cautious when interpreting the lack of obvious correlation between the velocities and SFRs or stellar masses.
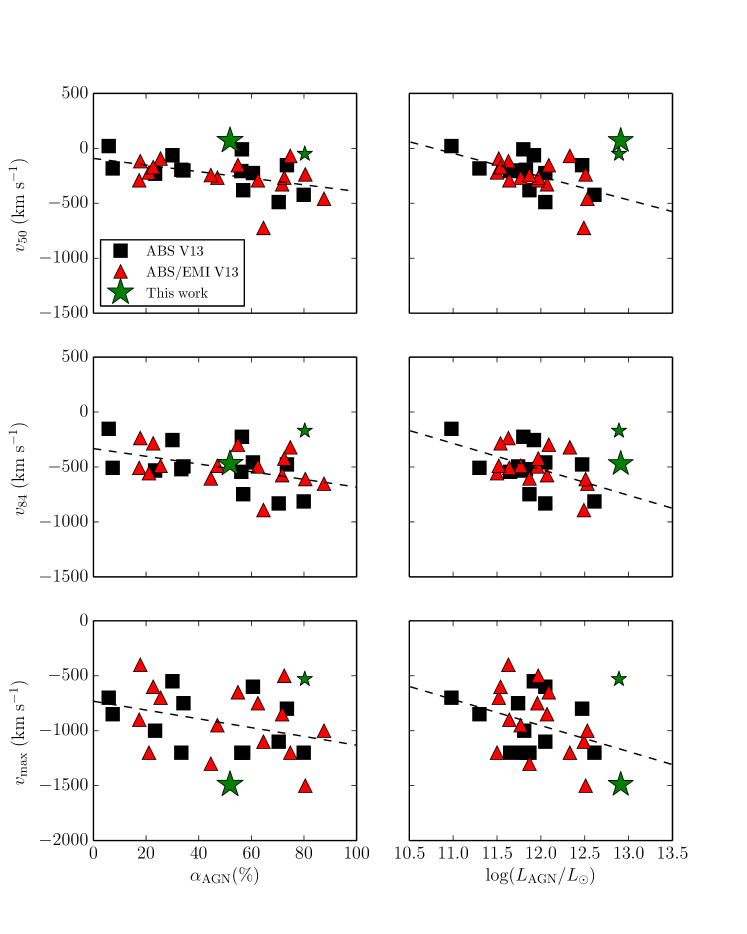
In the left panel of Figure 9 we observe that the characteristic velocities of F00183–7111 roughly follow the same correlation with AGN fraction as found among ULIRGs, further suggesting that AGN activity plays a role in driving this outflow. When considering AGN luminosities: in the right panel of Figure 9, the outflow velocities of F00183–7111 seem to be consistent within the dispersion with the correlation between outflow velocity and AGN luminosity found by V13, except in the case of where F00183–7111 lies beyond the dispersion of the fit.
The fact that OH is observed in emission for IRAS 00397–1312 could indicate it is beginning to shed its dusty cocoon. However, for the galaxy is only %, whereas the V13 objects seen with OH purely in emission all had %, which is more consistent with the evolutionary scenario in which the AGN becomes more apparent once the merger remnant has cast off of its natal cocoon and the signatures of AGN feedback are predicted to wane (e.g. Narayanan et al., 2008; Hopkins et al., 2009).
Before jumping to conclusions, one has to remember that scatter in the measured outflow velocities is expected for several reasons: the measured outflow velocities may be underestimated due to projection effects, which depend on the exact geometry of each outflow; the kinematics of the outflowing material depend on several largely unconstrained variables (e.g., gas mass fraction and density, column density, dust content of individual cloudlets) associated with the complex multi-phase nature of the entrained ISM and the exact acceleration mechanisms (e.g., radiation pressure, ram pressure, shocks); we are measuring time-averaged quantities which may not be exactly in phase: the AGN luminosity is derived from mid-infrared measurements on kpc scales while the outflow velocities are from far-infrared measurements on scales of a few hundreds of parsecs (corresponding to a few 106 yrs for outflow speeds of a few hundred of km s-1). Consequently, one cannot draw any firm conclusions based on only two HLIRGs. A larger sample of HLIRGs will be needed for a more meaningful comparison with ULIRGs and QSOs.
| IRAS Name | (abs) | (abs) | (abs) | EWabs | (emi) | (emi) | EWemi |
|---|---|---|---|---|---|---|---|
| (1) | (2) | (3) | (4) | (5) | (6) | (7) | (8) |
| F00183–7111 | - | - | - | ||||
| 00397–1312 | - | - | - | - | |||
| 07380–2342 | - | - | - | - | - | ||
| 12514+1027 | - | - | - | ||||
| 14026+4341 | - | - | - | - | - |
-
•
Notes. Velocities and EWs are in units of km s-1. Column 1: IRAS galaxy names. Column 2: Median velocity of the absorption profile model fitted. Column 3: Velocity above which 84% of the absorption takes place. Column 4: Maximum extent of the blueshifted wing of the absorption profile. Column 5: Equivalent width for the absorption components. Column 6: Median velocity of the emission profile model fitted. Column 7: Velocity below which 84% of the emission takes place. Column 8: Equivalent width for the emission components.
-
a
The limits appeared in absorption and emission, such that we can only constrain the absolute value of the EW in the spectra with no detection of the OH doublet.
6 Conclusions
We have analysed the Herschel/PACS spectrum of five HLIRGs, using the OH119 m doublet to search for molecular outflows. The OH doublet was detected in three out of five galaxies, from which one was purely in emission and two purely in absorption. Although it is possible that the OH detection in emission may indicate the presence of an outflow, the lack of a clear absorption component in the doublet does not allow us to conclude it with certainty. On the other hand, out of the two systems with OH detections in absorption only IRAS F00183–7111 seems to have a molecular outflow. The most blueshifted wing of its OH profile reached about 1500 km s-1.
Our analysis supports the lack of correlation between the OH equivalent width and both AGN fraction and luminosity reported by V13. Furthermore, it agrees very well with the correlation between the OH equivalent width and the system obscuration also found by V13. The characteristic velocities of the outflow detected in IRAS F00183–7111 are in general agreement with previously studied correlations found in studies of local ULIRGs, specifically V13 and Spoon et al. (2013). This fact supports the idea that outflows are not related either to starburst activity or stellar mass. Instead, they support the notion that AGNs are responsible for driving the powerful outflows seen in many ULIRGs/HLIRGs.
A larger sample of HLIRGs is clearly needed to explore these phenomena in more detail. We note that the WISE all-sky catalog is already discovering large numbers of new HLIRGs (e.g. Eisenhardt et al., 2012; Tsai et al., 2013; Toba et al., 2015). Some fraction of these may lie at suitable redshifts whereby ground-based submillimeter facilities such as ALMA can probe any potential molecular outflows from them. Otherwise, progress may have to wait for a still to be defined future far-infrared space observatory.
Acknowledgments
We thank the anonymous referee for very useful comments and suggestion to improve this work. We acknowledge support from CONICYT-Chile grants, Basal-CATA PFB-06/2007 (DC, FEB, SS), FONDECYT 1141218 (FEB), PCCI 130074 (FEB), ALMA-CONICYT 31100004 (FEB), Gemini-CONICYT 32120003 (FEB), “EMBIGGEN” Anillo ACT1101 (DC, FEB), the Ministry of Economy, Development, Tourism’s Millennium Science Initiative through grant IC120009 awarded to The Millennium Institute of Astrophysics, MAS (FEB, SS), CONICYT-Chile through PCHA/Doctorado Nacional (2015-21151574) (DC), and by NASA through Herschel contracts 1427277 and 1454738 (SV). Optical observations were obtained with the Magellan/Baade as part of the program CN–2015A–129.
References
- Assef et al. (2015) Assef, R. J., Eisenhardt, P. R. M., Stern, D., et al. 2015, ApJ, 804, 27
- Bertin & Arnouts (1996) Bertin, E. & Arnouts, S. 1996, A&AS, 117, 393
- Benson et al. (2003) Benson, A. J., Bower, R. G., Frenk, C. S. et al. 2003, ApJ, 599, 38
- Bower et al. (2006) Bower, R. G., Benson, A. J., Malbon, R., et al. 2006, MNRAS, 370, 645
- Buchner et al. (2015) Buchner, J., Georgakakis, A., Nandra, K., et al. 2015, ApJ, 802, 89
- Casey et al. (2014) Casey, C. M., Narayanan, D., & Cooray, A. 2014, Phys. Rep., 541, 45
- Chartas et al. (2007) Chartas, G., Brandt, W. N., Gallagher, S. C et al. 2007, AJ, 133, 1849
- Chartas et al. (2009) Chartas, G., Kochanek, C. S., Dai, X. et al. 2009, ApJ, 693, 174
- Côté et al. (2009) Côté, P. and Piatek, S. and Ferrarese, L. et al. 2006, ApJ, 165, 57
- Croton et al. (2006) Croton, D. J., Springel, V., White, S. D. M. et al. 2006, MNRAS, 365, 11
- Di Matteo et al. (2005) Di Matteo, T., Springel, V. & Hernquist, L. 2005, Nature, 433, 604
- Eisenhardt et al. (2012) Eisenhardt, P. R. M., Wu, J., Tsai, C.-W., et al. 2012, ApJ, 755, 173
- Fabian (2012) Fabian, A. C. 2012, ARA&A, 50, 455
- Feruglio et al. (2010) Feruglio, C., Maiolino, R., Piconcelli, E. et al. 2010, A&A, 518, L155
- Ferrarese & Merritt (2000) Ferrarese, L., & Merritt, D. 2000, ApJ, 539, L9
- Ferrarese et al. (2006) Ferrarese, L., Côté, P., Dalla Bontà, E. et al. 2006, ApJ, 644, 21
- Fischer et al. (2010) Fischer, J., Sturm, E., González-Alfonso, E. et al. 2010, A&A, 518, L41
- Gaspari et al. (2012) Gaspari, M., Ruszkowski, M., & Sharma, P. 2012, ApJ, 746, 94
- Gebhardt et al. (2000) Gebhardt, K., Bender, R., Bower, G., et al. 2000, ApJ, 539, L13
- Genzel et al. (2014) Genzel, R., Förster Schreiber, N. M., Rosario, D., et al. 2014, ApJ, 796, 7
- González-Alfonso et al. (2014) González-Alfonso, E., Fischer, J., Graciá-Carpio, J., et al. 2014, A&A, 561, A27
- Hopkins et al. (2009) Hopkins, P. F., Murray, N. & Thompson, T. A. 2009, MNRAS, 398, 303
- Kim & Sanders (1998) Kim, D.-C., & Sanders, D. B. 1998, ApJS, 119, 41
- Kraemer et al. (2009) Kraemer, S. B., Trippe, M. L., Crenshaw, D. M. et al. 2009, ApJ, 698, 106
- Krist et al. (2011) Krist, J. E., Hook, R. N. & Stoehr, F. 2011, Proc. SPIE vol. 8127, 81270J-1
- Krongold et al. (2007) Krongold, Y., Nicastro, F., Elvis, M. et al. 2007, ApJ, 659, 1022
- Madau & Dickinson (2014) Madau, P., & Dickinson, M. 2014, ARA&A, 52, 415
- Magnelli et al. (2011) Magnelli, B., Elbaz, D., Chary, R. R., et al. 2011, A&A, 528, A35
- Magnelli et al. (2013) Magnelli, B., Popesso, P., Berta, S., et al. 2013, A&A, 553, A132
- Merloni et al. (2004) Merloni, A., Rudnick, G. & Di Matteo, T. 2004, MNRAS, 354, L37
- Murray et al. (2005) Murray, N., Quataert, E., & Thompson, T. A. 2005, ApJ, 618, 569
- Narayanan et al. (2008) Narayanan, D., Cox, T. J., Kelly, B., et al. 2008, ApJS, 176, 331
- Peng et al. (2002) Peng, C. Y., Ho, L. C., Impey, C. D., & Rix, H.-W. 2002, AJ, 124, 266
- Pilbratt et al. (2010) Pilbratt, G. L., Riedinger, J. R., Passvogel, T. et al. 2010, A&A, 518, L1
- Poglitsch et al. (2010) Poglitsch, A., Waelkens, C., Geis, N. et al. 2010, A&A, 518, L2
- Reeves et al. (2003) Reeves, J. N., O’Brien, P. T., Ward, M. J. 2003, ApJ, 593, 65
- Reeves et al. (2014) Reeves, J. N., Braito, V., Gofford, J. et al. 2014, ApJ, 780, 45
- Ruiz et al. (2007) Ruiz, A., Carrera, F. J. & Panessa, F. 2007, A&A, 471, 775
- Rupke & Veilleux (2011) Rupke, D. S. N. & Veilleux, S. 2011, ApJ, 729, L27
- Rupke & Veilleux (2013a) Rupke, D. S. N. & Veilleux, S. 2013a, ApJ, 768, 75
- Rupke & Veilleux (2013b) Rupke, D. S. N. & Veilleux, S. 2013b, ApJL, 775, L15
- Rupke et al. (2005c) Rupke, D. S., Veilleux, S., & Sanders, D. B. 2005c, ApJ, 632, 751
- Sanders et al. (1988) Sanders, D. B., Soifer, B. T., Elias, J. H. et al. 1988, ApJ, 325, 74
- Sanders & Mirabel (1996) Sanders, D. B., & Mirabel, I. F. 1996, ARA&A, 34, 749
- Saunders et al. (2000) Saunders, W., Sutherland, W. J., Maddox, S. J. et al. 2000, MNRAS, 317, 55
- Spoon & Holt (2009) Spoon, H. W. W., & Holt, J. 2009, ApJ, 702, L42
- Spoon et al. (2009) Spoon, H. W. W., Armus, L., Marshall, J. A., et al. 2009, ApJ, 693, 1223
- Spoon et al. (2013) Spoon, H. W. W., Farrah, D., et al. 2013, ApJ, 7725, 127
- Stierwalt et al. (2013) Stierwalt, S., Armus, L., Surace, J. A., et al. 2013, ApJS, 206, 1
- Sturm et al. (2011) Sturm, E., González-Alfonso, E., Veilleux, S. et al. 2011, ApJL, 733, L16
- Toba et al. (2015) Toba, Y., Nagao, T., Strauss, M. A., et al. 2015, arXiv:1506.00320
- Tsai et al. (2013) Tsai, C.-W., Eisenhardt, P., Wu, J., et al. 2013, Galaxy Mergers in an Evolving Universe, 477, 247
- Tsai et al. (2015) Tsai, C.-W., Eisenhardt, P. R. M., Wu, J. et al. 2015, ApJ, 805, 90
- Veilleux et al. (2005) Veilleux, S., Cecil, G., & Bland-Hawthorn, J. 2005, ARA&A, 43, 769
- Veilleux et al. (2009) Veilleux, S., Rupke, D. S. N., Kim, D.-C. et al. 2009, ApJS, 182, 628
- Veilleux et al. (2013) Veilleux, S., Meléndez, M, Sturm, E. et al. 2013, ApJ, 776, 27 [V13]
Appendix A Redshift measurements
Given that systemic velocities are very important in the context of this work, we carried out spectroscopic observations for two galaxies in our sample: IRAS F00183-7111 and IRAS 12514+1027; in order to independently assess the accuracy of their redshifts. The spectra were measured using the Inamori Magellan Areal Camera Spectrograph (IMACS) on the Magellan I Baade 6.5m telescope at Las Campanas Observatory. We obtained two exposures of 300 seconds for each object. The data reduction was performed using IRAF following standard procedures. The spectra presented prominent features in emission that allowed us to estimate its radial velocity easily (see Figure 10 and 11). To this end, we used the task emsao from the package rvsao to identify the redshifted emission lines and then to compute a radial velocity value. The measured redshifts and their associated errors are presented in Table 1. The errors account for the wavelength calibration solution, the aperture trace and the emsao algorithm uncertainties

