Far-UV Emission Properties of FR 1 Radio Galaxies 111Based on observations made with the NASA/ESA Hubble Space Telescope, obtained from the data archive at the Space Telescope Science Institute. STScI is operated by the Association of Universities for Research in Astronomy, Inc. under NASA contract NAS5-26555.
Abstract
The power mechanism and accretion geometry for low-power FR 1 radio galaxies is poorly understood in comparison to Seyfert galaxies and QSOs. In this paper we use the diagnostic power of the Ly recombination line observed using the Cosmic Origins Spectrograph (COS) aboard the Hubble Space Telescope (HST) to investigate the accretion flows in three well-known, nearby FR 1s: M 87, NGC 4696, and Hydra A. The Ly emission line’s luminosity, velocity structure and the limited knowledge of its spatial extent provided by COS are used to assess conditions within a few parsecs of the super-massive black hole (SMBH) in these radio-mode AGN. We observe strong Ly emission in all three objects with similar total luminosity to that seen in BL Lacertae objects. M 87 shows a complicated emission line profile in Ly which varies spatially across the COS aperture and possibly temporally over several epochs of observation. In both NGC 4696 and M 87, the Ly luminosities ergs s-1 are closely consistent with the observed strength of the ionizing continuum in Case B recombination theory and with the assumption of near unity covering factor. It is possible that the Ly emitting clouds are ionized largely by beamed radiation associated with the jets. Long-slit UV spectroscopy can be used to test this hypothesis. Hydra A and the several BL Lac objects studied in this and previous papers have Ly luminosities larger than M 87 but their extrapolated, non-thermal continua are so luminous that they over-predict the observed strength of Ly, a clear indicator of relativistic beaming in our direction. Given their substantial space density ( Mpc-3) the unbeamed Lyman continuum radiation of FR 1s may make a substantial minority contribution (%) to the local UV background if all FR 1s are similar to M 87 in ionizing flux level.
Subject headings:
BL Lacertae objects: individual (1ES 1028511, PMN J11032329), galaxies: active, galaxies: individual (M 87, NGC 4696, Hydra A), quasars: emission lines, galaxies: nuclei, ultraviolet: galaxies1. Introduction
Low power Fanaroff-Riley (1974) class 1 (FR 1) radio galaxies (; Ledlow & Owen, 1996) are among the most numerous AGN, comparable in space density to the better-known (and far better-understood) Seyfert galaxies (Mauch & Sadler, 2007; Owen et al., 1996; Ho & Ulvestad, 2001). M 87 with its famous synchrotron jet is the FR 1 class prototype with other local examples including Centaurus A, NGC 4696 (the brightest galaxy in the Centaurus Cluster), and Hydra A. But where Seyfert galaxies exhibit luminous accretion disk emission and broad-line-region (BLR) emission lines, these two emission mechanisms are mostly or entirely absent in FR 1s, making their power source more mysterious. Adding to this mystery is the presence of FR 1 low-power sources in most brightest cluster galaxies (BCGs), including the morphologically-distinct “cD” galaxies (Lauer et al., 2014). For example, 70% of BCGs in clusters with a “cool X-ray core” have FR 1 radio sources with W Hz-1 (Burns, 1990); (see also Ledlow & Owen, 1996; Stocke, Perlman, Gioia et al., 1999; Perlman et al., 2003; Branchesi et al., 2006; Wing & Blanton, 2011); i.e., FR 1s are commonly found in clusters and rich groups of galaxies and often, but not exclusively in the BCG (Ledlow & Owen, 1995, 1996).
These BCGs are the most luminous, most massive galaxies in the Universe. Given the observed correlation between the supermassive black hole (SMBH) mass and the bulge mass or bulge velocity dispersion (Kormendy & Ho, 2013), these galaxies should also possess the most massive SMBHs. Indeed, local FR 1 galaxies host some of the most massive SMBHs known: e.g., M 87 (; Walsh et al., 2013) and two rich cluster BCGs ( and ; listed in Kormendy & Ho, 2013). However these most massive SMBHs power very low-luminosity AGN in comparison to many found in lower-mass, lower-luminosity ellipticals and early-type spirals. Apparently these sources either have little fuel available or do not reprocess gravitational energy as effectively into X-rays, relativistic particles, and radio emission as many AGN in less-luminous galaxies. It is possible that these sources do extract enormous amounts of energy from these most-massive black holes but that most of this energy is converted into the kinetic energy of a bulk outflow whose effect is visible as giant cavities in the surrounding X-ray emitting gas (e.g., McNamara & Nulsen, 2007; Fabian et al., 2011). Alternatively, it is possible that for some reason the sub-parsec structures near the SMBH prevent these sources from being as luminous as AGN in spirals (i.e., Seyferts and QSOs) and even those in lower luminosity ellipticals (i.e., FR 2 radio galaxies and quasars).
Theoretical modeling of FR 1s (sometimes called the AGN “radio mode”; Croton et al., 2006) rely on a “radiatively inefficient accretion flow” (RIAF, or its several variants: Narayan & Yi, 1994, 1995; Blandford & Begelman, 1999; Quataert & Gruzinov, 2000; Hawley & Balbus, 2002), but its parameters are much more poorly quantified than for luminous accretion disk AGN. For example, Allen et al. (2006, A06 hereafter) found a strong correlation between the Bondi accretion rate (the hot gas mass available at or near the Bondi radius) and the observed jet power in FR 1s. While A06 use this result to suggest that Bondi accretion is a good model for an RIAF, they also derive a very high efficiency (2%) for converting the energy of the gas accretion into relativistic jet power, requiring a very efficient accretion flow from the Bondi radius ( parsecs) all the way into the SMBH. Detailed models of this process (e.g., Narayan & Yi, 1995; Blandford & Begelman, 1999) infer that such efficient accretion is quite unlikely and that in many circumstances a thin accretion disk and an outflowing wind can be formed as in the “ADIOS” (advection-dominated inflow-outflow solution) model of Blandford & Begelman (1999). For example, Begelman & Celotti (2004) argue for the “ADIOS” scenario in which the presence of an “outer accretion disk” and an outflowing disk wind will reduce the accretion flow by two orders of magnitude.
Observationally, deep Chandra imaging of the FR 1 prototype M 87 derived an accretion rate comparable to the expected Bondi rate of 0.1 yr-1 (Di Matteo et al., 2003) outside the Bondi radius ( pc). However, more recent X-ray imaging spectroscopy work by Russell et al. (2015) finds an accretion flow greatly reduced below the Bondi rate inside the Bondi radius of M 87.
Detailed fitting of the spectral energy distribution (SED) within 30 pc of the nucleus of M87 by Prieto et al. (2016) finds an SED dominated by jet emission throughout the electromagnetic spectrum excepting a small contribution from a cool accretion disk longward of m. This corroborates earlier work by Perlman et al. (2001, 2007). Based on the weak, cool disk detected in the IR, Prieto et al. (2016) derive a very low accretion rate of yr-1 from the small, cool accretion disk they derive to be present from the SED. This same broadband SED was also used by Broderick et al. (2015) to place similar constraints on the accretion rate and on the presence of an event horizon. Prieto et al. (2016) also derive a similarly low accretion rate from the previous HST imaging data on the H emission line in the ionized gas disk discovered by Ford et al. (1994). The absence of significant Faraday rotation for the M 87 nuclear source at sub-mm wavelengths is also consistent with a very low accretion rate (Kuo et al., 2014). Clearly these observational and theoretical results cause problems for the simple Bondi rate model of A06, suggesting that a more complex nuclear geometry than a spherically symmetric, hot gaseous atmosphere is necessary in M 87 and other similar sources.
| Galaxy | RA (J2000) Dec | Galactic | HST | Obs. | ||
|---|---|---|---|---|---|---|
| Program | (ksec) | Date | ||||
| FR 1 Galaxies | ||||||
| M 87 | 12 30 49.4 12 23 27 | 0.0044 | 0.020 | 13489 | 4.4 | 2014, Mar 3 |
| NGC 4696 | 12 48 49.2 41 18 39 | 0.00987 | 0.098 | 13489 | 5.2 | 2013, Dec 20 |
| Hydra A | 09 18 05.7 12 05 44 | 0.05488 | 0.036 | 13489 | 4.7 | 2013, Nov 6 |
| BL Lac Objects | ||||||
| 1ES 1028511 | 10 31 18.5 50 53 36 | 0.3604 | 0.012 | 12025 | 22,33 | 2011, May 1 |
| PMN J11032329 | 11 03 37.6 23 29 30 | 0.186 | 0.078 | 12025 | 18,13 | 2011, Jul 5 |
Because an accretion disk and wind can create the physical conditions necessary for a broad-line-region (BLR) at sub-parsec scales, Ly and other UV emission lines can provide a method for probing the accretion region in FR 1s much closer to the black hole than can X-ray continuum observations (i.e., 2–30 pc in nearby FR 1s). Observations using the full spatial resolution of HST (0025 in the UV) are capable of resolving line and continuum emission at the level of 2 pc in M 87, 4.5 pc in NGC 4696 and 30 pc in Hydra A. Well-sampled optical imaging of M 87 in H (Ford et al., 1994) and imaging spectroscopy in [O II] (Macchetto et al., 1997) and H (Walsh et al., 2013) with the Space Telescope Imaging Spectrograph (STIS) yield detections of this disk to within 6 pc of the SMBH. UV spectroscopy can do a bit better than this so the detection of Ly through the 0.”26 FOS aperture by Sankrit, Sembach & Canizares (1999) provides a probe of ionized gas close to the nucleus as well ( pc). The detection of Ly emission in M 87 and other FR 1s verifies the presence of cooler gas in the RIAF and its observed line-width and shape can determine some specifics about the accretion; e.g., the minimum mass that has “dropped out” of a hot accretion flow. Also, the mere presence of small amounts of cool gas inside the Bondi radius supports models of a much more inefficient RIAF than originally suggested (Blandford & Begelman, 1999; Begelman & Celotti, 2004; Sikora & Begelman, 2013), consistent with the new X-ray analysis of Russell et al. (2015) and the SED analysis of Prieto et al. (2016). Weak emission line wings also are expected in some models (Sikora & Begelman, 2013) as well as weak, highly-ionized absorption suggestive of an outflowing wind (an “ADIOS”).
Weak optical emission lines have been observed in some FR 1s (e.g., Ledlow & Owen, 1995; Ho et al., 1997; Ho & Peng, 2001), but observed optical line-widths are usually rather narrow ( km s-1) and the ratios are indicative of LINER emission (Ho & Peng, 2001). There is no indication in most cases that much of this emission line gas is participating in the accretion process. Given the dramatic spatial extent of H emission in some of the nearest FR 1s, including M 87 (Ford et al., 1994, 1997) and NGC 4696 (Canning et al., 2011), most of the observed narrow emission line gas is not nuclear at all. However, some few BL Lac objects have been observed to possess broad H lines, including OJ 287 (Sitko & Junkkarinen, 1985), PKS 0521365 (Ulrich, 1981) and even BL Lac itself (Vermeulen et al., 1995), which is undoubtedly nuclear.
Recently, using the Cosmic Origins Spectrograph (COS) on the Hubble Space Telescope (HST), we discovered weak, and relatively narrow Ly emission lines in three low- BL Lac objects (Stocke, Danforth & Perlman 2011; Paper 1 hereafter). The COS spectra provide Ly emission line luminosities (), line widths ( km s-1) and simultaneous beamed continuum luminosities. These observed Ly line luminosities are orders of magnitude less than those seen in Seyfert Galaxies and are well below the line luminosities required in an ionization-bounded BLR based on the observed non-thermal continuum luminosities in these sources. But we know that the continuum is beamed in BL Lacs and an uncertain beaming factor needs to be applied to estimate the luminosity of the unbeamed continuum to determine whether the cool Ly-emitting gas is ionization-bounded or density-bounded. If the gas surrounding the SMBH in FR 1 AGN is density-bounded (the prediction of RIAF models), the Ly line luminosities provide an order-of-magnitude estimate of the amount of cool gas in the BLR.
In this paper we use far-UV (FUV) spectroscopic observations from HST/COS of three nearby FR 1s: M 87, NGC 4696 and Hydra A and two unpublished BL Lac objects to investigate the relationship between FR 1s and BL Lac objects and to investigate the Ly and continuum luminosities in unbeamed radio galaxies. Ly emission lines consistent with being circum-nuclear in origin are seen in all three FR 1s. Therefore, these emission lines and the unbeamed continua underlying them can be used to probe accretion physics. In Section 2 we present and describe the COS spectroscopy and data modeling techniques for these three FR 1s as well as for two as-yet-unpublished BL Lac objects from observing time provided to the COS Science Team. In Section 3 we describe our findings and derive basic physical parameters from emission models. In Section 4 we discuss the implications of these observations for physical models of the SMBH and circum-nuclear regions of these objects. Finally, in Section 5 we summarize our main results and discuss their importance for AGN physics and cosmology.
2. Observations and Data Analysis
Three FR 1 galaxies (Table 1) were observed as part of HST Guest Observer (GO) program 13489 (PI: Stocke). Each was observed for a nominal two-orbit visit using the COS/G130M grating. Four exposures at different central wavelengths give continuous spectral coverage over the entire G130M range () at a resolution of ( km s-1).
The two BL Lac objects in Table 1 were observed as part of the COS Guaranteed Time Observations (GTO) programs (PI: Green). Like the previous three BL Lacs for which Ly emission was detected by Paper 1, these were observed with both the COS/G130M and G160M gratings giving continuous spectral coverage over Å at a resolution of . Intervening absorption line measurements for these two BL Lacs were published as part of the Danforth et al. (2016) compilation, but AGN continuum and emission-line properties are new to this work.
The data were retrieved from the Mikulski Archive for Space Telescopes (MAST) and reduced via the methods described in Danforth et al. (2010, 2016). Briefly, each exposure was binned by three native pixels or of a point-source resolution element to increase the signal-to-noise before coaddition. The exposures were coaligned in wavelength by cross-correlating strong Galactic absorption features in each exposure and interpolated onto a common wavelength vector and then combined using an exposure-time-weighted algorithm. More details of the COS spectral reduction process can be found in Danforth et al. (2016) and Keeney et al. (2012).
Next, the Galactic Ly profile was fitted to determine the Milky Way which was in turn used to remove foreground reddening (calculated values are given in Table 1). In all three FR 1 cases, the foreground reddening is small. No internal source reddening was assumed for either the FR 1s or the BL Lacs.
3. Results
All three FR 1 galaxies show prominent Ly emission at very close to the systemic redshifts. Both M 87 and Hydra A show weak FUV continuum emission while the continuum level in NGC 4696 is barely detectable in these data. In M 87 the Ly emission line has extensive line wings to both blue- and red-shifted relative velocities. In addition, M 87 shows weak emission at Å, Å, and Å which we identify with N V, C II, and Si IVO IV], respectively. No metal ion emission was seen in either of the other two FR 1s. Both new BL Lac objects (1ES 1028511 and PMN J11032329) show smooth power-law continua with weak Ly emission at approximately the systemic redshifts. We discuss the detailed measurements of each source below.
| Quantity | Blue comp. | Main comp. | Red comp. | Unit |
|---|---|---|---|---|
| H I Ly 1215 Å | ||||
| centroid | Å | |||
| km s-1 | ||||
| FWHM | Å | |||
| km s-1 | ||||
| aaassuming Mpc | ||||
| continuum | ||||
| N V 1238, 1242 Å | ||||
| centroid | km s-1 | |||
| FWHM | Å | |||
| km s-1 | ||||
| doublet ratio | ||||
| continuum | ||||
| C II 1334 Å | ||||
| centroid | km s-1 | |||
| FWHM | Å | |||
| km s-1 | ||||
| continuum | ||||
3.1. M 87
The nucleus of the FR 1 prototype M 87 with its famous optical/radio/X-ray jet has been observed intensely over the last two decades with HST including previous UV and optical spectra obtained with the Faint Object Spectrograph (FOS) by Tsvetanov et al. (1998, 1999) and Sankrit, Sembach & Canizares (1999). These FOS spectra of the nucleus cover approximately the same wavelength range as the COS/G130M data including the Ly emission in M 87 at 1220.8 Å. In both the two Sankrit, Sembach & Canizares (1999) observations and our own, the intrinsic flux and line shape of Ly are difficult to determine due to the presence of the Galactic damped Ly absorption (DLA) as well as probable absorption in M 87. Regardless of the corrections which must be made due to the Galactic DLA and other absorbers in M 87, Sankrit, Sembach & Canizares (1999) find that the Ly emission line possesses a km s-1-wide core and a redshifted tail that extends at least another 800 km s-1 to the red. However, the M 87 absorption has unknown , which makes it difficult to remove in order to determine the intrinsic Ly emission line properties. Absorption has been detected in two narrow components ( and 1330 km s-1) in Ca II H&K and Na I D by Carter & Jenkins (1992) and Carter et al. (1997) and in several other ions (Na I D, Mg I, Mg II, Ca II H&K, Mn II and Fe II) in one broad component ( km s-1) by Tsvetanov et al. (1999) with FOS. The variable absorption velocities reported as well as the partial covering of the source suggested by the Ca II and Na I absorption, which have 1:1 doublet ratios but low optical depths (Carter et al., 1997), are strong indicators that variable absorption exists in the nucleus of M 87, perhaps due to cloud proper motions.
On what is likely a slightly larger scale, HST/FOS off-nuclear optical spectra and HST/Faint Object Camera (FOC) optical imaging discovered an ionized gas disk with Keplerian motion (Ford et al., 1994; Ford & Tsvetanov, 1999) that connects to non-Keplerian blueshifted emission-line filaments primarily to the NW of the nucleus. Ford & Tsvetanov (1999) speculate that the observed nuclear absorption lines found by Tsvetanov et al. (1998) are kinematically related to this filamentary gas since these are blueshifted with respect to the nucleus as well. Macchetto et al. (1997) used the spectroscopic capabilities of the Faint Object Camera (FOC) on HST to determine the rotation curve of the [O II] emitting gas in the nuclear disk which better determined the mass of the SMBH. Relevant to this study, no [O II] forbidden-line emission was found within 007 (5 pc) of the nucleus. Similar long-slit, optical spectra obtained with the Space Telescope Imaging Spectrograph (STIS) were obtained by Walsh et al. (2013) to refine the SMBH mass estimate.
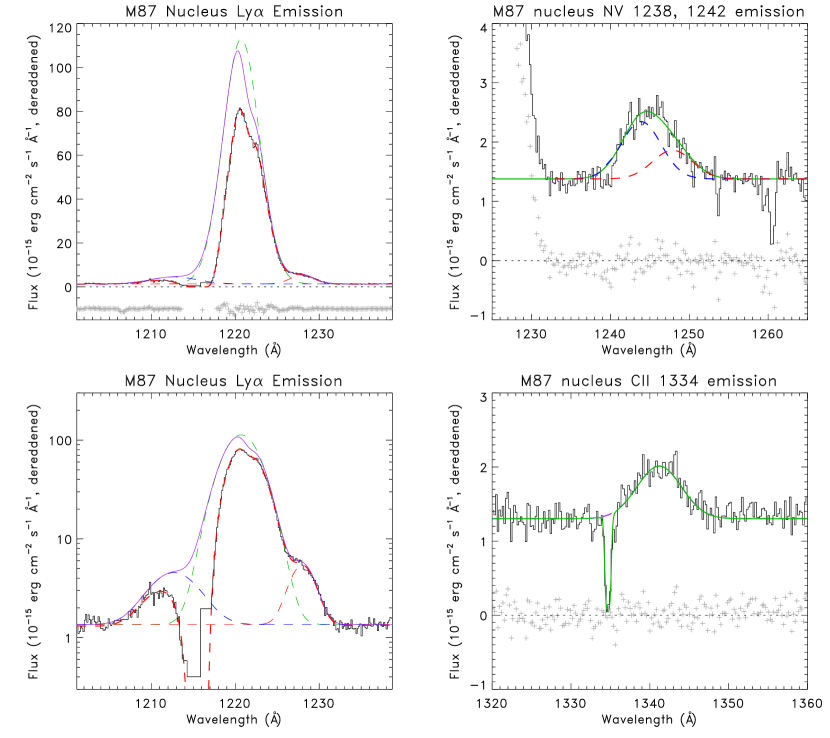
Due to all these potential complications and uncertainties, we elected to deconvolve the emission and absorption components in Ly using an a priori approach. The Ly profile is characterized by a strong emission peak at km s-1 with a dereddened peak amplitude of . This is times brighter than observed with FOS by Sankrit, Sembach & Canizares 1999 on 1997, 23 January, and nearly brighter than on 1997, 18 January (although these new observations are through a larger aperture; 25 with COS compared to 026 with FOS; see Section 3.1.2). Weaker emission can be seen extending over the range Å and thus blended with the Milky Way DLA. The emission line profiles in the three COS spectra shown here, especially the Ly line in M 87, are far too broad to be affected by any spectral smearing caused by the marginal spatial resolution in the COS aperture (see Section 3.4).
We model the Ly emission profile as three emission components (“blue”, “main” and “red”), a damped Galactic Ly absorber at , a weak, broad absorption component to accomodate possible absorption in M 87, and a linear far-UV continuum flux. The detailed flux model includes fifteen fitting parameters (three for each Gaussian emission component, three for the M 87 absorber, two each for the Galactic DLA and the non-thermal continuum of M 87), each allowed to vary around a reasonable range. Despite this complexity, a remarkably robust fit is determined () even when fit parameters are allowed to vary over a broad range of plausible values. Best-fit quantities and fitting uncertainties are given in Table 2 and shown overplotted on the data in the left-hand panels of Figure 1.
Blue and red wings are apparent in the emission profile and these are best fit with two additional Gaussian components with centroids at Å and Å, respectively, modified by the Galactic DLA. If Ly emission, these correspond to km s-1 and km s-1. We note that the blue- and red-wings of the profile cannot be fitted with a single very broad emission component at km s-1; two Gaussian profiles offset from the main, central component by km s-1 are required. Thus, if the blue and red emission are both Ly they are approximately symmetrically-placed around the main Ly line. We interpret the red component as Ly emission redshifted by km s-1 with respect to the main Ly emission in agreement with Sankrit, Sembach & Canizares (1999). The maximum redshifted velocity observed in this broad component is km s-1 relative to the main Ly line.
The blue side emission is possibly either Si III 1206 Å emission at km s-1 or Ly emission blueshifted at km s-1 LSR or km s-1 with respect to the main Ly emission peak. The larger uncertainty in the velocity centroid of this line is due to the presence of the Galactic DLA, making this component’s position and profile very dependent upon the exact assumed DLA column density (see below).
The Si III interpretation is consistent with the velocity and line width of emission seen in C II (see below), albeit with significant uncertainty. However, the velocity centroid of the proposed Si III emission is almost 300 km s-1 greater than the strong Ly emission centroid, casting doubt on this identification. Further, if this emission is Si III, it would be much stronger than what is seen in any other AGN. In a typical Seyfert like Mrk 817 (Winter et al., 2011), a Si III line as luminous as the blue component in M 87 would be visible as an asymmetry in the line profile of Ly. This is not observed. Further, the FUV spectum of the prototypical narrow-line Seyfert 1 galaxy, I Zw 1 has only a reported marginal detection of Si III emission at a level ten times weaker than the feature we observe in M 87. We conclude that this feature is unlikely to be Si III.
If this emission is interpreted as Ly, it has a velocity of km s-1 LSR and a blueshifted velocity of km s-1 relative to the Ly emission peak, making it reasonably symmetrical in both velocity offset and luminosity to the redshifted Ly emission line which is not affected by the Galactic DLA and has been reported previously.
A dip near the peak of the main component of the Ly emission line is well-fit as a very broad Ly absorption line ( km s-1) at km s-1 ( km s-1 relative to the main line centroid). While similar to the broad, low-ion detections seen by Tsvetanov et al. (1999), this absorption component is at a very different heliocentric velocity ( km s-1 relative to the Tsvetanov et al. (1999) detections). This absorption lies on the red side of the Ly peak compared to the blue side absorption seen in the epoch 1997 FOS spectrum.
The Galactic DLA absorption we fit has a derived , quite close to but slightly less than the Galactic value inferred by Sankrit, Sembach & Canizares (1999). This value is also close to but slightly larger than the total found by Di Matteo et al. (2003) from a continuum fit to the X-ray emission at the M 87 nucleus. If we constrain the Galactic DLA to be between the two Sankrit values, our best-fit solution is driven to the minimum value (i.e., ) and the intrinsic main Ly emission component would increase by a factor of 8% in flux. However, the blue emission is much more affected by the Galactic DLA increasing; its line-flux increases by nearly a factor of two and its emission centroid shifts to Å. At nearly 1.5 Å redward of its location in the unconstrained model (Table 2, Figure 1), it is even more unlikely to be Si III 1206Å and much more likely to be a blue-shifted Ly velocity component at km s-1 or km s-1 with respect to the main Ly emission.
3.1.1 Metal ion emission lines
In addition to the strong Ly emission, there are a number of weak emission features in the M 87 spectrum. As discussed above, the emission feature near to a potential Si III in M 87 was fitted concurrently with Ly but is interpreted as blushifted Ly, not Si III. Peaks at Å and Å are consistent with N V doublet and C II emission respectively. Best fit parameters for these lines are given in Table 2.
The C II 1334.5 Å emission line is modeled as a single Gaussian along with a Galactic C II absorption line. The Galactic C II line is fitted with the parameters km s-1, km s-1, .
The N V doublet (, ) was fitted assuming an identical velocity centroid and FWHM parameters for the two lines, but letting the relative line strength vary from the nominal 2:1, optically thin doublet ratio to an optically thick 1:1 ratio.
A low-contrast peak near 1400 Å is consistent with a blended complex of the Si IV , doublet and O IV] Å emission. However, given the low data quality near the edge of the COS/G130M detector and the complicated nature of the required model, no fit was attempted.
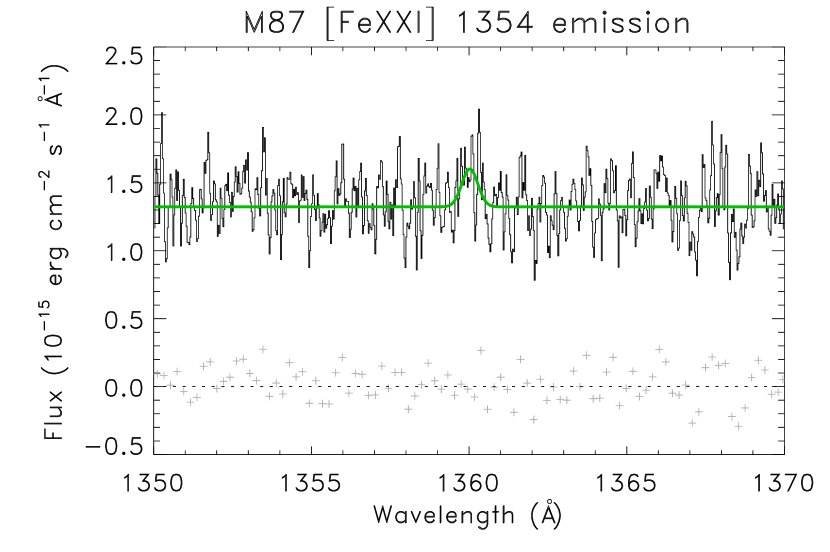
Anderson & Sunyaev (2016) recently reported the tentative detection of [Fe XXI] emission from M 87. A careful examination of the data around Å reanalyzed using the techniques of Danforth et al. (2016) shows a weak () feature consistent with [Fe XXI] emission (Figure 2). We measure erg cm-2 s-1, km s-1, and km s-1. The line flux value quoted here is consistent with the upper limit of ( erg cm-2 s-1) quoted by Anderson & Sunyaev (2016). While their estimate of line-width km s-1 is much higher than we obtain, it is based on a marginal detection. A value of km s-1 is both larger than a thermal width of km s-1 for this species and provides a first estimate of the turbulence of the hot gas close to the SMBH of km s-1(Anderson & Sunyaev, 2016). New exposures of comparable integration time to the values in Table 1 will make a definitive measurement of turbulence in the accretion flow. This will be reported at a later time.
3.1.2 Line and continuum variability
Sankrit, Sembach & Canizares (1999) reported on two epochs of nuclear FOS observations in January 1997 separated by five days in which the UV continuum remained approximately constant while the Ly emission line flux increased by a factor of . However, these authors caution that this apparent variability may be due to a slight displacement of the FOS aperture. Earlier FOS spectra from late 1993 into 1995 reported on by Tsvetanov et al. (1998, 1999) found that the NUV optical continuum (2000-4000Å) was variable by a factor of in 2.5 months, showed smaller variability on a timescale of weeks but no change over a one day period. Multi-epoch NUV imaging compiled by Madrid (2009; 30 epochs) and Perlman et al. (2011; 20 epochs) in more recent years finds % continuum variability over timescales of months to years. Variability at the few percent levels are possible on shorter time periods of 2-4 weeks.
While we can not be definitive about the Ly emission line variability in our observations relative to the FOS observations due to the much larger COS aperture, it is likely that at least some of the factor of 6–10 flux difference is due to intrinsic variability. In subsection 3.4 below we use the limited spatial resolution of the COS spectroscopy to determine that both the nuclear Ly line and the UV continuum are spatially extended by ″. In the STIS spatially-resolved spectroscopy of Macchetto et al. (1997) and Walsh et al. (2013) the observed flux of the optical emission lines is confined primarily to the inner 05. If the spatial extent of Ly is similar, then most of the luminosity of Ly is coming from a region not too much larger than the FOS aperture. While proof of Ly variability awaits future COS spectroscopy for accurate flux comparisons through the same aperture, an order of magnitude increase seems quite extreme, suggesting that at least some of the FOS-COS flux difference is intrinsic variability. If the line variability over long time intervals (months to years) is modest (%), similar to the observed continuum variability, the Ly line flux could be responding to earlier continuum variations (a.k.a. “reverberation”).
However, the red wing seen in the Sankrit, Sembach & Canizares (1999) FOS spectrum and in Figure 1 is the most variable portion of the emission profile and is unaffected both by the Galactic DLA and the reported locations of the absorption in M 87. Therefore, this emission component must possess significant intrinsic variability. The potential variability of the blue wing emission is not yet known until we obtain new epochs of COS FUV spectroscopy. The only constant emission or absorption component in the vicinity of the M 87 Ly emission line is the foreground Galactic absorption.
If the Ly line variability observed in two FOS epochs is intrinsic, a very small upper limit on the size of the Ly emitting region can be set by cm ( Schwarzschild radii for a SMBH; Sankrit, Sembach & Canizares, 1999). But this interpretation is inconsistent both with the rather narrow line width of Ly and with the observed spatial distribution of the emission (see Section 3.4). This is simply closer to the SMBH than can be accommodated by the emission line widths. A model in which the Ly line flux changes due to a change in the amount of cloud mass in the Ly emitting region (i.e., variable accretion in a density-bounded region, as was suggested in Paper 1) is also ruled out since any variability would occur on a timescale over which clouds move in and out of the emitting region at km s-1. This model would suggest variations only on a several year or longer timeframe, not on the short timescales observed. Apparent emission line variability due to variable absorption is a possibility as long as the line variability is modest (few percent level). Again, future FUV spectroscopy with COS can settle the important question of Ly variability through comparison to the spectrum presented here.
| Quantity | Comp. 1 | Comp. 2 | Unit |
|---|---|---|---|
| Ly emission components | |||
| Centroid | Å | ||
| km s-1 | |||
| FWHM | Å | ||
| km s-1 | |||
| aaassuming Mpc | |||
| continuum | |||
| Ly absorption components | |||
| Centroid | km s-1 | ||
| km s-1 | |||
| Quantity | Comp. 1 | Comp. 2 | Unit |
|---|---|---|---|
| centroid | Å | ||
| km s-1 aawith respect to a systemic redshift of | |||
| FWHM | Å | ||
| km s-1 | |||
| bbassuming Mpc | |||
| continuum | |||
| slope |
3.2. NGC 4696
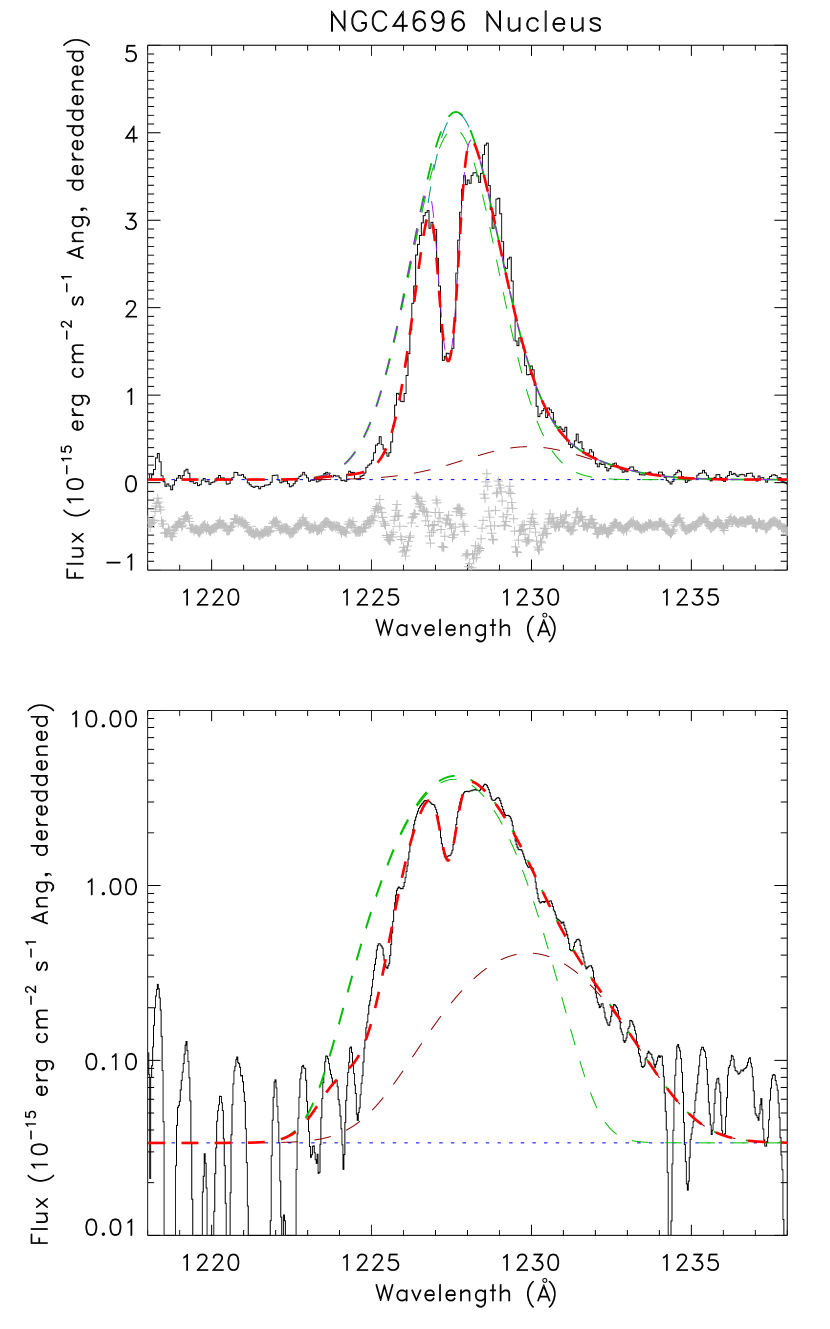
NGC 4696 shows an asymmetric Ly emission profile at 1227.6 Å (, km s-1) with what appears to be a narrow absorption line superimposed at 1227.3 Å. There is a very low level of continuum flux ( ); the continuum level listed in Table 3 was obtained by averaging the flux in continuum pixels between Å. The component structure of this emission line is unclear. We interpret the narrow absorption as Ly at the same redshift as NGC 4696. There are no Galactic, absorption lines expected at this wavelength and the pathlength to NGC 4696 is short enough that no intervening, intergalactic absorption lines are expected. The simplest model–a single Gaussian emission component and a single Voigt absorption profile–does not give satisfactory results. Adding a second, weaker emission component helps account for the red wing of the emission, but the peak is still poorly fit. The steep blue edge of the emission suggests the presence of additional absorbing gas slightly blueshifted from the systemic Ly of NGC 4696, possibly outflowing from the nucleus or associated with the host galaxy itself. If a single, broad absorption line is included in the fit, the profile model fits the data well. However, we caution against overinterpretation of this fit, especially the inferred blue-side absorber. The emission may be intrinsically non-Gaussian or the absorption profile may be more complicated than a single, simple Gaussian component. Fit parameters are given in Table 3.
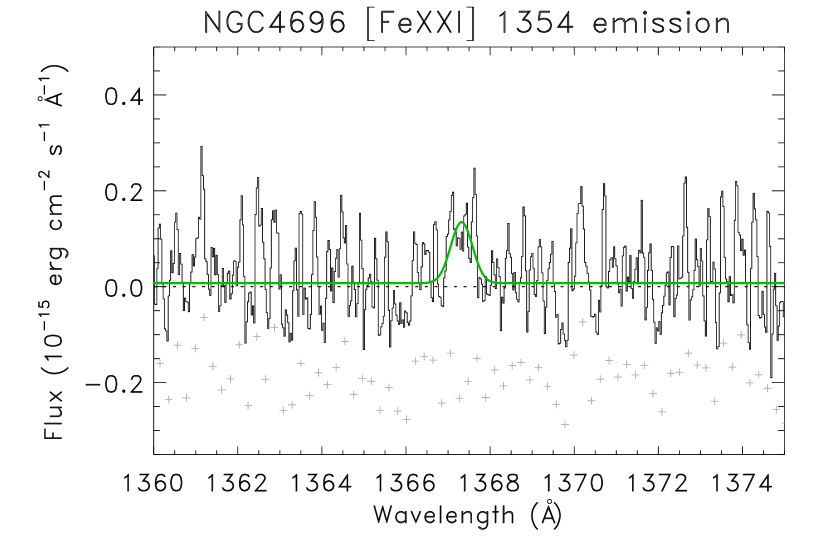
Anderson & Sunyaev (2016) found a very low-significance emission feature they interpreted as [Fe XXI] associated with NGC 4696. We confirm this possible detection in our more sophisticated reduction of the data (Figure 4) at a significance level of . The possible emission line is fitted by a Gaussian with km s-1 and km s-1. Our fitted flux of erg cm-2 s-1 is consistent with the Anderson & Sunyaev 90% upper limit of erg cm-2 s-1.
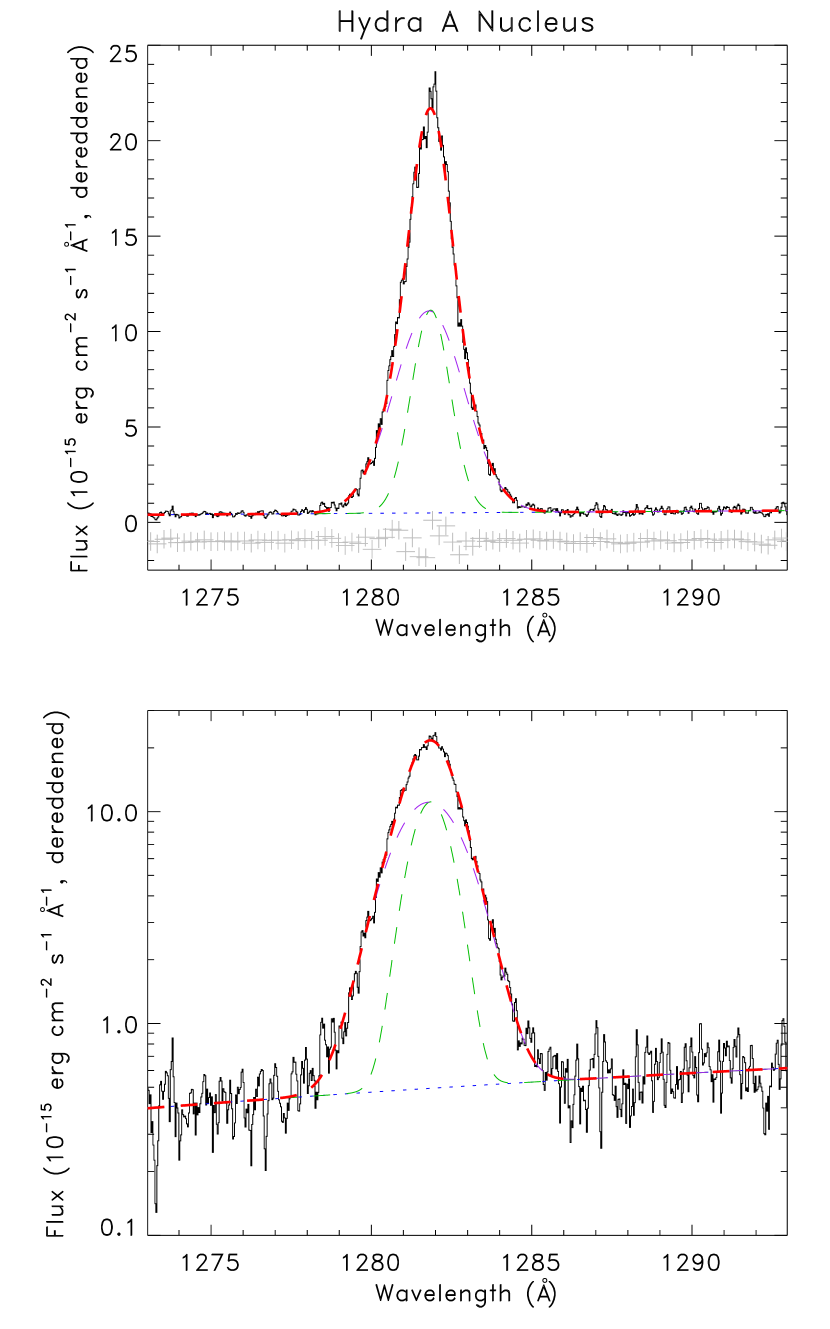
3.3. Hydra A
The far-UV spectrum of Hydra A shows a relatively narrow Ly emission peak at close to the systemic velocity. It is well-fit with a broad-plus-narrow pair of Gaussian emission components and a first-order linear continuum (Figure 5). Some structure in the residual suggests that there may be additional components, but nothing obvious is seen.
Recent HST images of Hydra A in the ultraviolet by Tremblay et al. (2015) show that the nucleus is obscured by a dust disk viewed edge-on. Thus one would expect the nuclear FUV continuum and line emission to be suppressed or absent entirely. It is therefore surprising that a FUV continuum is present, the Ly line emission is many times more luminous than either M 87 or NGC 4696 (Tables 2, 3), and that no narrow absorption line is seen superimposed on the Ly emission as is seen in the other two cases (Figures 1, 3). We conclude that the nuclear region must therefore not be obscured by the dust disk in Hydra A.
In addition to the usual Galactic, absorption lines, the Hydra A spectrum shows hints of C II 1334.5, O ISi II 1304, and Si III 1206.5 absorption at the redshift of Hydra A. It is possible that this absorption arises in the dust disk bisecting the galaxy (Tremblay et al., 2015). However, no H I absorption is seen at the systemic redshift, so modeling of these absorption lines would require data of much higher quality.
No metal-ion emission is seen including [Fe XXI].
3.4. Limited angular resolution information from HST/COS
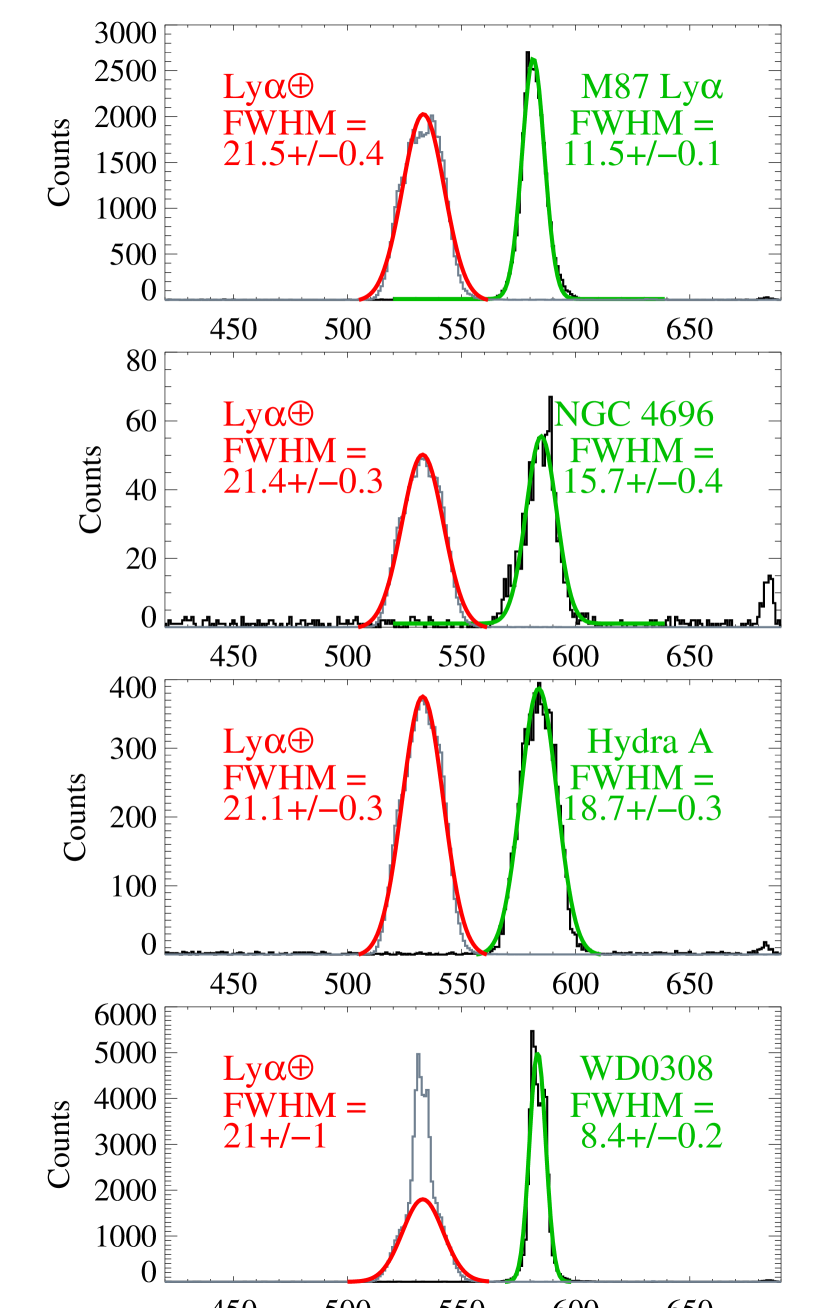
While /COS was not designed to provide high angular resolution imaging spectroscopy, it has been demonstrated that limited spatial information can be obtained from an analysis of a target’s cross-dispersion profile (France et al., 2011). The angular resolution of COS in the G130M mode is ″. In order to evaluate the spatial extent of the Ly emission line region at resolution, we compared the angular profiles of the three FR 1 galaxies with 1) a known extended emission source and 2) a known point source. HST orbits in a diffuse cloud of neutral and ionized atoms; the “air glow” from the atomic recombination and resonant scattering of solar photons in this cloud produces a uniform background of hydrogen and oxygen emission that fills the COS aperture and approximates a filled-slit observation of an astronomical target. For point source comparison, we downloaded spectra of a well-studied COS calibration target, WD 0308565. We analyzed observations from the longest central wavelength settings available from each target (cenwave and ) as these grating settings have the smallest intrinsic cross-dispersion heights (Roman-Duval et al., 2013).
Figure 6 shows the cross-dispersion profiles of the Ly emission lines of the three FR 1 galaxies (top three panels), the FUV continuum of WD 0308 (bottom panel), and the Ly airglow spectra measured simultaneously. The galactic/stellar profiles were extracted over a 400 dispersion-direction pixel region ( Å) centered on the source Ly emission line (offset into the continuum at 1247.8 Å for WD 0308). The geocoronal Ly airglow profile was fitted with a Gaussian (red) and shown offset from the central cross-dispersion profile of the targets by pixels. Gaussian fits to the galaxy/star cross-dispersion profiles are shown in green. The Gaussian FWHMs (in pixels, recall 1 pixel ″ for COS/G130M) are shown in the legends. The y-axis label shows the total counts per cross-dispersion extraction region in each of the targets, with the geocoronal profile scaled to the peak of the target flux. For the FR 1 galaxies, the geocoronal Ly line-height is always between pixels FWHM (″), consistent with the expected instrumental profile for a filled aperture and the non-uniform primary science aperture response function of COS. The WD 0308 continuum is bright enough that it has comparable flux to the airglow line, thus its geocoronal line width must be fitted with a pair of Gaussians. The FWHM of the white dwarf cross-dispersion profile is pixels (0.92″), consistent with the expected cross-dispersion profile for a point source. The broader component has FWHM pixels (2.3″), consistent with a filled-aperture (bottom panel, Figure 6).
Contrasting the filled-aperture geocoronal observations and the point source white dwarf observations with the cross-dispersion heights of the FR 1 galaxies, we see that all three galaxies are in an intermediate category: they are clearly extended emission sources, but do not fully fill the COS aperture. For M 87, we find a cross-dispersion line height of pixels (1.27″), with pixels (2.06″) and pixels (1.73″) for Hydra A and NGC 4696, respectively. We conclude that the Ly-emitting regions for these FR 1 galaxies are indeed extended, though do not fill the aperture.
A similar analysis of a region of the FUV continuum away from the galactic Ly emission signal shows an interesting result: the FUV continua in M 87 and Hydra A are also extended (that is, not consistent with a point-like AGN alone) and the FUV continuum in M 87 shows an angular extent % larger than the Ly emission region (FWHM pixels over a range of continuum wavelengths and extraction region sizes). NGC 4696 does not have sufficient FUV continuum flux for a cross-dispersion profile to be reliably measured.
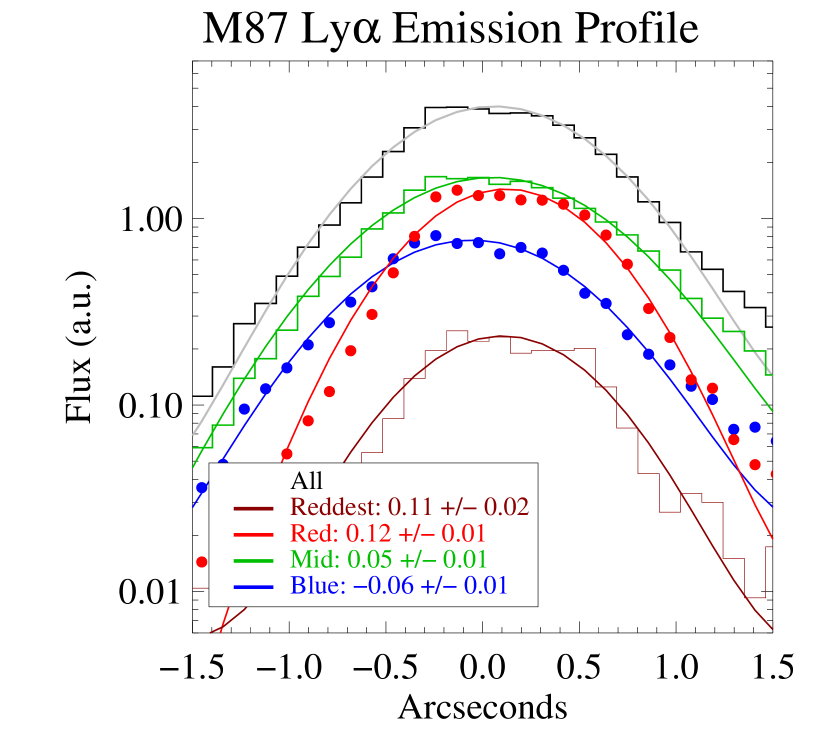
Furthermore, in M 87 the Ly core emission, blue wing emission, and red wing emission are centered at slightly different locations in the aperture (see Figure 7). While slight, these offsets are consistent with Ly-emitting material outflowing along the direction of the jet (blue wing is in the direction of the jet; red wing in the direction of the counterjet).
The inferences on the spatial extent and location of the line and continuum emission in M 87 can be tested by obtaining long-slit FUV spectra of the nucleus at position angles along the jet and perpendicular to the jet using HST/STIS. The results of these observations (approved for HST cycle 24) will be reported in a future publication.
3.5. BL Lac Objects
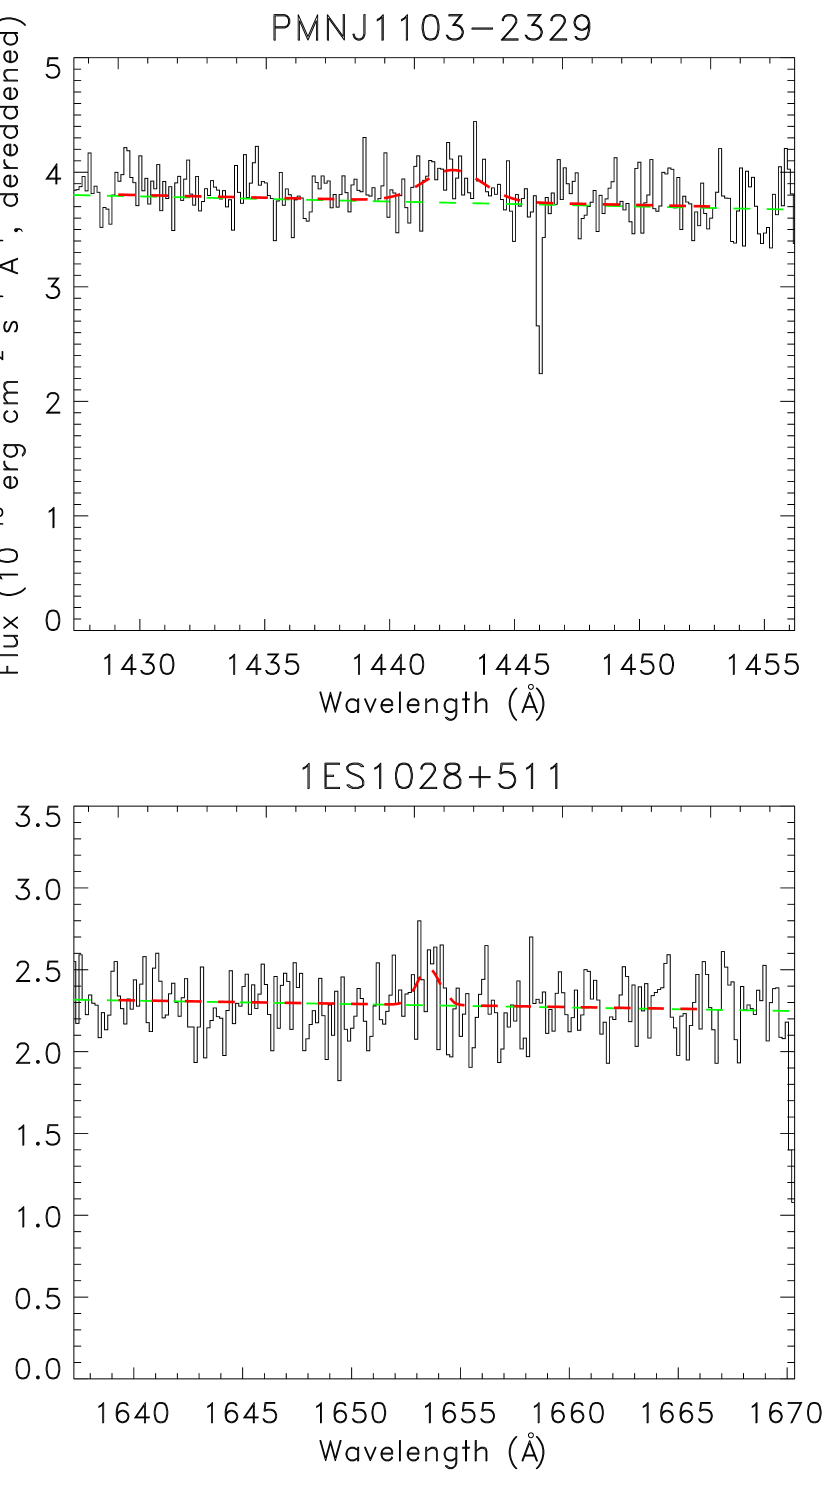
Several BL Lac objects in the literature show weak Ly emission: Mrk 421, Mrk 501, and PKS 2005489 (Paper 1) and more recently H 2356309 (Fang et al., 2014). To these we add new detections of weak Ly emission in PMN J11032329 and 1ES 1028511. As with Paper 1, we fit power-law continua to the spectra and model the Ly emission profiles as single, Gaussian components.
Neither PMN J11032329 nor 1ES 1028511 show high-significance Ly emission features like the FR 1s, nor even as large an equivalent width as the previously-published BL Lac objects with Ly emission (Paper 1). Nevertheless, a Gaussian fit in the expected location of the systemic Ly shows weak, broad, emission with significance levels of and for PMN J11032329 and 1ES 1028511, respectively (Figure 8).
Of the seven BL Lac objects with well-known redshifts and high S/N FUV spectra, six show intrinsic Ly emission. Weak, relatively narrow Ly emission appears to be a generic feature of both BL Lac objects and their parent population FR 1 radio galaxies.
4. Discussion
The similar Ly luminosities of FR 1s and BL Lac objects is additional evidence that these two classes are the same type of object seen from different viewing angles. Specifically, the BL Lacs (Mrk 421, Mrk 501 and PKS 2005489) and the FR 1 (Hydra A) are at comparable redshifts and have comparable Ly luminosities (see Table 5). But the line luminosities for the observed sources vary by two orders of magnitude, an unexpected result if the ionizing continuum and distribution of Ly emitting clouds in these objects are both isotropic. The pure FR 1s in Table 5, M 87 and NGC 4696, have at least an order of magnitude less Ly luminosity than any of the other AGN which have at least some beamed radiation coming in our direction. Therefore, the beamed radiation must be considered in modeling the Ly emission, which makes the emission mechanism and its location(s) a great deal harder to model in these objects.
| Target | SL | FWHM aaFWHM of strongest emission component only | bbtotal Ly luminosity of all components | Instrument | Notes | |
|---|---|---|---|---|---|---|
| () | (km s-1) | |||||
| FR 1 AGN | ||||||
| M 87 | 0.0022 | HST/COS | this work | |||
| NGC 4696 | 0.00987 | HST/COS | this work | |||
| Hydra A | 0.05488 | HST/COS | this work | |||
| BL Lac Objects | ||||||
| PMN J11032329 | 0.1847 | 6.2 | HST/COS | this work | ||
| 1ES 1028511 | 0.3607 | 3.3 | HST/COS | this work | ||
| H 2356309 | 0.165 | HST/COS | Fang et al. (2014) | |||
| Mrk 421 | 0.0300 | 9 | HST/COS | Paper 1 | ||
| PKS 2005489 | 0.0710 | 15 | HST/COS | Paper 1 | ||
| Mrk 501 | 0.0337 | 23 | HST/FOS | Paper 1 | ||
| PKS 2155304 | 0.116 | HST/STIS | Paper 1 | |||
In a Seyfert galaxy, the line emission comes from the integrated emission of the broad and narrow emission line clouds while the continuum arises in an accretion disk. The low-level, non-thermal continuum emission in FR 1s suggests that an accretion disk is not present or at least does not possess anywhere near the accretion rate seen in Seyferts (Prieto et al., 2016). What, then, is the ionizing radiation source we detect in recombining H I? And what is the distribution of the emission line clouds? Our COS spectra are suggestive of answers to these questions but are not conclusive.
| Quantity | M 87 | Hydra A | NGC 4696 | Unit |
|---|---|---|---|---|
| aaContinuum flux at 1215 Å. | ||||
| ionizing flux | photons | |||
| predicted | ||||
| observed | ||||
| OPF | predicted/observed |
In Table 6 we use COS observations of the three FR 1s to determine the factor by which the ionizing continuum extrapolated from our COS FUV spectra overpredicts the strength of Ly emission: the so-called over-prediction factor (OPF) of Paper 1. The OPF is the ratio between the Ly luminosity predicted from the power-law fit to the ionizing continuum, to that observed in COS spectra, and it should be related to the Doppler factor . Whereas the BL Lac objects exhibit OPFs of hundreds to tens of thousands, two of the three FR 1s have OPFs only slightly greater than unity. In previous FOS observations of M 87 (Sankrit, Sembach & Canizares, 1999) the Ly luminosity was lower but the continuum flux was at the same level as shown here, leading to OPF values slightly less than unity inside the FOS aperture. The OPF of Hydra A is intermediate between the very nearby FR 1s and the BL Lac objects as might be expected if we are seeing a portion of the the beamed continuum in that AGN. A small OPF () is also seen in the prototypical Seyfert 1 galaxy Mrk 817 so that the OPF values slightly greater than one in Table 6 likely are consistent with photo-ionization with modest covering factor for the emission-line clouds (see Paper 1).
If the ionizing continuum producing the Ly in these FR 1s is the result of beaming, then the ionizing continuum seen by potential Ly emitting clouds should vary smoothly with angle away from the beaming axis. If Ly emitting clouds exist isotropically around the continuum source, then some clouds are illuminated by a much larger ionizing continuum than we observe. For example, it has been estimated from population statistics (Perlman & Stocke, 1993; Urry & Padovani, 1995) that the half power-angle of the X-ray emission in BL Lacs is °, which produces a significant fraction of beamed continuum at all angles relative to the beaming axis (see plots in the Appendix of Urry & Padovani, 1995). In this case the OPFs in Table 6 could be significant underestimates; i.e., there is much more ionizing continuum illuminating the near nuclear region than the amount of H I that can absorb it. Again, anisotropic distributions of ionizing flux and Ly emitting clouds are suggested.
4.1. M 87
While all three FR 1 objects studied here show intriguing complexity, more constraints on source size and geometry are available for M 87 due to its proximity to us and its previous observations in the FUV by HST. In particular, M87 is the only one of these objects where the jet viewing angle () is well constrained (Perlman et al., 2011; Meyer et al., 2013). Variability information is particularly important and puzzling. The Ly-emitting gas cannot possibly be as close in as cm (0.003 pc) to the SMBH as claimed by Sankrit, Sembach & Canizares (1999) from their variability constraints. The Schwarzschild radius for the SMBH in M 87 is cm. Even at cm () the Keplerian speed is km s-1, so the lines would be an order of magnitude broader than we observe if the Ly-emitting gas were even this close to the SMBH. A more likely location for the Ly clouds is ( cm; pc), the inner reaches of the narrow-line region and of the observed gaseous disk. So, there is little chance that the FOS-observed variability could be due to a very small source size. The larger distance of pc from the SMBH is consistent with the observed angular extent of the Ly components in the COS aperture as well as the observed line-width, but leaves the large variability amplitude over short time periods as a puzzle. It seems most likely that the reported 5 day Ly variability is spurious, due to a mis-placement of the FOS aperture as suggested by Sankrit, Sembach & Canizares (1999). Currently there is no unambiguous indication for emission-line gas closer than 3 pc, at much larger radii than where the BLR of Seyferts exists.
The suppression of BLR emission in BL Lacs was first explored by Guilbert, McCray & Fabian (1983) who pointed out that the steep spectrum ionizing continua seen in BL Lacs will inhibit the creation of cool, K clouds that are typical of Seyferts and QSOs. For this mechanism to be operable in FR 1s, this steep ionizing continuum should be illuminating much of the potential BLR of these AGN. Indeed, the steep X-ray spectra of BL Lacs must be much less beamed (half illumination angle radian) than the radio and optical continua based on their observed properties and source counts (Urry & Padovani, 1995) when selection is made in the X-ray versus radio or optical bands. Therefore, the presence of broad-line emitting gas is not expected in this class of AGN, as we observe.
Unlike the narrow core emission in M 87, the red and blue wings to the Ly emission are much broader and appear to be offset spatially from the main Ly emission along the jet axis (see Sec 3.4). The red wing emission also varies over the same observing epochs and is very likely intrinsic variability since there is no observed absorption in M 87 at these wavelengths. Given their oppositely-trending spatial extents, the red and blue emission wings are likely to arise in gas illuminated or shocked by the jet (blue wing) and counter-jet (red wing). Spatially-resolved STIS spectra can confirm this suggestion.
4.2. FR 1 and BL Lac Accretion Powers
In the three FR 1s observed by HST/COS, the Ly luminosities are comparable to or somewhat less than what is expected in “Case B” recombination theory assuming unity covering factor. In M 87 previous epochs saw lower Ly luminosities while the continuum luminosities remained the same. Therefore, at the highest Ly luminosities observed, an ionization-bounded scenario is possible in these AGN but, even then, the amount of gas must be close to the amount needed to absorb all the available ionizing photons given the OPF values found here. If the line-emitting clouds are in a density-bounded regime then, as illustrated in Paper 1 using the Ly line luminosities seen in BL Lac objects, there is very little warm gas in this region, . This amount is inferred by assuming that there is one hydrogen atom for every Ly photon emitted. A reasonable energy conversion rate of this mass (e.g., 1%) finds a very low estimated accretion rate, which is consistent with earlier estimates using a variety of methods (Kuo et al., 2014; Russell et al., 2015; Di Matteo et al., 2016).
It is also possible that the observed Ly gas is outflowing rather than infalling, which decreases the estimated accretion rate even further. This possibility is consistent with the limited red/blue wing spatial information from the COS aperture (Section 3.4). It is important to verify this assertion using the full HST spatial resolution with STIS.
There could be a significant amount of much hotter, “coronal” gas in the line-emitting region surrounding the cooler, Ly-emitting clouds. Using the results from Anderson & Sunyaev (2016) on the detection of [Fe XXI], which we confirm here, an estimate of particle density of can be derived for a temperature of K based on the presence of the [Fe XXI] feature. Assuming this hot coronal gas fills the region around the SMBH out to pc, this phase contains of gas. These values are consistent with the recent re-analysis of Chandra X-ray images of M 87 conducted by Russell et al. (2015). Although we have no good, direct measurement of the density of the Ly-emitting clouds, if the coronal gas is in pressure equilibrium with these clouds, their densities are a few . It is reasonable to suspect that the Ly-emitting cloud ensemble is gas which has condensed out of this hotter phase in either an infalling or outflowing wind.
4.3. Extragalactic Ionizing Continuum Supplied by FR 1s
If the ionizing continuum radiation extrapolated from the HST/COS spectra of M 87 and NGC 4696 is typical of FR 1 radio galaxies, then the contribution of this class of AGN to the extragalactic UV background (UVB) in the local universe may be substantial since this AGN class is so numerous (3% of all bright cluster ellipticals have ; Ledlow & Owen, 1996).
The beaming geometry in FR 1s also must be taken into account in estimating the amount of UVB contributed by these objects. For example, there is some evidence from BL Lac population studies (e.g., Perlman & Stocke, 1993; Urry & Padovani, 1995; Nieppola et al., 2006; Padovani et al., 2007; Meyer et al., 2011; Giommi, Padovani, Polenta, 2013) that the amount of Doppler boosting (i.e, the relativistic ) varies with frequency of emitted radiation. This is also known as the re-collimating or accelerating jet model (Ghisellini & Maraschi, 1989; Urry & Padovani, 1995; Böttcher & Dermer, 2002) for blazars. X-ray-selected BL Lacs (most of which are now termed High-energy peaked BL Lacs or HBLs) often lack the optical non-thermal BL Lac spectrum, instead showing either a pure stellar spectrum or a mixture of an old stellar population and a non-thermal continuum. This property and their large space density means that the X-ray beam must be much broader than the optical and radio emitting beams, presumably coming from particles lower in . This hypothesis is supported by the optical polarization studies conducted by Jannuzi, Smith & Elston (1994) which showed that HBLs possess only modestly variable polarization amounts and relatively constant position angles of polarization as if we are viewing HBL optical beams from well off their axes. A gradient of broader to narrower emission beams (lower to higher s) with increasing wavelength predicts that the UV continuum beam is somewhat narrower than the ° for the X-ray emission (e.g., Perlman & Stocke, 1993). Due to this somewhat rudimentary understanding of the beaming geometry, here we adopt a simplistic model with a beamed ionizing flux emanating from two cones with half-angles of 20° and an unbeamed flux given by our FR 1 observations emitted over the rest of the sphere.
Since the extrapolated Lyman continuum flux of Hydra A it is almost two orders of magnitude more luminous than that of M 87, we assume that some significant beaming is present in our direction towards this source and we do not use its ionizing flux as typical of unbeamed FR 1s. Using just M 87 and NGC 4696 as typical for the unbeamed FR 1 population, the ionizing continuum luminosity in these objects is ergs s-1. If only a small fraction of luminous early-type galaxies are FR 1s, then the ionizing radiation contributed by this class is also quite small. But the evidence is otherwise; e.g., Ledlow & Owen (1996) find that 3% of all bright cluster ellipticals have radio luminosities with while Lin & Mohr (2007) find a larger fraction of 5% with in X-ray emitting clusters. At X-ray wavelengths Martini et al. (2006) found that % of all bright cluster ellipticals emit X-rays at ergs s-1. In a combined X-ray/radio study of cluster AGN, Hart et al. (2009) found 6% of bright cluster ellipticals are radio sources at and 1% are X-ray sources at ergs s-1. Extrapolation of these results to lower radio and X-ray power levels is consistent with all bright cluster ellipticals being radio sources at and X-ray sources at erg s-1. Indeed, a deep Chandra observation of the central region of the Perseus Cluster (Santra, Sanders & Fabian, 2007) has detected weak ( ergs s-1) non-thermal X-ray point sources from all thirteen early-type galaxies brighter than in this region. In the Santra, Sanders & Fabian (2007) X-ray imaging, there is no obvious trend in X-ray luminosity with optical luminosity, suggesting that the AGN emission in these X-ray point sources is similar in luminosity for all bright cluster ellipticals. Together, all these studies suggest that virtually all bright early-type cluster galaxies are weak FR 1s and could be emitting Lyman continuum radiation at levels similar to M 87. Despite consistent results from the several studies cited above, this important assumption must be confirmed in order to validate our conclusions concerning the FR 1 contribution to the UVB.
The CfA galaxy luminosity function of elliptical galaxies from Marzke et al. (1994) finds that the number density of ellipticals is Mpc-3 (we ignore S0 galaxies in this estimate since they appear not to harbor FR 1s in general). Following the Santra, Sanders & Fabian (2007) result as well as the extrapolations from higher power levels made in the other studies quoted above, we assume that all bright ellipticals emit Lyman continuum radiation at a level similar to M 87 and NGC 4696. From this assumption we derive an estimate of the unbeamed UV emission from FR 1s of ergs s-1 Mpc-3. This amount is % of the total ionizing background at (assuming the total UV background at from Haardt & Madau, 2012).
If the UV luminosity of ergs s-1 is the unbeamed continuum then beaming of these sources can add significantly to this total, perhaps as much as an additional 7% at if the standard beaming model of Urry & Padovani (1995) is assumed (half opening angle of °; see above). This standard model assumption is equivalent to assuming that 1% of all FR 1s are seen as beamed sources at any one location and that their mean observed Doppler boosting factor is 20 in the UV. There are a very few (roughly one in ) FR 1s whose beamed non-thermal luminosities are at the luminosities of ergs s-1 (Morris et al., 1991) typical of HBL type BL Lac objects, but these contribute negligibly to the UVB total.
Overall the FR 1 AGN class could contribute an amount to the ionizing background of up to 1/7th (10-15% of the total UVB) of the amount contributed by QSOs and Seyferts locally. If the above assumptions about beaming and the FR 1 source population are correct, luminous ellipticals contribute non-negligibly to the amount of ionizing background inferred from source population studies at low- (Haardt & Madau, 2001, 2012). A sizeable contribution from FR 1s could account for the discrepancy between the most recent UV background model of Haardt & Madau (2012) (which has minimal contribution from normal, star forming galaxies) and the observed absorber statistics in the Ly forest (Kollmeier et al., 2014; Shull et al., 2015). However, since most bright ellipticals are found in rich clusters this putative additional UV radiation could be very non-uniform, clumped around regions rich in early-type galaxies. A more detailed look at FR 1 radio galaxy beaming geometries and number density statistics is required at assess these possibilities in more detail.
Support for the idea that a large contribution to the UVB could be made by FR 1s/BL Lacs comes from the all-sky survey of far-UV sources made by the Extreme Ultraviolet Explorer (EUVE). This continuum survey conducted at a wavelength closer to the Lyman limit than any other, detected more BL Lacs and narrow-line Seyferts than any other AGN class (Marshall et al., 1995). These two AGN classes share an unusual SED with a very steep soft X-ray spectrum as well as the absence of broad permitted lines in their optical and UV spectra. The three FR1 s studied here share the absence of broad emission lines with these more luminous, EUV-bright AGN classes.
5. Conclusions & Summary
We present far-UV spectroscopic observations of three FR 1 radio galaxies (M 87, NGC 4696, & Hydra A) and two previously-unpublished BL Lac objects (1ES 1028511 and PMN J11032329). All three FR 1 galaxies show prominent Ly emission at very close to the systemic redshifts and a weak FUV continuum.
M 87 is the brightest and most interesting of the objects observed. Though the COS/G130M spectral range is relatively short, we measure a power law index of and extrapolate the flux at the Lyman limit of at epoch 2014.
The strong Ly emission of M 87 is flanked by red and blue wings separated from the main peak by km s-1. Weak N V, C II, and Si IV emission lines are also seen at the redshift of M 87 and we confirm the very weak [Fe XXI] feature published by Anderson & Sunyaev (2016) at a level.
With the limited spatial information available with HST/COS, we find that the emitting regions of both line and continuum are intermediate between that of a point-source and a filled COS aperture implying that both extend over regions tens of parsecs wide. Furthermore, the continuum may be slightly more extended than the line emission and the red and blue wings of the Ly emission are extended along the jet axis consistent with being due to outflowing material from the nucleus. The most puzzling feature of the M 87 FUV data is the possible very short ( day) Ly line variability seen in the FOS data which is inconsistent both with the spatial extent of the Ly emission seen in the COS aperture and the observed, rather narrow line widths of Ly. Sankrit, Sembach & Canizares (1999) raise a concern that a slight displacement of the FOS aperture could have falsely created the apparent Ly variability. In light of the other evidence, the short-term Ly variability appears to be spurious although this can be confirmed or refuted by future COS and STIS FUV spectroscopy (approved HST Cycle 24 program 14277). It is expected that future long-slit STIS spectra also can trace the extents of the three components of Ly and the FUV continuum to provide a viable physical picture of the M 87 nucleus.
NGC 4696 shows an asymmetric Ly profile and a very weak UV continuum. We model the emission as a strong central component and weak red wing overlaid on at least one strong H I absorption system at the systemic redshift. We confirm the presence of weak [Fe XXI] emission in this object as well.
Hydra A shows a simple broad-plus-narrow Ly emission profile and a moderate FUV continuum. Metal-ion absorption lines in Si IIO I and C II show the presence of neutral, metal-enriched gas associated with Hydra A, but it is not known if this gas is circumnuclear or associated with the host galaxy on a broader scale. The Ly emission profile is well-fit without intrinsic H I absorption. Despite the appearance of an edge-on dust disk in optical and FUV images of Hydra A (Tremblay et al., 2015), the observations of strong continuum and Ly line emission–as well as the lack of narrow H I absorption seen in the other two FR 1s–leads us to conclude that the dust disk misses the nuclear region itself.
The BL Lac objects 1ES 1028511 and PMN J11032329 show low-significance () Ly emission features consistent with other BL Lac objects from the literature (e.g., Paper 1; Fang et al. 2014). The Ly luminosities of these objects are comparable to that of the FR 1s discussed here and in Paper 1. While it is generally accepted that FR 1s are the parent population for BL Lac objects (and in fact optical and X-ray imaging of BL Lacs reveal that they reside in giant elliptical galaxies in clusters, as do FR 1s (see e.g., Wurtz et al., 1997; Donato et al., 2003; Sambruna et al., 2007), the emission mechanisms, source locations and geometries for the beamed and unbeamed ionizing continua and Ly emission lines are still unclear. As the nearest unobscured FR 1 (Centaurus A is a bit closer but has a nucleus obscured by dust), M 87 provides the best opportunity to observe the nuclear structures in “radio-mode” AGN and solve the puzzle of their apparent very low accretion rates. New high spatial and spectral resolution observations in the FUV with COS and STIS will complement upcoming efforts at X-ray wavelengths and at mm wavelengths with VLBI to determine the size and geometry of the line and continuum-emitting regions in FR 1s.
The observed Ly luminosity in M 87 and NGC 4696 is within a factor of a few to what is predicted by “Case B” recombination illuminated by the non-thermal continuum in these sources extrapolated to the Lyman edge. Thus the circumnuclear gas could be either in an ionization- or density-bounded regime. The ionizing continuum of Hydra A overpredicts the observed Ly luminosity in this FR 1 by a factor of ten suggesting that the observed continuum has some significant contribution from beamed radiation as well as the more isotropic radiation seen in the two other FR 1s. The extrapolated FUV continuum flux of BL Lac objects overpredicts the observed Ly line flux by factors of . These results are consistent with all of these sources possessing an unbeamed non-thermal continuum that is the primary ionizing source for the gas that produces the observed Ly emission line. While both the continuum and Ly line are seen to vary, the substantial distance (1-10 pc) we have inferred for the Ly emitting region does not allow the tight connection between continuum and line variability that is seen for Seyfert galaxies (“reverberation mapping”; Peterson et al., 2014). However, one apparently successful narrow-line-region distance determination has been obtained for NGC 5548 using the [O III] 5007Å forbidden line (Peterson et al., 2013). A similar study may be possible for M 87.
FR 1 radio galaxies are very common in the modern era, comparable in space density to Seyfert galaxies. Recent work at radio and X-ray wavelengths (e.g., Martini et al., 2006; Santra, Sanders & Fabian, 2007; Lin & Mohr, 2007; Hart et al., 2009) make a plausible case that virtually all bright ellipticals are AGN with ionizing luminosities comparable to or greater than what we find in M 87 ( ergs s-1). If it is assumed that all ellipticals possess unbeamed non-thermal continua at this level, the contribution to the low- UVB could be substantial, perhaps as much as % of the extragalactic ionizing background.
We acknowledge valuable input on this project from Mike Shull and Mike Anderson. This work was made possible by HST guest observing grant GO-13489 (J. Stocke, PI).
Facility: HST (COS)
References
- Allen et al. (2006) Allen, S. W., Dunn, R. J. H., Fabian, A. C., Taylor, G. B., & Reynolds, C. S. 2006, MNRAS, 372, 21
- Anderson & Sunyaev (2016) Anderson, M. E. & Sunyaev, R., 2016, MNRAS, 459, 2806
- Begelman & Celotti (2004) Begelman, M. C., & Celotti, A. 2004, MNRAS, 352, L45
- Blandford & Begelman (1999) Blandford, R. D., & Begelman, M. C. 1999, MNRAS, 303, L1
- Böttcher & Dermer (2002) Böttcher, M., Dermer, C. D., 2002, ApJ, 564, L86
- Branchesi et al. (2006) Branchesi, M., Gioia, I. M., Fanti, C., Fanti, R., Perley, R., 2006, å, 446, 97
- Broderick et al. (2015) Broderick, A. E., Narayan, R., Kormendy, J., Perlman, E. S., Rieke, M. J., Doeleman, S. S., 2015, ApJ, 805, 179
- Burns (1990) Burns, J. O. 1990, Astronomy, 18, 29
- Canning et al. (2011) Canning, R. E. A., Fabian, A. C., Johnstone, R. M., Sanders, J. S., Crawford, C. S., Ferland, G. J., Hatch, N. A., 2011, MNRAS, 417, 3080
- Carter & Jenkins (1992) Carter, D., & Jenkins, C. R. 1992, MNRAS, 257, 7P
- Carter et al. (1997) Carter, D., Johnstone, R. M., & Fabian, A. C. 1997, MNRAS, 285, L20
- Croton et al. (2006) Croton, D. J., et al. 2006, MNRAS, 365, 11
- Danforth et al. (2010) Danforth, C. W., Keeney, B. A., Stocke, J. T., Shull, J. M., & Yao, Y. 2010, ApJ, 720, 976
- Danforth et al. (2016) Danforth, C. W., et al., 2016, ApJ, 817:111
- Di Matteo et al. (2003) Di Matteo, T., Allen, S. W., Fabian, A. C., Wilson, A. S., & Young, A. J., 2003, ApJ, 582, 133
- Di Matteo et al. (2016) Di Matteo, T., Croft, R. A. C., Feng, Y., Waters, D., & Wilkins, S. 2016, (ArXiv:1606.08871)
- Donato et al. (2003) Donato, D., Gliozzi, M., Sambruna, R. M., Pesce, J. E., 2003, å, 407, 503
- Fabian et al. (2011) Fabian, A. C., Sanders, J. S., Allen, S. W., et al. 2011, MNRAS, 418, 2154
- Fanaroff & Riley (1974) Fanaroff, B. L., & Riley, J. M. 1974, MNRAS, 167, 31P
- Fang et al. (2014) Fang, T, Danforth, C. W., Buote, D. A., Stocke, J. T., Shull, J. M., Canizares, C. R. & Gastaldello, F., 2014, ApJ, 795:57
- Ford et al. (1994) Ford, H. C., et al. 1994, ApJ., 435, L27
- Ford et al. (1997) Ford, H., Tsvetanov, Z., Ferrarese, L., Kriss, G., Jaffe, W., Harms, R., & Dressel, L., 1997, IAU Colloq. 163: Accretion Phenomena and Related Outflows, ed. Wickramasinghe, Bicknell & Ferrario, 121, 620.
- Ford & Tsvetanov (1999) Ford, H., & Tsvetanov, Z. 1999, The Radio Galaxy Messier 87, 530, 278
- France et al. (2011) France, K. et al. 2011, ApJ, 743, 186
- Ghisellini & Maraschi (1989) Ghisellini, G. & Maraschi, L., 1989, ApJ, 340, 181
- Giommi, Padovani, Polenta (2013) Giommi, P., Padovani, P., Polenta, G., 2013, MNRAS, 431, 1914
- Guilbert, McCray & Fabian (1983) Guilbert, P. W., McCray, R., & Fabian, A. C., 1983, ApJ, 266, 466
- Haardt & Madau (2001) Haardt, F., & Madau, P. 2001, in “Clusters of Galaxies and the High Redshift Universe Observed in X-rays”, Neumann & Tran, (ArXiv:0106018)
- Haardt & Madau (2012) Haardt, F., & Madau, P. 2012, ApJ, 746, 125
- Harms et al. (1994) Harms, R. J. et al. 1994, ApJ, 435, L35
- Hart et al. (2009) Hart, Q. N., Stocke, J. T ., & Hallman, E. J., 2009, ApJ, 705, 854
- Hawley & Balbus (2002) Hawley, J. F., & Balbus, S. A. 2002, ApJ, 573, 738
- Ho et al. (1997) Ho, L. C., Filippenko, A. V., Sargent, W. L. W., & Peng, C. Y. 1997, ApJS, 112, 391
- Ho & Peng (2001) Ho, L. C., & Peng, C. Y. 2001, ApJ, 555, 650
- Ho & Ulvestad (2001) Ho, L. C., & Ulvestad, J. S. 2001, ApJS, 133, 77
- Jannuzi, Smith & Elston (1994) Jannuzi, B. T., Smith, P. S., & Elston, R., 1994, ApJ, 480, 130
- Kaspi & Behar (2006) Kaspi, S. & Behar, E., 2006, ApJ, 636, 674
- Keeney et al. (2012) Keeney, B. A., Danforth, C. W., Stocke, J. T., France, K., & Green, J. C. 2012, PASP, 124, 830
- Kollmeier et al. (2014) Kollmeier, J. A., Weinberg, D. H., Oppenheimer, B. D., et al. 2014, ApJ, 789, L32
- Kormendy & Ho (2013) Kormendy, J., & Ho, L. C. 2013, ARA&A, 51, 511
- Kuo et al. (2014) Kuo, C.Y., Asada, K., Rao, R., Nakamura, N. et al. 2014, ApJ, 783, L33
- Lauer et al. (2014) Lauer, T. R., Postman, M., Strauss, M. A., Graves, G. J., & Chisari, N. E. 2014, ApJ, 797, 82
- Ledlow & Owen (1995) Ledlow, M. J., & Owen, F. N. 1995, AJ, 110, 1959
- Ledlow & Owen (1996) Ledlow, M. J., & Owen, F. N. 1996, AJ, 112, 9
- Lin & Mohr (2007) Lin, Y.-T. & Mohr, J. J. 2007, ApJS, 170, 71
- Macchetto et al. (1997) Macchetto, F., Marconi, A., Axon, D. J., Capetti, A., Sparks, W., & Crane, P. 1997, ApJ, 489, 579
- Madrid (2009) Madrid, J. P., 2009, AJ, 137, 3864
- Marshall et al. (1995) Marshall, H. L., Fruscione, A., & Carone, T. E. 1995, ApJ, 439, 90
- Martini et al. (2006) Martini, P., Kelson, D. D., Kim, E., Mulchaey, J. S., & Athey, A. A. 2006, ApJ, 644, 116
- Marzke et al. (1994) Marzke, R. O., Geller, M. J., Huchra, J. P. & Corwin, Jr., H. G. 1994, AJ, 108, 437
- Mauch & Sadler (2007) Mauch, T., & Sadler, E. M. 2007, MNRAS, 375, 931
- McNamara & Nulsen (2007) McNamara, B. R., & Nulsen, P. E. J. 2007, ARA&A, 45, 117
- Meyer et al. (2011) Meyer, E. T., Fossati, G., Georganopoulos, M., Lister, M. L., 2011, 740, 98
- Meyer et al. (2013) Meyer, E. T., Sparks, W. B., Biretta, J. A., Anderson, J., Sohn, S. T., van der Marel, R., Norman, C., Nakamura, M., 2013, ApJ, 774, 21
- Morris et al. (1991) Morris, S. L., Stocke, J. T., Gioia, I. M., Schild, R. E., Wolter, A., Maccacaro, T., & della Ceca, R. 1991, ApJ, 380, 49
- Narayan & Yi (1994) Narayan, R., & Yi, I. 1994, ApJ, 428, L13
- Narayan & Yi (1995) Narayan, R., & Yi, I. 1995, ApJ, 444, 231
- Nieppola et al. (2006) Nieppola, E., Tornikoski, M., Valtaoja, E., 2006, å, 445, 441
- Owen et al. (1996) Owen, F. N., Ledlow, M. J., & Keel, W. C. 1996, AJ, 111, 53
- Padovani et al. (2007) Padovani, P, Giommi, P., Landt, H., Perlman, E. S., 2007, ApJ, 662, 182
- Perlman et al. (2003) Perlman, E. S., Frye, C., Ebeling, H., Jones, L. R., Scharf, C. A., Horner, D., 2003, arXiv: astro-ph/0303533.
- Perlman et al. (2007) Perlman, E. S., Mason, R. E., Packham, C., Levenson, N. A., Elitzur, M., Schaefer, J. J., Imanishi, M., Sparks, W. B., Radomski, J., 2007, ApJ, 663, 808
- Perlman & Stocke (1993) Perlman, E. S. & Stocke, J. T., 1993, ApJ, 406, 430
- Perlman et al. (2011) Perlman, E. S., et al. 2011, ApJ, 743, 119
- Perlman et al. (2001) Perlman, E. S., Sparks, W. B., Radomski, J., Packham, C., Fisher, R. S., Pina, R., Biretta, J. A., 2001, ApJ, 561, L51
- Peterson et al. (2013) Peterson, B.M., Denney, K.D., DeRosa, G., Grier, C.J., et al. 2013, ApJ, 779, 109
- Peterson et al. (2014) Peterson, B.M., Grier, C.J., Horne, K., Pogge, R.W., et al., 2014, ApJ, 795, 149
- Prieto et al. (2016) Prieto, M.A., Fernandez-Ontiveros, J.A., Markoff, S., Espada, D., & Gonzalez-Martin, O. 2016, MNRAS. 457, 3801
- Quataert & Gruzinov (2000) Quataert, E., & Gruzinov, A. 2000, ApJ, 539, 809
- Roman-Duval et al. (2013) Roman-Duval, J. et al. 2013, “COS/FUV Spatial and Spectral Resolution at the new Lifetime Position”, Instrument Science Report COS 2013-07
- Russell et al. (2015) Russell, H. R., Fabian, A. C., McNamara, B. R., & Broderick, A. E. 2015, MNRAS, 451, 588
- Sambruna et al. (2007) Sambruna, R. M., Donator, D., Tavecchio, F., Maraschi, L., Cheung, C. C., Urry, C. M., 2007, ApJ, 670, 74
- Sankrit, Sembach & Canizares (1999) Sankrit, R., Sembach, K.R. & Canizares, C.R. 1999, ApJ, 527, 733
- Santra, Sanders & Fabian (2007) Santra, S., Sanders, J.S., & Fabian, A.C., 2007, MNRAS, 382, 895
- Shull, Stevans, & Danforth (2012) Shull, J. M., Stevans, M., & Danforth, C. W., 2012, ApJ, 752, 162
- Shull et al. (2015) Shull, J. M., Moloney, J., Danforth, C. W., & Tilton, E. M. 2015, ApJ, 811, 3
- Sikora & Begelman (2013) Sikora, M., & Begelman, M. C. 2013, ApJ, 764, L24
- Sitko & Junkkarinen (1985) Sitko, M. L., & Junkkarinen, V. T. 1985, PASP, 97, 1158
- Stocke, Danforth, & Perlman (2011) Stocke, J. T., Danforth, C. W., and Perlman, E. S., 2011, ApJ, 732, 113 (Paper 1)
- Stocke, Perlman, Gioia et al. (1999) Stocke, J. T., Perlman, E. S., Gioia, I. M., Harvanek, M., 1999, AJ, 117, 1957
- Tremblay et al. (2015) Tremblay, G. R., et al. 2015, MNRAS, 451, 3768
- Tsvetanov et al. (1998) Tsvetanov, Z. I., Hartig, G. F., Ford, H. C., et al. 1998, ApJ, 493, L83
- Tsvetanov et al. (1999) Tsvetanov, Z. I., Hartig, G. F., Ford, H. C., et al. 1999, The Radio Galaxy Messier 87, 530, 307 (The Nuclear Spectrum of M87)
- Ulrich (1981) Ulrich, M. H. 1981, A&A, 103, L1
- Urry & Padovani (1995) Urry, C. M., & Padovani, P., 1995, PASP, 107, 803
- Vermeulen et al. (1995) Vermeulen, R. C., Ogle, P. M., Tran, H. D., Browne, I. W. A., Cohen, M. H., Readhead, A. C. S., Taylor, G. B., & Goodrich, R. W., 1995, ApJ, 452, L5
- Walsh et al. (2013) Walsh, J. L., Barth, A. J., Ho, L. C., & Sarzi, M., 2013, ApJ, 770, 86
- Wing & Blanton (2011) Wing, J., Blanton, E., 2011, AJ, 141, 88
- Winter et al. (2011) Winter, L. M. et al. 2011, ApJ, 728, 28
- Wurtz et al. (1997) Wurtz, R., Stocke, J. T., Ellingson, E., Yee, H. K. C., 1997, ApJ, 480, 547