Magnetic properties of perovskites La0.7Sr0.3MnMnTixO3: Monte Carlo simulation versus experiments
Abstract
This work presents a Monte Carlo study of the phase transition in the perovskites La0.7Sr0.3MnMnTixO3 (= 0.1, 0.2, and 0.25). We take into account nearest-neighbor (NN) interactions between magnetic ions Mn3+() and Mn4+() using a spin model describing a strong anisotropy on the axis. We have calculated the uniform and staggered magnetizations as well as the Edwards-Anderson order parameter as functions of temperature, with and without an applied magnetic field. Fitting the experimental Curie temperature at , we estimated values of various exchange interactions in the system. The dominant one is that between Mn3+ and Mn4+ which is at the origin of the ferromagnetic ordering. Effects of the very small interaction between NN Mn3+ is analyzed: we show that it can cause an antiferromagnetic phase above which disappears at smaller or at Mn3+ concentrations smaller than 0.55. Our results show a good agreement with experiments on the magnetizations for substitution concentration , 0.2 and 0.3. We also studied the applied-field effect on the magnetization and our obtained results are compared with experiments performed at .
- PACS numbers:75.30.-m , 75.50.-y , 75.10.Hk , 05.10.Ln
pacs:
PACS numbers: XXXI INTRODUCTION
The study of phase transition in magnetic materials has been the subject of intensive studies both experimentally and theoretically in the last decades Zinn ; DiepSP . In this paper, we confine ourselves to the family of perovskite compounds La1-xAxMnO3 which has rich magnetic behaviors and numerous practical applications. Experiments have been performed to determine magnetic properties of manganese oxides La1-xAxMnO3, with A= Sr, Ca, Ba,…. These materials are currently attracting a considerable attention Dagotto2001 because of the complex interplay among spins which induces a rich phase diagram as well as the colossal magnetoresistance (CMR) phenomenon Hotta ; Dagotto2000 ; Kim . The rapid development of the CMR field is due mainly to its many applications in particular in spintronics Salamon ; Zhu ; Helmolt . The diagram in the phase space defined by concentration , temperature , magnetic field and superexchange (SE) is not quite clear yet for different compounds. Jonker and Van Santen Jonker have studied ferromagnetic compounds of manganese with perovskite structure. Their properties can be understood as the result of a strong ferromagnetic exchange interaction between nearest neighboring Mn ions via intercalated oxygen: Mn3+-O-Mn4+. The double exchange (DE) mechanism developed by Zener Zener1 ; Zener2 ; Zener3 explains the existence of ferromagnetism and the metallic behavior at low temperatures. There is now a consensus to recognize that the interesting properties observed in perovskites are fundamentally originated from the DE mechanism along the link Mn3+-O-Mn4+. This characteristic is at the origin of a new interesting observed phase transition in doped manganites Hong ; Bose from a magnetically-ordered phase to the disordered phase. Recent refinement of experimental techniques and the improvement of the sample quality have made possible to discuss critical phenomena of this transition Furukawa . To see more details on the role of the DE, we quote a work by Urushibara et al. Urushibara which have investigated the transport and magnetic properties related to the insulator-metal transition of La0.7Sr0.3MnO3 crystals. These experimental works allowed us to qualitatively understand properties of this magnetic system. Nevertheless, these phenomena have not been quantitatively modeled, though there has been a number of works dealing with this issue from a theoretical standpoint Hotta1 ; Restrepo .
In this paper we investigate by Monte Carlo (MC) simulation the magnetic properties in perovskite manganite La0.7Sr0.3MnO3. Effects of Ti substitution on the magnetic properties are studied for La0.7Sr0.3Mn1-xTi (= 0.1, 0.2 and 0.25). Recent experimental works on Ti doping Kallel ; Kallel1 ; Kallel2 ; Kallel2010 show that doping with non-magnetic Ti allows one to change the relative concentration Mn3+/Mn4+ which in turn reduces the effective ferromagnetic interaction between them. As a consequence, one can increase the magnetic resistivity of the compound for application in spin transport.
We use a discrete spin model to express the strong Ising-like anisotropy along the axis and we take into account various types of interactions between spins in the calculation of the magnetization. As seen in this paper, this model is justified by a good agreement with experimental measurements performed on this material.
The paper is organized as follows: in section II, we present our model and describe the MC method. Results are reported and discussed in section III, and our concluding remarks are given in
section IV.
II Model and Method
II.1 Model
We consider the simple cubic lattice with the following Hamiltonian:
| (1) |
where is the spin at the lattice site , is made over spin pairs coupled through the exchange interaction . In the following we shall take interactions between nearest-neighbors (NN) and between next nearest-neighbors (NNN) of magnetic Mn ions. is a magnetic field applied along the axis. Let us recall that there are two kinds of Mn ions in La0.7Sr0.3MnO3: Mn4+ with spin amplitude and Mn3+ with . They occupy the corner sites of the simple cubic lattice. It is experimentally found that interaction between neighboring Mn3+ and Mn4+ is strongly ferromagnetic while that between Mn4+ as well as that between Mn3+ are very weakly antiferromagnetic Kallel . As we will see later, to fit with experiments we need a very small interaction between NNN Mn3+ ions. Due to the strong disorder caused by La and Sr ions, the positions of Mn3+ and Mn4+ are at random. In addition, when one substitutes Mn ions by non-magnetic Ti the disorder becomes even stronger due to the magnetic dilution induced by Ti substitution. Experiments have been recently carried out on La0.7Sr0.3Mn1-xTixO3 by Kallel et al. Kallel ; Kallel1 ; Kallel2 ; Kallel2010 for several . We will compare our results with the data of these works.
Before defining explicitly the interactions, let us discuss about the spin model we shall use. We suppose that the spins of Mn ions lie on the axis with a strong uniaxial anisotropy. We have first tried to calculate magnetic properties using the Heisenberg model with a strong anisotropy but we did not get an agreement with experimental data at low temperatures. On the other hand, using a discrete Ising-like spin model, we obtain a good agreement with experiments on magnetization at various substitution concentrations in the whole temperature range as shown in the next section.
We define now the interactions. The exchange parameters are strongly correlated to the electric structure of the compound. In 1950, Goodenough Goodenough ; Goodenough1 and Kanamori Kanamori explained
the magnetic interactions in manganites. More quantitative calculations of the magnitudes of the exchange have been attempted only recently for LaMnO3 using
first-principles electronic structure methods Solovyev ; Su .
Based on the crystal and electronic structures of this system, several coupling interaction can be taken into account in the present study:
: interaction of a NN pair Mn3+-Mn4+,
: interaction of a NN pair Mn3+-Mn3+,
: interaction of a NN pair Mn4+-Mn4+.
In addition, we also introduce the following very small interactions between NNN ions:
: interaction between Mn3+ NNN.
: interaction between NNN Mn3+ and Mn4+.
: interaction between Mn4+ NNN.
As said earlier, the DE interaction Mn3+-O-Mn4+ results in a strong ferromagnetic coupling () and the SE interactions Mn3+-O-Mn3+ () and Mn4+-O-Mn4+ () give rise to very weak antiferromagnetic exchange integrals Jonker ; Birsan ; Anderson . We shall see below that though very small, these antiferromagnetic interactions cannot be neglected: they are at the origin of magnetic behaviors at very low and of the antiferromagnetic phase in a small temperature region above , as discussed in the next section. As for , and they are assumed to be even smaller than and . They are to be used for fine tuning of the fit. We have tested them while fitting with Ti substitution shown below. Only may be necessary since the high Mn3+ concentration (70%) allows for such a coupling to be visible. So from now on, we will neglect and for clarity.
II.2 Method
We have conducted standard MC simulation on samples of dimension , where is the number of simple cubic cells in each of the three Cartesian directions. Periodic boundary conditions are used in all directions. Simulations have been carried out for different lattice sizes ranging from to lattice cells. Some runs with , 283 and 323 have also been performed to check finite-size effects as will be shown below.
The procedure of our simulation can be split into two steps. The first step consists in equilibrating the lattice at a given temperature. For the thermalization, two difficult regions are the low-temperature () one and the critical region. The low- region have small ’update’ probabilities [proportional to exp(-E/T)] and therefore needs longer runs to ensure the equilibrium state before averaging: a simple check of energy behavior with time evolution and temperature evolution at low suffices. Near the transition temperature , the critical slowing-down also necessitates long runs to ensure a good statistical average. Test runs with different run lengths were performed to estimate necessary run length before real simulations. The second step, when equilibrium is reached, we determine thermodynamic properties by taking thermal averages of various physical quantities DiepTM ; Metropolis . Starting from a random spin configuration as the initial condition for the MC simulation, we have calculated the internal energy per spin , the specific heat , the magnetic susceptibility , the magnetization of each sublattice and the total magnetization, as functions of temperature and magnetic field . The MC run time for equilibrating is about MC steps per spin. The averaging is taken, after equilibrating, over MC steps.
Since the system has a strong disorder (random mixing of Mn ions), we will see that the size effects are not significant from sizes. Most of the simulations have been therefore carried out at this size using 20 to 30 samples for largest . For smaller and large sample sizes the configuration average needs smaller number of configurations (about 10 to 20). The results on vary over an interval of 4K with various disorder samples. So errors are K around the mean value. These errors cover smaller errors K due to the peak determination of .
The total magnetization is defined by
| (2) |
where the sum is performed over spins of both Mn3+ and Mn4+ and indicates the statistical time average. The magnetizations of Mn3+ and Mn4+ ( and ), their staggered magnetizations ( and ) and the Edwards-Anderson order parameter are defined by
| (3) | |||||
| (4) | |||||
| (5) |
where the sum is taken over Mn3+ () or Mn4+ () with being the number of spins of each kind. Note that is calculated by first taking the time average of each spin and secondly taking the spatial average over all spins. This parameter is used to calculate the freezing degree of the spins when a long-range ordering is absent or the nature of ordering is unknown such as in spin glasses or in disordered systems Ngo2014 ; EdwardsAnderson ; BinderYoung ; Mezard .
For La0.7Sr0.3MnO3 magnetic ions Mn3+ and Mn4+ have concentrations 0.70 and 0.30, respectively Kallel . Hereafter, we study this “mother” compound and the case where Ti ions replace a fraction of Mn4+. Note that in our procedure, we first generate the pure state (Mn3+ only) which is the fully antiferromagnetic state which has the site ’parity’. Then we replace Mn3+ by Mn4+ at randomly chosen sites with a concentration of 0.3. In doing so we conserve the site ’parity’ because we do not exceed the percolation limit for the simple cubic structure. This is the reason why we define the staggered magnetization which is useful for detecting an antiferromagnetic phase. Of course, this is artificially created state but physically the results will not change if we have large domains of Mn3+ in the compound. The substitution of Mn4+ by Ti is next performed also at randomly chosen Mn4+ ions.
III Results
III.1 Properties of La0.7Sr0.3MnO3
Let us examine first the case without Ti doping in order to have an idea about the role of each interaction , , and .
As said earlier, experiments found that dominates and gives rise to the ferromagnetic ordering up to very high temperatures K Kallel . For , we have fitted the MC transition temperature with experimental value K using the mean-field approximation:
| (6) |
where is coordination number (all occupied neighbors) and the effective spin value calculated from . Putting K, we obtain K. Note that in magnetic materials with Curie temperatures at room or higher temperatures the effective exchange interaction is of the order of several dozens of Kelvin Magnin2012 , just as what we found here. It is not easy to determine each of the exchange interactions defined earlier. Fortunately, we know that is much larger than the other interactions Kallel . Writing in the mean-field spirit and taking, after comparing our calculated magnetizations with several trying values of , and we find the best fits of magnetizations obtained with , as shown below. The best estimated values of the main exchange interactions are K and K. We will take K for all calculations and we will discuss below the effects of since this parameter is found to be more relevant than the other two.
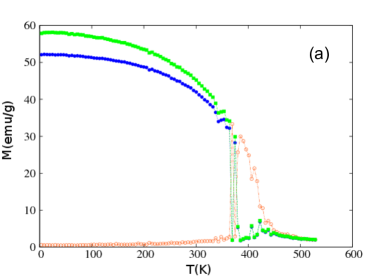
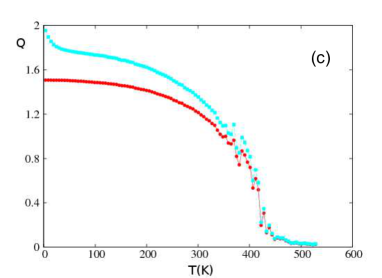
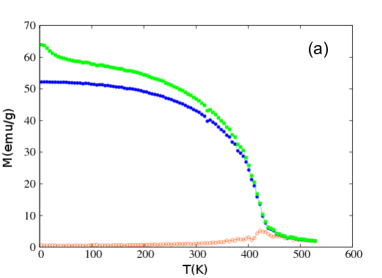
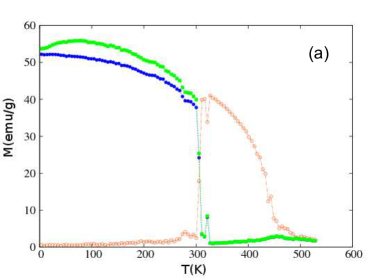
We show in Fig. 1 the total magnetization (green squares) and the sublattice magnetizations and sublattice staggered magnetizations . We calculated the magnetization in the simulation using parameters representing the magnetic moments of Mn3+ and Mn4+. We next fit our values found with simulations at the lowest with values found experimentally (see for example experimental data in the references Kallel ; Kallel1 ; Kallel2 ; Kallel2010 ). The unit used for magnetizations in this paper (emu/g) is by this fit. Several remarks on Fig. 1 are in order:
(i) shows a transition at K
(ii) The magnetizations of Mn3+ and Mn4+ vanish rather abruptly at that temperature. This suggests that the transition may be weakly of first order.
(iii) Surprisingly, the staggered magnetizations become non zero for up to K. This indicates that an antiferromagnetic ordering appears above the ferromagnetic phase.
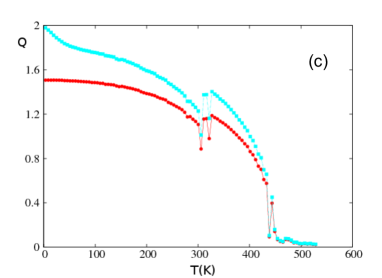
(iv) The Edwards-Anderson order parameters show “strong fluctuations” at and above K. The fact that is not zero between 369 K and 427 K means that there is a phrase which is not paramagnetic. However alone cannot determine the nature of the ordering. The non-zero staggered magnetization in this temperature zone helps confirm an antiferromagnetic phase.
(v) At very low , the antiferromagnetic interaction between Mn3+ affects its magnetization behavior: weak values (smaller than -0.20 K) keep the ferromagnetic ordering near [Fig. 1(b)] but induces a reduction of in Fig. 1(c). This reduction is a signature of some dynamical motion of Mn3+. We return to this point later while showing results with other values of . Note that does not affect the magnetization and of Mn4+.
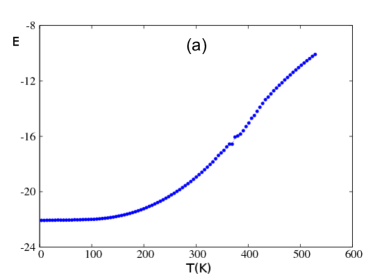
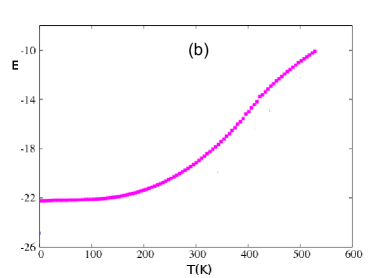
To show that the phase transition at K is of first-order, we show in Fig. 2(a) the energy versus using the same parameters as those of Fig. 1, namely K, K. We observe a discontinuity at 369 K. For comparison, we show in Fig. 2(b) the case where is smaller, K. We observe that the transition temperature is very sensitive to : it moves to 422 K.
We have made several simulations to search for the parameter(s) responsible for the antiferromagnetic phase: we find that the value of does not affect neither the antiferromagnetic phase nor the value of as long as it is of the order of K. This is easily understood because the concentration of Mn4+ is small (30%) so that the number of NN pairs of Mn4+ with interaction not intercalated by Mn3+ is negligible.

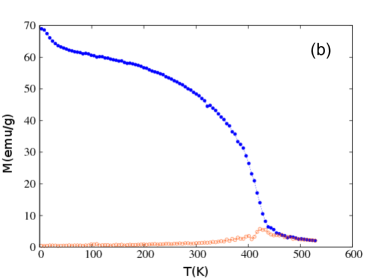
We have checked that the antiferromagnetic phase disappears if the antiferromagnetic interaction between Mn3+ is small. Figure 3 shows no antiferromagnetic phase for K. This is not surprising because the antiferromagnetic order does not survive at high with such small .
The disappearance of the antiferromagnetic phase can come also from the Mn3+ concentration: by symmetry argument, if the concentrations of Mn3+ and Mn4+ are 50% each, then each Mn3+ is surrounded in most cases by Mn4+ and vice-versa. As a consequence, there are no rooms for a sufficient number of antiferromagnetic pairs of Mn3+-Mn3+ and Mn4+-Mn4+. This prevents an overall antiferromagnetic ordering to occur. When the concentrations are not symmetric such as 70%-30% there are always domains of the majority spins which are antiferromagnetically coupled, leading to antiferromagnetic phase above the ferromagnetic phase. This antiferromagnetic phase, if it exists in La0.7Sr0.3MnO3, has not been experimentally observed. An example with 60% Mn3+ is shown in Fig. 4: the antiferromagnetic phase exists but in a region narrower than that for 70%. We have verified that if the concentration of Mn3+ becomes smaller than 0.55, there is no more antiferromagnetic phase above the ferromagnetic phase. At this stage, it is worth noting that in spin glasses that weak disorder can cause a second phase above the spin-glass phase. An example is the Ising spin glass: if the percentage of bonds is large with respect to that of then the antiferromagnetic phase exists above the spin-glass phase in a region called reentrance Ngo2014 ; BinderYoung . We will take K for the results shown below with Ti substitutions at , 0.2 and 0.25.
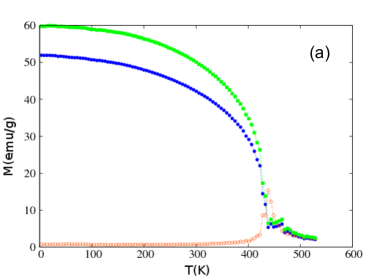
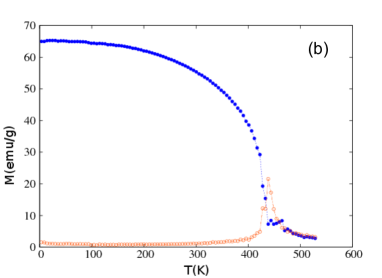
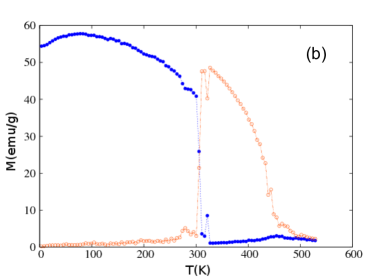
Figure 5 shows the results simulated with a large value of , namely -0.40 K, twice larger than the value used in Fig. 1. As expected, the abrupt character of the transition increases and the antiferromagnetic phase becomes stronger in a larger temperature range. Note the strong variation of at the transition from ferromagnetic to antiferromagnetic phase. Furthermore, at this strong value of , there are at low a number of antiferromagnetic NNN pairs which ’resist’ the strong ferromagnetic Mn3+-Mn4+ coupling. This yield a reduction of the Mn3+ magnetization at low ( 100 K) as seen in Fig. 5(b). As already commented in remark (v) on Fig. 1, this instability is signaled by a reduction of in this low- region. By comparing the values at low for three cases with increasing : emu/g for K [Fig. 3(b)], emu/g for K [Fig. 1(b)] and emu/g for K [Fig. 5(b)], we conclude that even the ferromagnetic ordering dominates the compound at low , the stronger yields a smaller magnetization of Mn3+. However, this reduction of magnetization at low is weakened at higher : the curvature of shows a decreasing tendency with increasing for K.
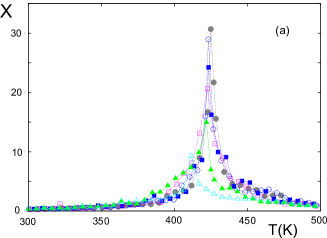
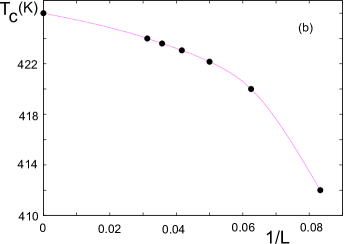
Let us in Fig. 6 how we determine in order to establish a phase diagram in the parameter space ( where is the concentration of Mn3+. As said in the previous section, we have carried out most simulations with the lattice size because from this size up, finite-size effects are not strong. There are two error estimations: the first one consists of making many runs in the critical region using temperature steps as small as 2 K. The peak of the susceptibility is identified with error K. The second error estimation consists of making runs with differently generated disordered samples: we observed that changes in an interval of K. So the error over disorder is K around the median value. Fortunately, this error includes the error due to discrete temperature steps. We show in Fig. 6 an example of finite-size effects for K, K and K. This case is an easy one due to the absence of the antiferromagnetic case. The sizes used are , 16, 20, 24, 28 and 32. In spite of small , the susceptibility has strong fluctuations around each peak. The peak positions can be recognized without difficulty. For curve presentation we used the most typical runs, namely the ones which correspond to the mean values of at each size. The error bars around each point are . The extrapolated point at the infinite size is K. The peak temperatures are displayed in Fig. 6(b). Note that we should not use the peak heights for finite-size scaling to calculate critical exponents because the discretized temperatures do not allow one to localize the peak height with a high precision. To do that we should use continuous-temperature methods such as histogram MC techniques which give the exact peak (position and height) at (see for example Ngo-Diep2007 ).
The full diagram is shown in Fig. 7. This phase diagram is easily understood: near 50% each of Mn3+ is surrounded by Mn4+ ions so that antiferromagnetic interactions between Mn3+ or between Mn4+ are almost absent, there is thus no antiferromagnetic phase. Now, for larger concentrations near 100%, the ferromagnetic phase disappears leaving the place for an antiferromagnetic phase because the number of Mn4+ ions is so small, not sufficient to induce a ferromagnetic order: the system is then composed of Mn3+ with weak antiferromagnetic interaction between them. This induces an antiferromagnetic phase at very low temperatures. Let us give the value of the temperature at the ferromagnetic transition for several values of Mn3+ concentration : K for 50% and 55% (large errors are due to large disorder at these concentrations). From 60% the system undergoes the ferromagnetic transition at K for 60%, 369 K for 70%, K for 80% and K for 90%. However, for concentrations from 60% to 90%, the antiferromagnetic ordering sets in above up to 444 K (for 60%), 427 K (for 70%) and 380 K (for 80%). For 90%, only the antiferromagnetic phase exists.
We emphasize here that the phase diagram in Fig. 7 is shown for K, K. If is smaller, say K, the antiferromagnetic phase above the ferromagnetic phase disappears as seen in Fig. 3 for . We have checked the absence of the antiferromagnetic phase at other Mn3+ concentrations (not shown), except naturally the one in the zone .

At this stage, we would like to recall that the existence of a partially-disordered antiferromagnetic phase above the ferromagnetic phase is frequently seen in many frustrated systems DiepFSS . For example, in exactly solved frustrated Ising models such as the honeycomb lattice Diep-hc Kagomé lattice Diep-Kago among others DiepSQ , it has been shown that the transition from the ferromagnetic phase to an antiferromagnetic phase takes place via a very narrow intermediate paramagnetic phase called “reentrant phase”. When this reentrance is not possible, the direct transition between the ferromagnetic and the antiferromagnetic phases should be of first-order because one of these two phases is not a symmetry subgroup of the other as in second-order phase transitions. A direct ferromagnetic-antiferromagnetic first-order transition has been seen in Ref. Diepbcc, . The model simulated here has a strong disorder due to the random mixing of Mn3+ and Mn4+ so that we cannot deal with it analytically, but competing interactions included in the model (ferromagnetic , antiferromagnetic and ) can cause the ferromagnetic-antiferromagnetic transition. The abrupt change of the total magnetization and the staggered magnetization observed at the transition shown in Figs. 1 and 5 suggest a direct transition with a first-order character.
III.2 Properties of La0.7Sr0.3MnMnTixO3
In this doped material, Ti atoms replace a fraction of Mn with varying from 0 to . Since Ti is non magnetic, the substitution introduces a dilution. Let us take into account interactions , and between Mn ions as defined above. In addition, we have added a very small ferromagnetic interaction between Mn3+ NNN.
While there is no experimental proof so far on the existence of the antiferromagnetic phase above , we choose to study the effect of Ti substitution at K hereafter (larger induces an AF phase as seen above). The agreement with experiments justifies this choice.
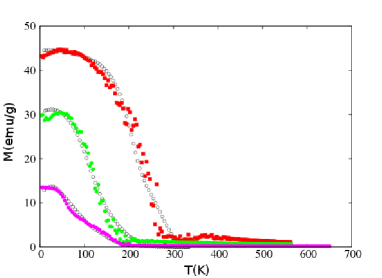
Using K, K we have simulated this system with several values of : 0.1, 0.2 and 0.25. The reason why we did not take is because at this dilution, there is no more Mn4+ in the system so that there is no Mn3+- Mn4+ interaction, namely no ferromagnetic phase. Experiments have been carried out at this concentration but we believe that there remains a small number of Mn4+ in the material as it has been noticed by Jonker and Van Santen Jonker . Not surprisingly, our results for agree very well with experimental observations for . The full results of the magnetization with applied magnetic field Tesla are shown in Fig. 8 to compare with experiments at the same field Kallel . Let us comment these results: (i) the overall agreement with experiments is excellent, given the fact that no other parameter adjustments were necessary (we used only exchange parameters while fitting with as described above), (ii) the slight down-turn curvature at very low is sensitive to : smaller will suppress this but then the agreement is less perfect at higher temperatures.
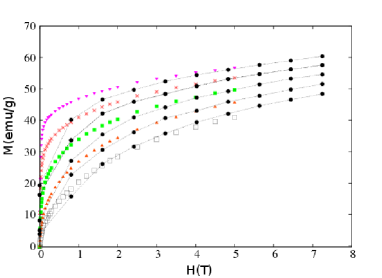
We have also calculated at five temperatures the total magnetization as a function of the applied magnetic field . These results are shown in Fig. 9 together with experimental data taken from Ref. Kallel2010, . A good agreement is observed except at very low fields where precision of parameters and experimental details of lattice structure and disorder play certainly an important role.
At this point, we would like to emphasize that doping La0.7Sr0.3MnMnO3 with other ions such as Ni can alter magnetic structures in a drastic way such as domains with different lattice deformations and creation of ferromagnetic clusters which change the low- behaviors Feng . We believe that strong Ti-substitution also induces these aspects but probably in a less drastic manner. The good agreement obtained above without introducing such factors may be a proof of the absence of complicated structure deformations.
Before closing this section, let us mention that our present model can also be used to study the case where a number of La is substituted by magnetic Ce3+ ions of spin : Ce occupy the centered sites of the bcc lattice. Additional interactions between Ce3+ ions and Mn3+ and Mn4+ have to be introduced. Experiments have been performed on La0.56Ce0.14Sr0.3MnO3 Kallel2009 ; Kallel2010a . Work is under way to explain by MC simulations magnetic behaviors observed in this system.
IV Conclusion
Perovskite compounds La0.7Sr0.3MnMnO3 have very rich magnetic behaviors when substituting Mn ions with other non magnetic atoms. In this paper we have studied this compound without and with Ti substitution by the use of MC simulations. Fitting only the experimental value of the critical temperature K in the case of non substitution, we have estimated various exchange interactions of which the ferromagnetic one between Mn3+ and Mn4+ is dominant ( K). The other interaction which is though small but plays an important role is between Mn3+ ( K): it is at the origin of an antiferromagnetic phase observed in a small temperature region above . This phase diminishes progressively with decreasing and disappears when becomes smaller (see Fig. 3 for K, for example). Experiments did not see this phase. There are two possible explanations. The first one is that experiments have overlooked it because experimental techniques used so far were not suitable to detect an antiferromagnetic ordering. The second explanation is that if the value of in experimental samples is smaller than -0.20 K then the antiferromagnetic phase does not exist as shown above.
We have also investigated the effect of Ti substitution on the magnetization as a function of at several substitution concentrations. Our results on the magnetization agree remarkably with experiments over the whole range of temperature, showing that the estimated parameters are precise enough to reproduce experimental data at several substitution concentrations (Fig. 8). For the field effect, our results agree with experiments except at very low fields where there may be many other finer aspects such as a possible existence of magnetic domains, impurity clusters, etc. in real crystals which should be taken into account.
Acknowledgements.
SY acknowledges a financial support from the Ministry of Education of Tunisia. She is grateful to the University of Cergy-Pontoise for hospitality where this work has been accomplished. The authors are thankful to Dr. A. Ben Lamine for a critical reading of the manuscript.References
- (1) J. Zinn-Justin, Quantum Field Theory and Critical Phenomena, Oxford Unversity Press (2002).
- (2) H. T. Diep, Statistical Physics: Fundamentals and Application to Condensed Matter, Word Scientific, New Jersey (2015).
- (3) E. Dagotto, T. Hotta, and A. Moreo, Phys. Rep. 344, 1 (2001).
- (4) T. Hotta, A. Feiguin, and E. Dagotto, Phys. Rev. Lett 86, 4922 (2001).
- (5) E. Dagotto, Science 309 (2005) 257, N. Nagaosa and Y. Tokura, Science 288, 462 (2000).
- (6) M. S. Kim, J. B. Yang, Q. Cai, X. D. Zhou, W. J. James, W. B. Yelon, P. E. Parris, D. Buddhikot and S. K. Malik, Phys. Rev. B 71, 014433 (2005).
- (7) M. B. Salamon, M. Jaime, The physics of manganites: structure and transport, Rev. Mod. Phys. 73, 583 (2001).
- (8) X. Zhu, U. Yuping, X. Luo, L. Hechang, W. Bosen, S. Wenhai, Y. Zhaorong, D. Jianming, SH. Dongqi, D. Shixue, J. Magn. Magn. Mater. 322, 242 (2010).
- (9) R. Von Helmolt, J. Wecker, B. Holzapfel, L. Schultz, K. Samwer, Phys. Rev. Lett. 71, 2331 (1993).
- (10) G. H. Jonker, J. H. Van Santen, Physica 16, 337 (1950).
- (11) C. Zener, Phys. Rev. 81, 440 (1951).
- (12) C. Zener, Phys. Rev. 82, 403 (1951).
- (13) C. Zener, Phys. Rev. 83, 299 (1951).
- (14) C. S. Hong, N. H. Hur, Y. N. Choi, Solid State Com. 131, 779 (2004).
- (15) E. Bose, S. Karmakar, B. K. Chaudhuri, S. Pal, Solid State Com. 145, 149 (2008).
- (16) N. Furukawa, Y. Motome, Appl. Phys. A, 74, 1728 (2002).
- (17) A. Urushibara, Y. Moritomo, T. Arima, A. Asamitsu, G. Kido, Y. Tokura, Phys. Rev. B 51, 14103 (1995).
- (18) T. Hotta, E. Dagotto, Phys. Rev. B 61R, 11879 (2000).
- (19) E. Restrepo-Parra, C. D. Salazar-Enriquez, J. Londono-Navarro, J. F. Jurado, J. Restrepo, J. Magn. Magn. Mater. 323, 1477 (2011).
- (20) N. Kallel, G. Dezanneau, J. Dhahri, M. Oumezzine, H. Vincent, Structure, magnetic and electrical behaviour of La0.7Sr0.3Mn1xTixO3 with , J. Magn. Magn. Mater. 261, 56 (2003).
- (21) N. Kallel, K. Frhlich, M. Oumezzine, M. Ghedira, H. Vincent, and S. Pignard, Magnetism and giant magnetoresistance in La0.7Sr0.3Mn1xMxO3 (M = Cr, Ti) systems, Phys. Stat. Sol. (c) 1, 1649 1654 (2004).
- (22) N. Kallel, M. Oumezzine, H. Vincent, Neutron-powder-diffraction study of structural and magnetic structure of La0.7Sr0.3Mn1xTixO3 ( = 0, 0.10, 0.20, and 0.30), J. Magn. Magn. Mater. 320, 1810 (2008).
- (23) S. Kallel, N. Kallel, O. Pen̆a and M. Oumezzine, Large magnetocaloric effect in Ti-modified La0.70Sr0.30MnO3 perovskite, Materials Letters 64, 1045 (2010).
- (24) J. B. Goodenough, A. Loeb, Phys. Rev. 98, 391 (1955).
- (25) J. B. Goodenough, Magnetic Properties of Perovskites, Londolt-Bornstein Tabellen, Springer-Verlag, Berlin (1962).
- (26) J. Kanamori, J. Phys. Chem. Solids 10, 87 (1959).
- (27) I. Solovyev, N. Hamada, K. Terakura, Phys. Rev. Lett. 76, 4825 (1996).
- (28) Y. -S. Su, T. A. Kaplan, S. D. Mahanti, J. F. Harrison, Phys. Rev. B 61, 1324 (2000).
- (29) E. Bîrsan, J. Magn. Magn. Mater. 320, 646 (2008).
- (30) P. W. Anderson, H. Hasegawa, Phys. Rev. 100, 675 (1955).
- (31) H. T. Diep, Theory of Magnetism: Application to Surface Physics, World Scientific, New Jersey (2014).
- (32) N. Metropolis, A. W. Rosenbluth, M, N, Rosenbluth, and A. H. Teller, J. Chem. Phys. 21, 1087 (1953).
- (33) V.-Thanh Ngo, D.-Tien Hoang, H. T. Diep and I. A. Campbell, Effect of Disorder in the Frustrated Ising FCC Antiferromagnet: Phase Diagram and Stretched Exponential Relaxation, Modern Phys. Lett. B 28, 1450067 (2014).
- (34) S. F. Edwards and P. Anderson, J. Phys. F 5, 965 (1975).
- (35) K. Binder and A. P. Young, Rev. Mod. Phys. 58, 801 (1986).
- (36) M. Mézard, G. Parisi and M. Virasoro, Spin Glass Theory and Beyond, World Scientific, New Jersey (1987).
- (37) See Y. Magnin and H. T. Diep, Monte Carlo Study of Magnetic Resistivity in Semiconducting MnTe, Phys. Rev. B 85, 184413 (2012) and experimental works cited therein.
- (38) V. Thanh Ngo and H. T. Diep, Effects of Frustrated Surface in Heisenberg Thin Films, Phys. Rev. B 75, 035412 (2007).
- (39) H. T. Diep (Ed.), Frustrated Spin Systems, 2nd edition, World Scientific, New Jersey (2013).
- (40) H. T. Diep, M. Debauche and H. Giacomini, Exact solution of an anisotropic centered honeycomb Ising lattice: Reentrance and Partial Disorder, Phys. Rev. B (rapid communication) 43, 8759 (1991).
- (41) M. Debauche, H. T. Diep, H. Giacomini and P. Azaria, Exact Phase Diagram in a generalized Kagomé Ising lattice: Reentrance and Disorder Lines, Phys. Rev. B 44, 2369 (1991).
- (42) M. Debauche and H. T. Diep, Successive Reentrances and Phase Transitions in exactly solved dilute centered square Ising lattices, Phys. Rev. B 46, 8214 (1992); H. T. Diep, M. Debauche and H. Giacomini, Reentrance and Disorder Solutions in Exactly Solvable Ising Models, J. Mag. Mag. Mater. 104-107, 184 (1992).
- (43) P. Azaria, H. T. Diep and H. Giacomini, First order transition, multicriticality and reentrance in a BCC lattice with Ising spins, Europhys. Lett. 9, 755 (1989).
- (44) J.-W. Feng, C. Ye and L.-P. Hwang, Phys. Rev. B 61, 12271 (2000).
- (45) N. Kallel, S. Kallel, O. Pen̆a, M. Oumezzine, J. Solid State Sci. 11, 1494 (2009).
- (46) S. Kallel, N. Kallel, A. Hagaza, O. Pen̆a and M. Oumezzine, J. Alloys and Compounds 492, 241 (2010).