Exploratory Chandra observation of the ultraluminous quasar SDSS J010013.02+280225.8 at redshift 6.30
Abstract
We report exploratory Chandra observation of the ultraluminous quasar SDSS J010013.02+280225.8 at redshift 6.30. The quasar is clearly detected by Chandra with a possible component of extended emission. The rest-frame 2-10 keV luminosity is 9.0 1045 erg s-1 with inferred photon index of = 3.03. This quasar is X-ray bright, with inferred X-ray-to-optical flux ratio , higher than the values found in other quasars of comparable ultraviolet luminosity. The properties inferred from this exploratory observation indicate that this ultraluminous quasar might be growing with super-Eddington accretion and probably viewed with small inclination angle. Deep X-ray observation will help to probe the plausible extended emission and better constraint the spectral features for this ultraluminous quasar.
Subject headings:
quasar: individual: SDSS J010013.02+280225.81. Introduction
A large number of quasars at redshifts of have been discovered, selected with a combination of optical and near-infrared colors (Mortlock et al., 2011; Venemans et al., 2013; Jiang et al., 2015; Wang et al., 2016). These sources are powerful probes of the cosmic reionization (Fan et al., 2006) and offer insights into the process by which massive black holes formed and grew in early universe. Recently, Wu et al. (2015) reported the discovery of SDSS J010013.02+280225.8 (hereafter J0100+2802), an ultraluminous quasar with an estimated black hole mass of 12 billion solar masses. With the highest black hole mass and the highest luminosity among all quasars discovered at , it sets the tightest constraints on models for the massive black hole growth and evolution at early epochs (e.g. Shankar et al., 2009; Volonteri, 2010).
X-ray emissions from quasars reveal the conditions in the innermost regions of their accretion-disk corona, and provide information about how the black hole is fed. There are tentative evidences that high-redshift quasars have relatively soft X-ray spectra, indicating that the black holes are accreting near or above the Eddington rate (Grupe et al., 2006; Page et al., 2014), although debates exist (e.g. Just et al., 2007; Moretti et al., 2014). Mildly super-Eddington intermittent accretion may significantly ease the problem of assembling the massive black holes when the universe was young (Madau et al., 2014). Furthermore, high-redshift quasars, such as the known blazars at (Romani et al., 2004; Frey et al., 2010; Sbarrato et al., 2013; Ghisellini et al., 2015), may have powerful jet, which provide a means by which the black hole accretes at a rate that breaks the Eddington limit (Ghisellini et al., 2013). The extended lobes produced by jets may be strong in X-ray, rather than in radio, as the dramatic boosts in the energy density of the cosmic microwave background (CMB) causes inverse Compton scattering to dominate energy losses of relativistic electrons (Fabian et al., 2014).
X-ray observation of J0100+2802 provides a crucial test for understanding the formation of the most massive black holes in the early universe. In this letter we report our exploratory Chandra observation of this ultraluminous quasar. Throughout this paper, we adopt the cosmology parameters from Planck Collaboration (2014): = 0.315, = 0.685, and = 67.3 km s-1. We define power law photon index such that N(E) E-Γ. For the Galactic absorption of SDSS J0100+2802, which is including in the model fitting, we use the value of = 5.82 cm-2(Kalberla et al., 2005). All uncertainties are given at 1, unless otherwise specified.
2. Chandra observation and data analysis
We obtained Chandra observation of SDSSJ0100+2802 on 2015 October 16 using the Advanced CCD Imaging Spectrometer (ACIS, Garmire et al., 2003) instrument. The total integration time is 14.8 ks. The target was positioned on the ACIS-S3 chip, which was operated in time-exposure mode, with faint telemetry format. The data were processed with standard CIAO version 4.7 (Fruscione et al., 2006), and only events with grades of 0, 2, 3, 4, and 6 were considered in the analysis. No background flares are present in the observation. We restrict to the derived X-ray counts in the observed-frame of 0.5-7 keV, considering the increasingly uncertain quantum efficiency of ACIS at lower energies and the steeply increasing background at higher energies.
We first carried out source detection with CIAO task WAVDETECT using wavelet transforms (with wavelet scale sizes of 1, 2, 4, 8 and 16 pixels) and a false-positive probability threshold of 10-6. The quasar is detected at equatorial coordinates of 01:00:13.038, +28:02:25.75. The X-ray position differs from its optical position by 0.1 arcsec, within the radius (0.6 arcsec) of 90% uncertainty circle of Chandra ACIS absolute position111http://cxc.cfa.harvard.edu/cal/ASPECT/celmon/. At a distance of 28 to the northeast of J0100+2802, an X-ray source is detected with 7.92.8 net counts (Figure 1). This source is classified as a galaxy in the SDSS DR12 catalog with photometric redshift of 0.520.13 (Alam et al., 2015), therefore it is likely to be a low luminosity AGN in the foreground.
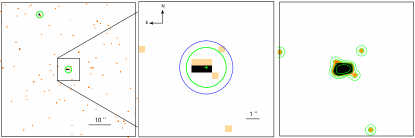
In the image rebinned to 0.1 ACIS pixels and smoothed with a 0.492 Gaussion filter, the spatial distribution for J0100+2802 appears somewhat elongated (Figure 1). To measure the extension of this source we use CIAO tool ‘srcextent’. While, due to the limited source counts of 14 to 15, no conclusive result is returned. We then manually extract the photometry of J0100+2802 and found 14 counts within a 3 pixel () radius aperture, which corresponds to 94.7% and 89.2% of the encircled energy fraction in 0.5-2 keV and 2-7 keV, respectively222estimated with the CIAO tool SRC_PSFFRAC. There is one more count detected at energy of 1.73 keV within the 4 pixel radius aperture (Figure 1). According to the point-spread function at the source position, the expected count in Poisson statistics is 0.16 in the annulus with radii of 3 and 4 pixel, and 0.78 outside of the aperture with radius of 3 pixel. That is, the chance of this photon belong to the quasar J0100+2802 is 14%-36%. Thus for J0100+2802 we restrict subsequent analysis to the detected photons within the 3 pixel radius aperture. The average background level, estimated from an annulus in the source position with inner and outer radii of 15 and 20 arcsec, in an aperture of the source size is 0.06 in 0.5-2 keV and 0.05 counts in 2-7 keV.
For J0100+2802, the full-band (0.5-7 keV) X-ray counts are 13.9, with 11.9 in soft band (0.5-2 keV) and 2.0 in hard band (2-7 keV). The errors of the X-ray counts were computed according to Gehrels (1986). The hardness ratio, estimated with Bayesian method333http://hea-www.harvard.edu/astrostat/behr/ (Park et al., 2006), is , indicating that the X-ray spectrum of J0100+2802 is soft. The inferred effective photon index from the hardness ratio is indeed large, at , estimated with Xspec (v.12.9; Arnaud, 1996) and the latest calibration files.
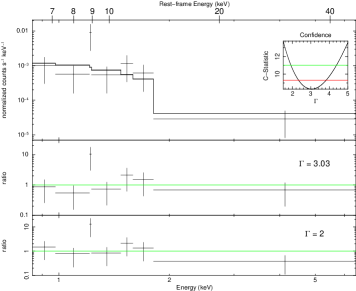
We then perform basic spectral analysis for the quasar. The source spectrum, background spectrum, response matrix files (RMF) and auxiliary matrix files (ARF) are built using the CIAO script SPECEXTRACT. The spectrum is grouped with a minimum of 2 counts per bin. Given that there is only net counts, we fitted the spectrum using XSPEC with a simple power law model and fixed Galactic absorption. The C-statistic (cstat) was used due to the limited photon counts (Cash 1979). The best fit photon index is = 3.03, with cstat = 8.31 for 5 degrees of freedom. We also perform Montecarlo simulations using the exposure time and response matrices, and fit the simulated one thousand spectra with the same model as above. The value of inferred photon index is consistent with that from hardness ratio and best fit, with mean value of 3.13 and standard deviation of 0.71.
The best fit results and confidence curve for the photon index are shown in Figure 2. As a comparison, we also show the fitted spectrum with fixed photon index of 2.0, the typical value found for quasars. From the data to model ratios we can see that the model with soft spectral index of 3.03 improves the fitting at the most soft and hard energy bands. The rest-frame 2-10 keV luminosity implied by the best fit is 9.0 1045 erg s-1. There is significant residual at 1.2 keV (8.8 keV at rest-frame). There is no known spectral feature at this energy in quasars, and more counts are needed to investigate the nature of this excess.
We label the detected energy and receiving time of each photon in Figure 3. There are 4 photons detected between 1.207 keV and 1.228 keV. This unusual feature causes the significant residual at 1.2 keV in the spectral fitting (Figure 2). Figure 3 also shows the light curve of J0100+2802 with time bin size of 3 ks. There are 9 photons detected in the first 3 ks bin, while in the middle 6 ks interval no photon is detected, with 99% confidence upper limit of 4.605 (Gehrels, 1986). We first test the variation by analyzing the photon arrival time using the Gregory-Loredo algorithm (Gregory & Loredo, 1992) with CIAO tool GLVARY. The returned variability probability is P 0.967, and the variability index is 6 from the test. We then test the chance for a random event of detecting 9 photons in one of the five bins for the total 14 photons with simulation. The chance is 186 in the 105 simulated light curves, corresponding to the probability of 0.019%. Longer exposure observations are needed to investigate this possible variability.

To investigate the broad band properties of J0100+2802 we calculate the X-ray-to-optical spectral energy distribution parameter, , the slope of a nominal power law between 2500 Å and 2 keV in the rest frame [= 0.384log, where is the flux density at 2 keV and is the flux density at 2500 Å]. For J0100+2802, rest frame 2500Å moves to the near-infrared at 18250 Å in the observed frame, falling in the gap between H and K bands as shown in Figure 3 in Wu et al. (2015). Using the ultraviolet-optical continuum slope measured in Wu et al. (2015) we estimate the flux density at 2500 Å to be 3.04 0.45 erg s-1 cm-2 Å-1. An energy of 2 keV in the rest frame of J0100+2802 corresponds to 0.273 keV in the observed frame. This energy is poorly sampled by ACIS. We compute the 0.273 keV flux and the uncertainty from the best fit power law model in XSPEC spectral fitting. This yields a value for of , with errors dominated by the uncertainty of the rest-frame 2 keV flux.
3. DISCUSSION
The ultraluminous quasar J0100+2802 is strongly detected in our exploratory Chandra observation with 14 counts, We find that the X-ray properties of this quasar to be unusual in several aspects.
First, there is a hint of extended emission, and this feature comes from photons in relatively soft energy bands. As first proposed in Fabian et al. (2014), relativistic electrons in powerful jetted objects with Lorentz factor can upscatter CMB photons into the soft X-ray band. Deeper XMM-Newton observation, which has much higher soft X-ray sensitivity compared to Chandra, would be ideal to investigate the possibility of this extended emission.
Second, the X-ray spectrum of J0100+2802 is very soft with inferred photon index of 3.03, where the mean value of the X-ray photon index found in the samples of low- and high-redshift quasars is 1.89 2.19 (i.e., Piconcelli et al., 2005; Just et al., 2007; Young et al., 2009). Although there are still debates about whether the X-ray spectrum of high-redshift quasars significantly differs from that of quasars at lower redshifts (Just et al., 2007; Grupe et al., 2006), we note that the highest redshift quasar ULAS J1120+0641 may also exhibits a soft X-ray spectrum with photon index of (Page et al., 2014, see Moretti et al. 2014 for a different value of inferred ). It has been suggested that the soft X-ray spectrum is an indication that the central massive black holes at early epochs are growing at high accretion rate (Pounds et al., 1995; Leighly, 1999).
The inferred can be used as an estimator of by using the linear correlation between and log(), where is bolometric luminosity and is Eddington luminosity (Shemmer et al., 2008; Risaliti et al., 2009; Jin et al., 2012; Brightman et al., 2013; Yang et al., 2015). Using different relations presented in the literatures, we find that the corresponding for J0100+2802 has minimum value of 6 (Risaliti et al., 2009), and can be significantly higher (i.e., Shemmer et al., 2008). If those relations did apply to J0100+2802, it could be accreting at significantly above the Eddington rate. Mildly super-Eddington accretion corresponds to a shorter e-folding timescale for black hole mass growth, which can ease the problem of assembling massive black holes out of stellar-mass seeds at early times even in the case of intermittent accretion (Madau et al., 2014).
Third, J0100+2802 has a relatively higher X-ray to optical flux ratio, compared to those found in other quasars of comparable ultraviolet luminosity (Figure 4). It is well established that the X-ray-to-optical power-law slope parameter of quasars significantly correlate with the ultraviloet 2500 Å monochromatic luminosity (, Steffen et al. 2006; Just et al. 2007). According to the – relation given by Just et al. (2007), a value of is expected for J0100+2802, compared to be the value of = obtained from Chandra observation. The observed large could be due to the inferred steep X-ray photon index, which is still not well constrained based on current S/N of the data. While, even if we adopt a flat X-ray spectral shape with the X-ray photon index of nominal 2.0 to infer the rest-frame 2 keV flux for J0100+2802, the derived is , is still larger than the average and is at upper envelop of the observed values at the comparable ultraviolet luminosity (Figure 4). However, the value of for J0100+2802 is still in the range of the ones found in the quasars at low to median redshift, supporting the no evolution of with redshift (Brandt et al., 2002; Just et al., 2007; Risaliti & Lusso, 2015)
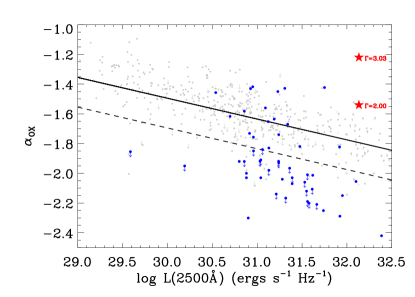
J0100+2802 is a weak-line quasar with rest-frame equivalent width of the Ly (Wu et al., 2015). Weak-line quasars (WLQs) are a subclass of radio-quiet quasars that have almost extremely weak or undetectable emission lines (e.g. Fan et al., 1999; Meusinger & Balafkan, 2014, and references therein). The nature of WLQs is still under investigation, although a number of hypotheses have been proposed, such as abnormal broad emission line region with significant deficit of line-emitting gas (e.g., Shemmer et al., 2010) or in an early evolutionary stage of formation (e.g., Hryniewicz et al., 2010), a soft ionising spectral energy distribution due to intrinsic X-ray weakness (e.g., Leighly et al., 2007) or due to small-scale absorption (e.g., Wu et al., 2012; Luo et al., 2015). Significant fractions () of the WLQs are distinctly X-ray weak compared to typical quasars (Shemmer et al., 2009; Wu et al., 2012; Luo et al., 2015). Our results demonstrate that J0100+2802 is definitely not an X-ray weak WLQ, as shown in Figure 4. If we interpret J0100+2802 in the scenario proposed by Wu et al.(2012) and Luo et al.(2015), in which they unified X-ray weak and X-ray normal WLQs by orientation effect with proposed ‘shielding-gas’, this quasar should be viewed at a small inclination angle.
Finally, we detect a hint of X-ray variability for J0100+2802 within our exposure. For high-redshift quasar at this luminosity, its X-ray flux is not expected to vary at the timescale of ks unless beaming is involved. Given that the light crossing time of even the Schwarzschild radius for a 12 billion black hole is much longer than 10 ks, the X-ray flux of J0100+2802 is not expected to vary in our observations unless strong beaming is involved. Deeper XMM-Newton observation will help to better constrain the spectral features, probe the extended emission and investigate the variability on both short (1 hr) and longer (months to year) timescales for this ultraluminous quasar.
References
- Alam et al. (2015) Alam, S., Albareti, F. D., Allende Prieto, C., et al. 2015, ApJS, 219, 12
- Arnaud (1996) Arnaud, K. A. 1996, in Astronomical Society of the Pacific Conference Series, Vol. 101, Astronomical Data Analysis Software and Systems V, ed. G. H. Jacoby & J. Barnes, 17
- Brandt et al. (2002) Brandt, W.N., Schneider, S.P., Fan, X.H., et al. 2002, ApJ, 569, 5
- Brightman et al. (2013) Brightman, M., Silverman, J. D., Mainieri, V., et al. 2013, MNRAS, 433, 2485
- Fabian et al. (2014) Fabian, A. C., Walker, S. A., Celotti, A., et al. 2014, MNRAS, 442, 81
- Fan et al. (2006) Fan, X., Carilli, C. L. & Keating, B. 2006, ARA&A, 44, 415
- Fan et al. (1999) Fan, X., Strauss, M. A., Gunn, J. E., et al. 1999, ApJ, 526, L57
- Frey et al. (2010) Frey, S., Paragi, Z., Gurvits, L. I., Cseh, D. & Gabányi, K. É., 2010, A&A, 524, A83
- Fruscione et al. (2006) Fruscione et al., 2006, Proc. SPIE 6270, 62701
- Garmire et al. (2003) Garmire, G. P., Bautz, M. W., Ford, P. G. Nousek, J. A. & Ricker, G. R. 2003, Proc. SPIE, 4851, 28
- Gehrels (1986) Gehrels, N. 1986, ApJ, 303, 336
- Ghisellini et al. (2013) Ghisellini, G., Haardt, F., Della, Ceca R., Volonteri, M., & Sbarrato, T. 2013,MNRAS, 432, 2818
- Ghisellini et al. (2015) Ghisellini, G., Tagliaferri, G., Sbarrato, T. & Gehrels, N. 2015, MNRAS, 450, 34
- Gibson et al. (2008) Gibson, R. R., Brandt, W. N., & Schneider, D. P. 2008, ApJ, 685, 773
- Gregory & Loredo (1992) Gregory, P. C. & Loredo, Thomas J. 1992, ApJ, 398, 146
- Grupe et al. (2006) Grupe, D., Mathur, S., Wilkes, B., & Osmer, P. 2006, ApJ, 131, 55
- Hryniewicz et al. (2010) Hryniewicz, K., Czerny, B., Nikołajuk, M.,& Kuraszkiewicz, J. 2010, MNRAS, 404, 2028
- Jiang et al. (2015) Jiang, L., McGreer, I. D., Fan, X., et al. 2015, AJ, 149, 188
- Jin et al. (2012) Jin, C., Ward, M., & Done, C. 2012, MNRAS, 425, 907
- Just et al. (2007) Just, D.W., Brandt, W.N., Shemmer, O., et al. 2007, ApJ, 665, 1004
- Kalberla et al. (2005) Kalberla, P. M. W., Burton, W. B., Hartmann, D., et al. 2005, A&A, 440, 775
- Leighly (1999) Leighly, K. M. 1999, ApJS, 125, 317
- Leighly et al. (2007) Leighly, K. M., Halpern, J. P., Jenkins, E. B., & Casebeer, D. 2007, ApJS,173, 1
- Lyons (1991) Lyons, L. 1991, A Practical Guide to Data Analysis for Physical Science Students (Cambridge: Cambridge Univ.Press)
- Luo et al. (2015) Luo, B., Brandt, W. N., Hall, P. B., et al. 2015, ApJ, 805, 122
- Madau et al. (2014) Madau, P., Haardt, F., & Dotti, M. 2014, ApJ, 784, 38
- Meusinger & Balafkan (2014) Meusinger, H., & Balafkan, N. 2014, A&A, 568, A114
- Moretti et al. (2014) Moretti, A., Ballo, L., Braito, V., et al. 2014, A&A, 563, 46
- Mortlock et al. (2011) Mortlock, D. J., Warren, S. J., Venemans, B. P., et al. 2011, Nature, 474, 616
- Page et al. (2014) Page, M. J., Simpson, C., Mortlock, D. J., et al. 2014, MNRAS, 440, 91
- Park et al. (2006) Park, T., Kashyap, V. L., Siemiginowska, A., et al. 2006, ApJ, 652, 610
- Piconcelli et al. (2005) Piconcelli, E., Jiminez-Bailon, E., Guinazzi, M., et al. 2005, A&A, 432, 15
- Pounds et al. (1995) Pounds, K. A., Done, C., & Osborne, J. P. 1995, MNRAS, 277, L5
- Risaliti et al. (2009) Risaliti, G., Young, M., Elvis M. 2009, ApJ, 700, L6
- Risaliti & Lusso (2015) Risaliti, G., Lusso, E. 2015, ApJ, 815, 33
- Romani et al. (2004) Romani, R.W., Sowards-Emmerd, D., Greenhill, L. & Michelson, P. 2004, ApJ, 610, L9
- Sbarrato et al. (2013) Sbarrato, T., Tagliaferri, G., Ghisellini, G. et al. 2013, ApJ, 777, 147
- Shankar et al. (2009) Shankar, F., Weinberg, D. H., & Miralda-Escudé, J. 2009, ApJ, 690, 20
- Shemmer et al. (2009) Shemmer, O., Brandt, W. N., Anderson, S. F., et al. 2009, ApJ, 696, 580
- Shemmer et al. (2008) Shemmer, O., Brandt, W.N., Netzer, H., Maiolino, R., Kaspi, S. 2008, ApJ, 682, 81
- Shemmer et al. (2010) Shemmer, O., Trakhtenbrot, B., Anderson, S. F., et al. 2010, ApJ, 722, L152
- Venemans et al. (2013) Venemans, B. P., Findlay, J. R., Sutherland, W. J., et al. 2013, ApJ, 779, 24
- Volonteri (2010) Volonteri, M. 2010, A&ARv, 18, 279
- Wang et al. (2016) Wang, F., Wu, X.-B., Fan, X., et al. 2016, ApJ, 819, 24
- Weisskopf et al. (2002) Weisskopf, M. C., Brinkman, B., Canizares, C., et al. 2002, PASP, 114, 1
- Wu et al. (2012) Wu, J., Brandt, W. N., Anderson, S. F., et al. 2012, ApJ, 747, 10
- Wu et al. (2015) Wu, X.-B., Wang, F., Fan, X., et al. 2015, Nature, 518, 512
- Yang et al. (2015) Yang, Q. X., Xie, F. G., Yuan, F., et al. 2015, MNRAS, 447, 1692
- Young et al. (2009) Young, M., Elvis, M., & Risaliti, G. 2009, ApJS, 183, 17