The physical mechanism behind M dwarf metallicity indicators
and the role of C and O abundances
Abstract
We present NIR synthetic spectra based on PHOENIX stellar atmosphere models of typical early and mid M dwarfs with varied C and O abundances. We apply multiple recently published methods for determining M dwarf metallicity to our models to determine the effect of C and O abundances on metallicity indicators. We find that the pseudo-continuum level is very sensitive to C/O and that all metallicity indicators show a dependence on C and O abundances, especially in lower models. In some cases the inferred metallicity ranges over a full order of magnitude (1 dex) when [C/Fe] and [O/Fe] are varied independently by 0.2. We also find that [(OC)/Fe], the difference in O and C abundances, is a better tracer of the pseudo-continuum level than C/O. Models of mid-M dwarfs with [C/Fe], [O/Fe], and [M/H] that are realistic in the context of galactic chemical evolution suggest that variation in [(OC)/Fe] is the primary physical mechanism behind the M dwarf metallicity tracers investigated here. Empirically calibrated metallicity indicators are still valid for most nearby M dwarfs due to the tight correlation between [(OC)/Fe] and [Fe/H] evident in spectroscopic surveys of solar neighborhood FGK stars. Variations in C and O abundances also affect the spectral energy distribution of M dwarfs. Allowing [O/Fe] to be a free parameter provides better agreement between synthetic spectra and observed spectra of metal-rich M dwarfs. We suggest that flux-calibrated, low-resolution, NIR spectra can provide a path toward measuring C and O abundances in M dwarfs and breaking the degeneracy between C/O and [Fe/H] present in M dwarf metallicity indicators.
Subject headings:
stars: abundances — stars: fundamental parameters — stars: late-type — stars: low-mass, brown dwarfs — stars: atmospheres1. Introduction
M dwarf stars are the most common class of star in the Galaxy, making up 70% of all stars (Bochanski et al., 2010). Their low masses () and corresponding low effective temperatures (2500 K 3800 K) allow for molecules to form throughout their atmospheres. As a result, the visible and near-infrared (NIR) spectra of M dwarfs are dominated by millions of molecular lines that blend together even at high resolution. These molecular features render useless many of the standard methods developed for measuring the chemical composition of Sun-like F-, G-, and K-type stars.
Mould (1976, 1978) first attempted to utilize model atmospheres to derive model-dependent metallicities of M dwarfs from their NIR spectra. Over the past decade, however, multiple methods for measuring metallicity from moderate-resolution spectra of M dwarfs have been empirically calibrated via widely-separated binary systems composed of an M dwarf with an FGK companion (Rojas-Ayala et al., 2010, 2012; Terrien et al., 2012; Mann et al., 2013a; Newton et al., 2014). The two stars are assumed to have formed at the same time, from the same material and, therefore, share a common chemical composition. Metal-sensitive indicators in M dwarf spectra can be calibrated on metallicities measured from the FGK companion. Methods now exist for measuring the overall metallicity [M/H] (or, by proxy, iron abundance [Fe/H]) from moderate-resolution M dwarf spectra () over a wide range of visible and NIR bands. Additionally, methods have been developed to measure M dwarf metallicity from high-resolution NIR spectra (Önehag et al., 2012; Lindgren et al., 2016), high-resolution optical spectra (Pineda et al., 2013; Neves et al., 2014; Maldonado et al., 2015), and optical-NIR photometry (Bonfils et al., 2005; Casagrande et al., 2008; Johnson & Apps, 2009; Schlaufman & Laughlin, 2010; Neves et al., 2012; Johnson et al., 2012; Hejazi et al., 2015).
M dwarf metallicity calibrations are playing an increasing role in characterizing planets found to orbit M dwarfs. Muirhead et al. (2012a) utilized the Dartmouth Stellar Evolution Database (Dotter et al., 2008) to derive metallicity-dependant radii and masses of planet-hosting cool dwarfs ( 4400 K), leading to a dramatic downward revision of stellar radii, and thus planet radii, for 80 planet-candidate hosts. Such methods continue to serve an important role in characterizing cool planet-hosts (Johnson et al., 2012; Muirhead et al., 2012b; Swift et al., 2013; Ballard et al., 2013; Muirhead et al., 2014; Swift et al., 2015) and allow for robust estimates of the occurrence of planets orbiting M dwarfs (Dressing & Charbonneau, 2013; Kopparapu, 2013; Gaidos & Mann, 2014; Morton & Swift, 2014) including the occurrence of potentially habitable planets (Dressing & Charbonneau, 2015).
M dwarf metallicity calibrations have also allowed investigations of how the composition of cool stars affect the occurrence of planets found to orbit them. Johnson & Apps (2009) and Johnson et al. (2010) first suggested that Jupiter-sized giant planets around M dwarfs are found preferentially around metal-rich stars after estimating the metallicity of seven planet-hosts from their broadband photometry—a result later confirmed in numerous studies (Schlaufman & Laughlin, 2010; Rojas-Ayala et al., 2010; Schlaufman & Laughlin, 2011; Terrien et al., 2012; Rojas-Ayala et al., 2012). Though, it is now evident such a trend does not exist for Neptune-sized or smaller planets (Mann et al., 2012; Neves et al., 2013; Mann et al., 2013b).
Methods to measure [Fe/H] in M dwarfs are now reaching precisions of 0.1 dex despite the fact that most do not use Fe I absorption lines and therefore do not directly probe Fe abundance. As M dwarf metallicity calibrations continue to achieve greater precision, we require a better understanding of the physical mechanisms behind these [Fe/H] tracers that do not directly probe Fe abundance. Throughout the visible and NIR region of an M dwarf spectrum, the continuum level is depressed by molecular bands creating a pseudo-continuum from which metal line equivalent widths (EWs) are measured. In the case of H- and K-band M dwarf metallicity indicators, the pseudo-continuum level is defined by \ceH2O bands. The carbon-to-oxygen ratio111C/O is defined as , where and are the number densities of carbon and oxygen, respectively. C/O has been observed to strongly affect molecular bands such as \ceH2O in NIR spectra of ultracool dwarfs and exoplanets (Madhusudhan et al., 2011; Sorahana & Yamamura, 2014; Barman et al., 2015; Moses et al., 2013). One might expect similar effects can be seen on a smaller scale in the pseudo-continua of NIR M dwarf spectra. Variations in the pseudo-continuum would alter the EWs of metal lines in M dwarf spectra and metallicities inferred from them.
Apart from the possible influence of C/O on the pseudo-continua and EWs of metal lines in M dwarf spectra, there is growing interest in measuring C/O in M dwarfs due to its role in inferring the interior structures of rocky planets. Models of C-rich (C/O 0.8) protoplanetary disks suggest they contain more mass in the form of solid refractory condensates in the inner region of the disk (1 AU) than disks of solar-metallicity and can form C-rich planets composed primarily of carbides rather than silicates like the Earth (Bond et al., 2010; Carter-Bond et al., 2012a, b; Moriarty et al., 2014). With 1 rocky planet per M dwarf with a period 150 days (Morton & Swift, 2014; Dressing & Charbonneau, 2015), M dwarfs are prime targets for discovering C-rich, rocky, short-period planets. The Transiting Exoplanet Survey Satellite (TESS) is expected to discover over 400 Earth-sized planets around nearby M dwarfs, including 50 orbiting within their host stars’ habitable zones (Sullivan et al., 2015).
Some surveys of nearby solar-type stars find that 25% of stars are C-rich (Delgado Mena et al., 2010; Petigura & Marcy, 2011). However, it has recently been argued that these surveys are systematically skewed to higher C/O due to an overestimation of the solar C/O and their treatment of the 6300 [O I] forbidden line which is blended with a Ni I line (Fortney, 2012). For example, Petigura & Marcy (2011) adopted = for the Ni I line, which is 35% higher than what has been measured in laboratory experiments (Johansson et al., 2003), leading to overestimation of the Ni I contamination and underestimation of O abundance. Furthermore, Gaidos (2015) and Gizis et al. (2016) suggest C-rich M dwarfs would have distinct spectral index ratios that are not observed in spectroscopic surveys of nearby M dwarfs. Gaidos (2015) limits the occurrence of C-rich M dwarfs to 0.1% of M dwarfs. More recent surveys of FGK stars that utilize both the 6300 [O I] forbidden line and the 7774 O I triplet confirm the dearth of stars with C/O 0.8 (Nissen, 2013; Nissen et al., 2014; Teske et al., 2014).
M dwarfs that are intrinsically222As opposed to dwarf carbon (dC) stars which likely accreted C-rich gas from the envelope of an evolved companion (Dahn et al., 1977; Dearborn et al., 1986; Green, 2013) C-rich with C/O 0.8 are likely rare. However, there is some variation in C/O among solar neighborhood FGK stars. This variation should have an observable effect on visible and NIR M dwarf spectra, which are dominated by opacity due to molecules that contain C and O.
In this paper, we explore the effect of varying C and O abundances on multiple recently published metallicity indicators in M dwarf spectra. In Section 2, we briefly cover the chemistry that occurs between C and O in the atmosphere of an M dwarf and the implications for the EWs of absorption lines. In Section 3 we present a set of synthetic spectra of M dwarfs with varied C and O abundances. We apply various methods for measuring metallicity from M dwarf spectra to these models in Section 4. In Section 5, we describe the role of C/O for M dwarf metallicity indicators in the context of galactic chemical evolution. In Section 6, we present an observational case study of the effect of C/O on the spectrum of a C-rich M dwarf. Finally, we discuss the results in Section 7 and summarize them in Section 8.
2. The Chemistry of C and O in M dwarf Atmospheres
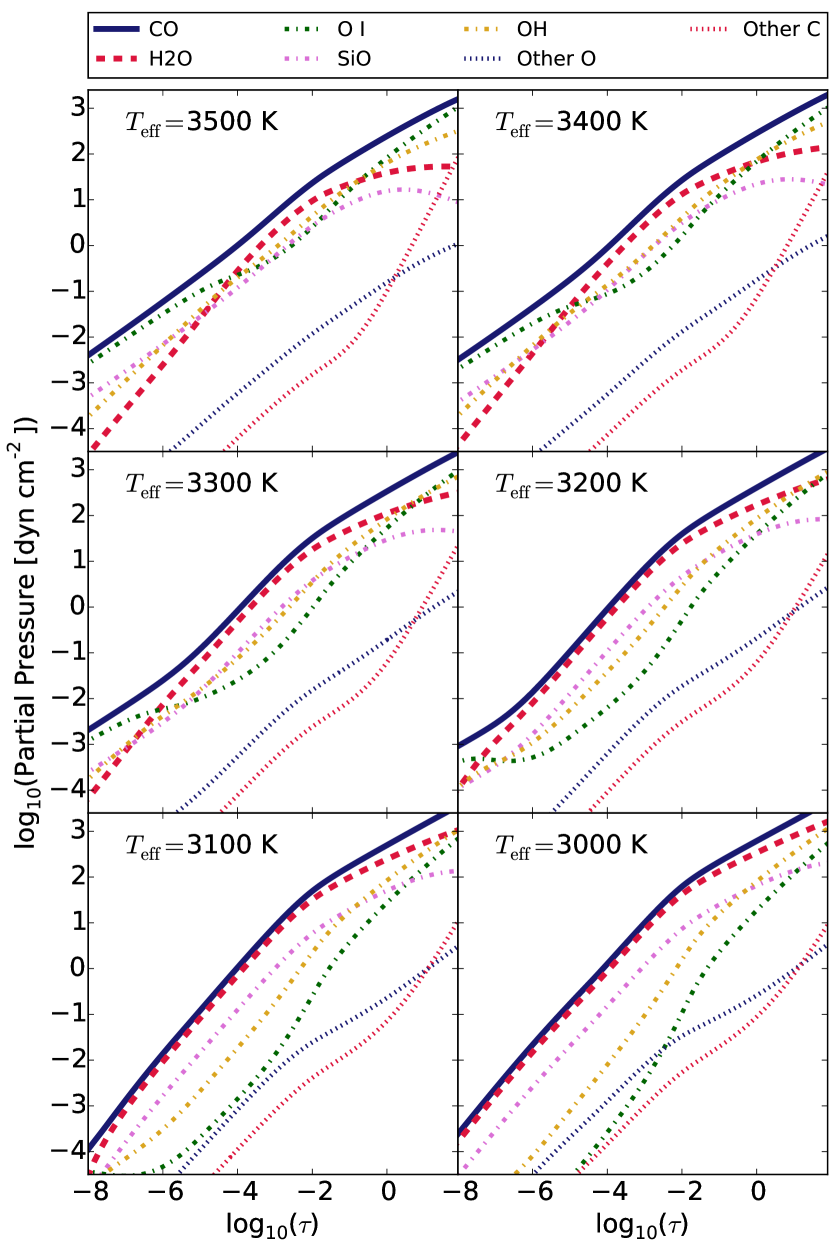
The dominant sources of opacity in M dwarf atmospheres are molecules that contain either C or O. TiO contributes the majority of the opacity at visible wavelengths. \ceH2O and CO provide most the opacity in the NIR. Chemical equilibrium is defined as the minimization of the Gibbs free energy of the system (van Zeggeren & Storey, 1970). In the typical temperatures and pressures of an M dwarf atmosphere, chemical equilibrium is achieved when nearly all the C is locked away in energetically favorable CO, along with an equal amount of O (Burrows & Sharp, 1999; Heng et al., 2016). At low effective temperatures ( 3300 K) the remaining oxygen is largely found in \ceH2O. At higher , O I, \ceSiO, and \ceOH account for most of the O in the upper atmosphere that is not in \ceCO. Although TiO is a major source of opacity in M dwarf atmospheres, it is relatively scarce, accounting for 0.03% of all O in the atmosphere of a = 3000 K star with solar abundances. Figure 1 shows the partial pressures of \ceCO, \ceH2O, O I, \ceSiO, \ceOH, all other O-bearing species (including TiO), and all other C-bearing species as a function of optical depth for atmospheric models (as described in Section 3) with various . The partial pressure of a species in a mixture is the pressure exerted by a gas composed only of that species at its density and temperature.
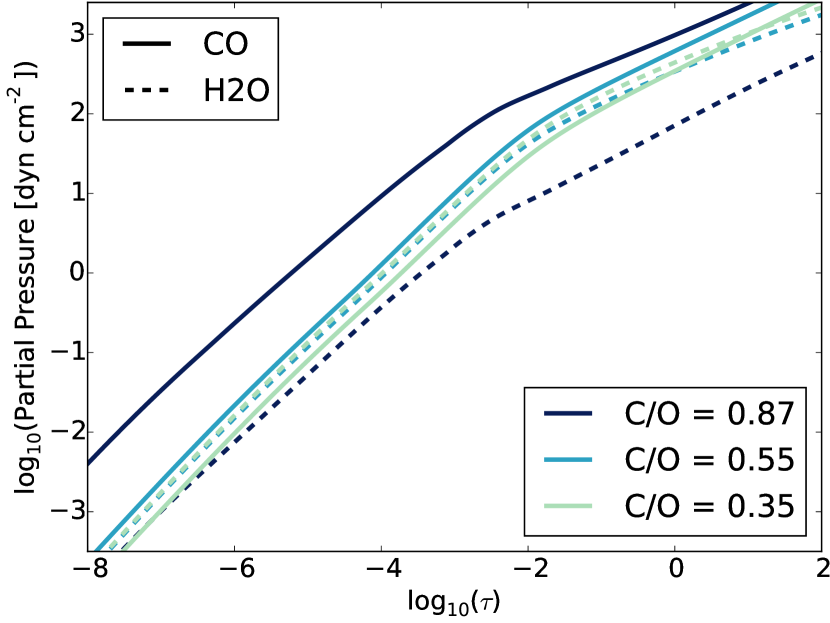
CO plays a crucial role in the abundance of other O-bearing species. At solar abundances, it is the dominant O-carrier and is limited only by the abundance of C. Therefore, the relative abundance of major opacity sources like \ceCO and \ceH2O is mediated by the relative abundance of C and O nuclei. Figure 2 shows the partial pressures of \ceCO and \ceH2O as a function of optical depth for = 3000 K and = 5.0 atmospheric models with varied C/O. In the high C/O case, significantly more oxygen is found in \ceCO than in \ceH2O. At solar C/O (0.55), the partial pressures, and therefore relative abundance, are roughly equal with 80% more oxygen in \ceCO than in \ceH2O at an optical depth of unity (\ceCO contains 55% of O nuclei, \ceH2O contains 30%). When C/O 0.5, \ceH2O becomes the dominant oxygen carrier. In warmer atmospheres, the abundance of other O-bearing species becomes comparable to or greater than that of \ceH2O, but the abundance of \ceH2O still varies significantly as a function of C/O.
2.1. Effect on the pseudo-continuum and EWs of absorption lines
In a plane-parallel atmosphere where the temperature is a linear function of optical depth, the emergent intensity at a given wavelength is described by Planck’s law at the local gas temperature of the atmosphere where the optical depth at that wavelength is unity. At wavelengths where the Rayleigh-Jeans approximation is valid and the emergent flux is a linear function of temperature, additional continuum opacity—that is a constant source of opacity at all wavelengths—reduces the flux at all wavelengths equally. In this case, additional continuum opacity would not effect the EW of an absorption line as both the intensity within the line and of the continuum level are reduced equally.
In the atmosphere of an M dwarf, the temperature is not a linear function of optical depth and the spectral regions of interest lie too close to the peak of the blackbody radiation spectrum that they do not vary linearly with temperature. It is still instructive, however, to think of the =1 surface and the slope of the temperature profile there. In the cool upper region of the atmosphere, the region probed at the centers of high-opacity absorption lines, the temperature is a steep function of optical depth. There, small additions of continuum opacity result in larger changes to the emergent flux than outside of the absorption line which probes deeper into the atmosphere where temperature is not as steep a function of optical depth. In this case, additional continuum or pseudo-continuum opacity, such as \ceH2O, can change the EW of an absorption line as the intensity in the line varies more as a function of additional opacity than the continuum level does.
The relative abundance of C and O controls the relative abundance of major opacity sources \ceCO and \ceH2O in M dwarf atmospheres. Therefore, variations in C/O should have profound effects on the pseudo-continuum level where it is defined by O-bearing species, and the EWs of absorption lines measured from the pseudo-continuum.
3. Synthetic Spectra
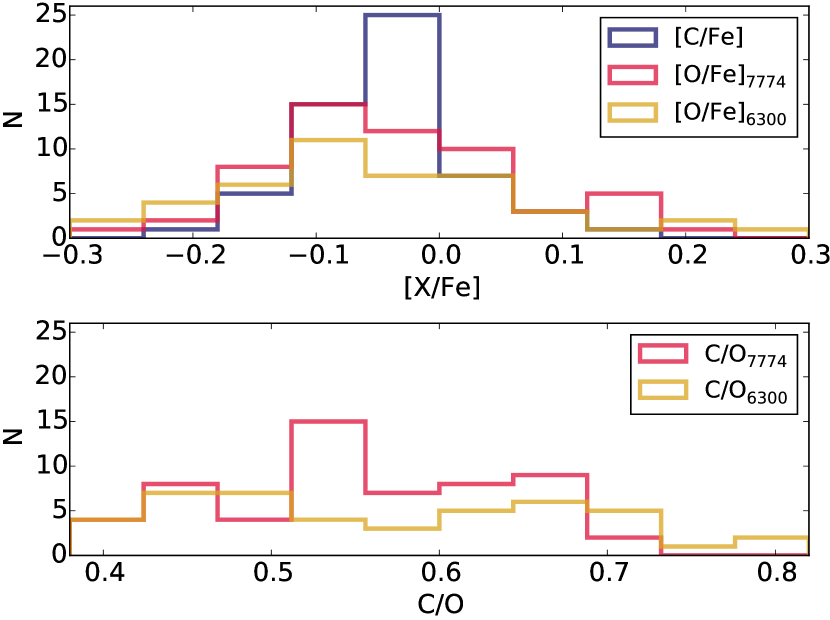
To explore the effect of the relative C and O abundances on M dwarf spectra, we computed a small set of synthetic spectra based on the BT-Settl atmospheric models (Allard et al., 2012a, b; Baraffe et al., 2015). We used version 15.5 of the PHOENIX stellar atmosphere modeling code to produce synthetic spectra333All synthetic spectra are available for download online at http://people.bu.edu/mveyette/phoenix/ of typical early ( = 3500 K, log() = 5.0, [M/H] = 0.0) and mid ( = 3000 K, log() = 5.0, [M/H] = 0.0) M dwarfs. The models assume Asplund et al. (2009) solar abundances but with varied carbon and oxygen abundance as listed in Table 1. We independently varied [C/Fe]444We employ the standard notation where [A/B] = and [O/Fe] by 0.1 and 0.2 to produce carbon-to-oxygen ratios ranging from 0.347 to 0.871, similar to the range seen in solar neighborhood FGK stars (Nissen et al., 2014). Figure 3 shows the distributions of [C/Fe], [O/Fe], and C/O for solar neighborhood FGK stars.
| C/O | [(OC)/Fe] | ||
|---|---|---|---|
| 0.871 | |||
| 0.871 | |||
| 0.692 | |||
| 0.692 | |||
| 0.550 | |||
| 0.437 | |||
| 0.437 | |||
| 0.347 | |||
| 0.347 |
We made four additional sets of = 3000 K models where all elemental abundances are modified by [M/H] = 0.2 and [M/H] = 0.5. For these models, both [C/Fe] and [O/Fe] were varied independently by 0.2. The total C and O abundances are then given by
| (1) |
By construction, [Fe/H] = [M/H] in our models. Holtzman et al. (2015) find that [Fe/H] and [M/H] only differ significantly at low metallicities ([M/H] -0.5).
We also introduce [(OC)/Fe], the log difference in O and C abundance relative to Fe abundance and scaled from solar,
| (2) |
where , , and are the number densities of oxygen, carbon, and iron, respectively. With nearly all the available C locked up in \ceCO, along with an equal amount of O, the difference in O and C abundances represents the amount of O left to form other O-bearing species with the majority going into \ceH2O at low . [(OC)/Fe] is indicative of the abundance of \ceH2O relative to Fe.
We note that synthetic M dwarf spectra are known to inaccurately reproduce the observed strength of absorption lines, in part due to incomplete or inaccurate atomic and molecular data (Hoeijmakers et al., 2015). Although, newer models continue to offer improved agreement with observations (Boyajian et al., 2012; Rajpurohit et al., 2014; Rice et al., 2015; Passegger et al., 2016). While we do not assume the models are correct on an absolute scale, we do assume that the relative change in the spectrum as a function of changes in model parameters is representative of what is observed in real stars. In many cases, we normalize the absolute scale of measurements made based on the models and present only the relative differences. This also mitigates issues arising from comparing our model [M/H] to metallicity calibrations based on [Fe/H]. To within the precision of the metallicity calibrations we investigate here, [M/H] and [Fe/H] should scale equally over the metallicity range we explore.
4. The effect of C and O on inferred metallicity
In order to determine how the inferred metallicity depends on the relative abundance of C and O, we applied several empirically calibrated methods for determining M dwarf metallicities to our synthetic spectra.
Rojas-Ayala et al. (2010) first identified that an M dwarf’s metallicity can be inferred from moderate-resolution (2000) spectra of the K-band Na I doublet (2.206 m and 2.209 m) and Ca I triplet (2.261 m, 2.263 m, and 2.265 m). Using a sample of 17 common proper motion binary systems composed of an FGK primary with an M dwarf companion, Rojas-Ayala et al. (2010) empirically calibrated a relation between the EWs of the Na I doublet and Ca I triplet in M dwarf spectra and the metallicities of their FGK companions. Later, Newton et al. (2014) used a sample of 36 FGK+M systems to develop an empirical relation between the EW of just the Na I doublet and the metallicity inferred from an FGK companion.
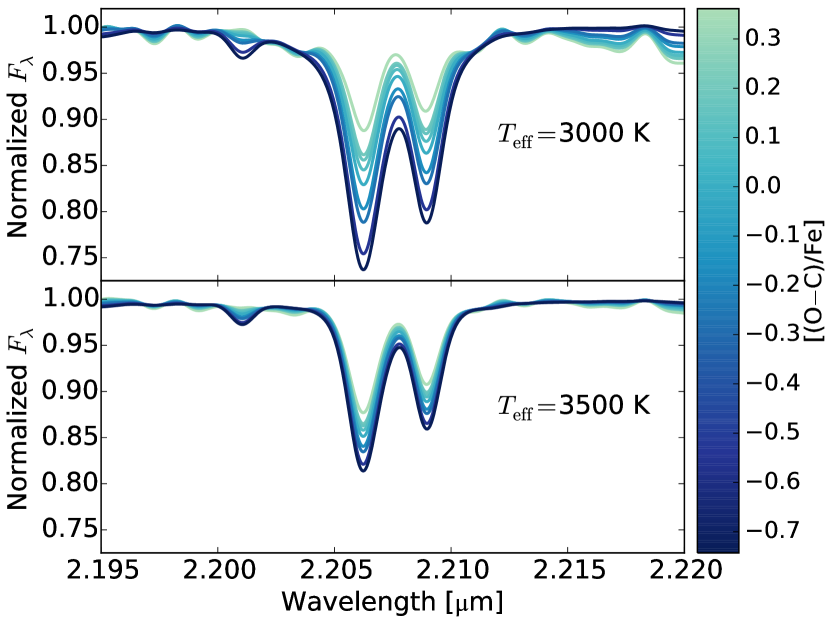
Due to pervasive molecular features in M dwarf spectra, the true blackbody continuum level cannot be measured. In the case of the Na I doublet and Ca I triplet, numerous \ceH2O lines blend together at low resolution to define the pseudo-continuum from which the EWs are measured. Figure 4 shows the continuum-normalized Na I doublet of our [M/H] = 0.0 models, colored by [(OC)/Fe]. Although the abundance of \ceNa relative to H is the same for all models, variations in [(OC)/Fe] effect the pseudo-continuum level, making it appear as though the Na I doublet is varying in strength. This effect is stronger in lower models.
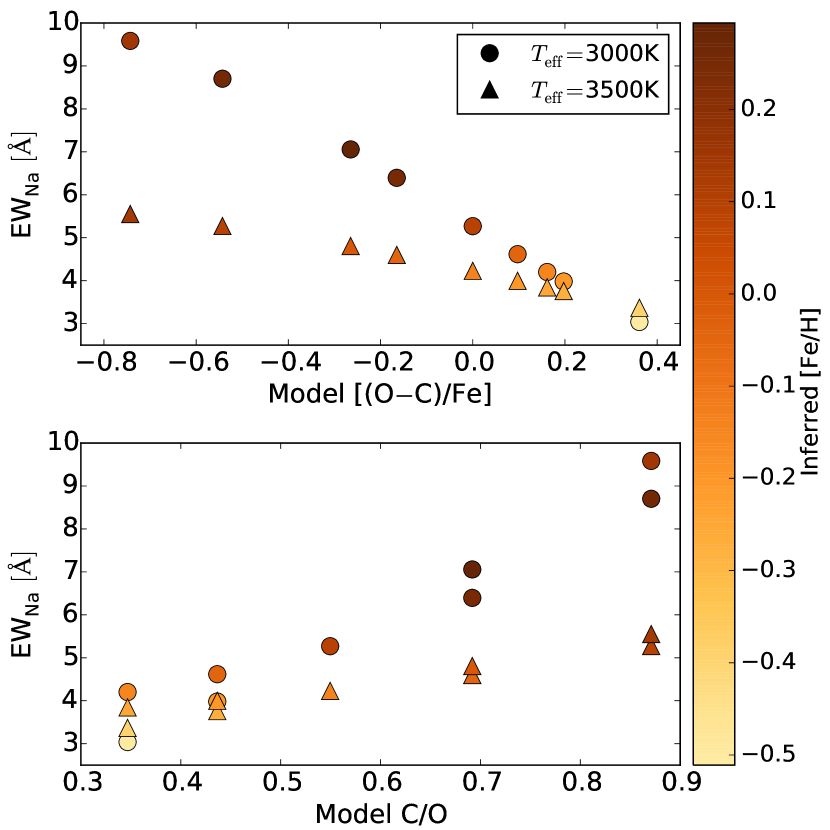
We followed the procedure outlined in Newton et al. (2014) to calculate the pseudo-continua and measure the Na I doublet EWs from our synthetic spectra after convolving them to a resolution of . Figure 5 shows the EWs of the Na I doublet and the inferred metallicity based on the Newton et al. (2014) empirical relation. The EWs show a clear relation with [(OC)/Fe], indicating the EW is directly related to the amount of O not bound up in \ceCO. Again, this relation is stronger in lower models. The EWs also show a correlation with C/O, although, it is degenerate with the absolute abundances of C and O. For example, our [O/Fe] = -0.2 model and our [C/Fe] = +0.2 model both have C/O = 0.871, but their [(OC)/Fe] differ by 0.2 dex—thus we infer different [Fe/H] for the two models. The metallicities inferred from the completely solar composition model ([M/H] = [C/Fe] = [O/Fe] = 0.0) are systematically offset, with [Fe/H] = +0.10 and dex inferred for the 3000 K and 3500 K solar-abundance models, respectively. The metallicities inferred span almost a full order of magnitude, and nearly the full range the empirical relation is calibrated for ( dex [Fe/H] 0.3 dex).
We applied six additional M dwarf metallicity calibrations based on moderate-resolution visible and NIR spectra to our models: (1) the Rojas-Ayala et al. (2012) method which revises the Rojas-Ayala et al. (2010) fit to the K-band Na I doublet, Ca I triplet, and a temperature-sensitive index based on \ceH2O absorption bands, (2) the Terrien et al. (2012) method which utilizes H-band features consisting of two Ca I features, a K I feature, and a temperature-sensitive index, again based on \ceH2O absorption bands, and (3-6) the four methods derived by Mann et al. (2013a) who “prospected” for metal-sensitive features in M dwarf spectra and calibrated empirical metallicity indicators in moderate-resolution visible, J-, H-, or K-band spectra. We followed the procedures outlined in these papers to estimate the pseudo-continua of our models and calculated the inferred metallicities for each method. Mann et al. (2013a) derived separate metallicity relations for early- and late-type M dwarf visible spectra due to large discrepancies that arose when treating all M dwarf subtypes the same. We employed the early-type visible relation for our 3500 K model and the late-type visible relation for our 3000 K model.
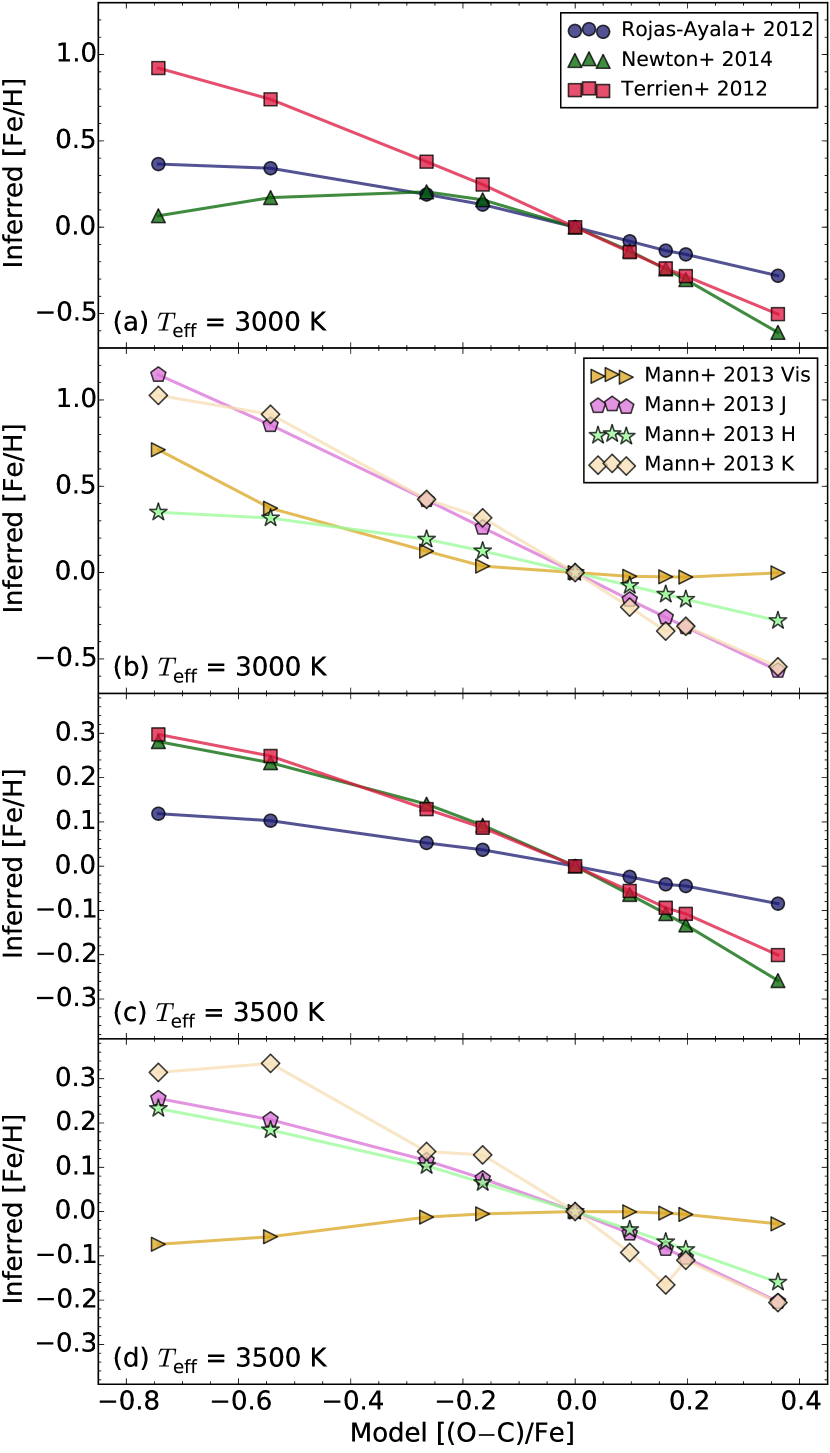
The metallicities inferred from our models with otherwise solar [M/H] = 0.0 are shown in Figure 6 as a function of [(OC)/Fe]. For better comparison of the different methods, we subtracted off the [Fe/H] inferred from the solar composition model for each calibration method and . The slopes in Figure 6 indicate a method’s sensitivity to [(OC)/Fe]. Nearly all methods show large variations with [(OC)/Fe], sometimes varying by 1 dex (e.g. the Terrien et al. 2012 method and the Mann et al. 2013a J and K methods). The variation with [(OC)/Fe] is larger for the cooler = 3000 K models. The Mann et al. (2013a) J-band relation applied to the 3000 K model shows the most variation with C and O abundances with inferred metallicities ranging from to +1.15 dex. The Mann et al. (2013a) early-type visible relation applied to the 3500 K model shows the least variation with [(OC)/Fe], varying less than 0.08 dex over the full model grid and, in fact, shows a positive trend with [(OC)/Fe].
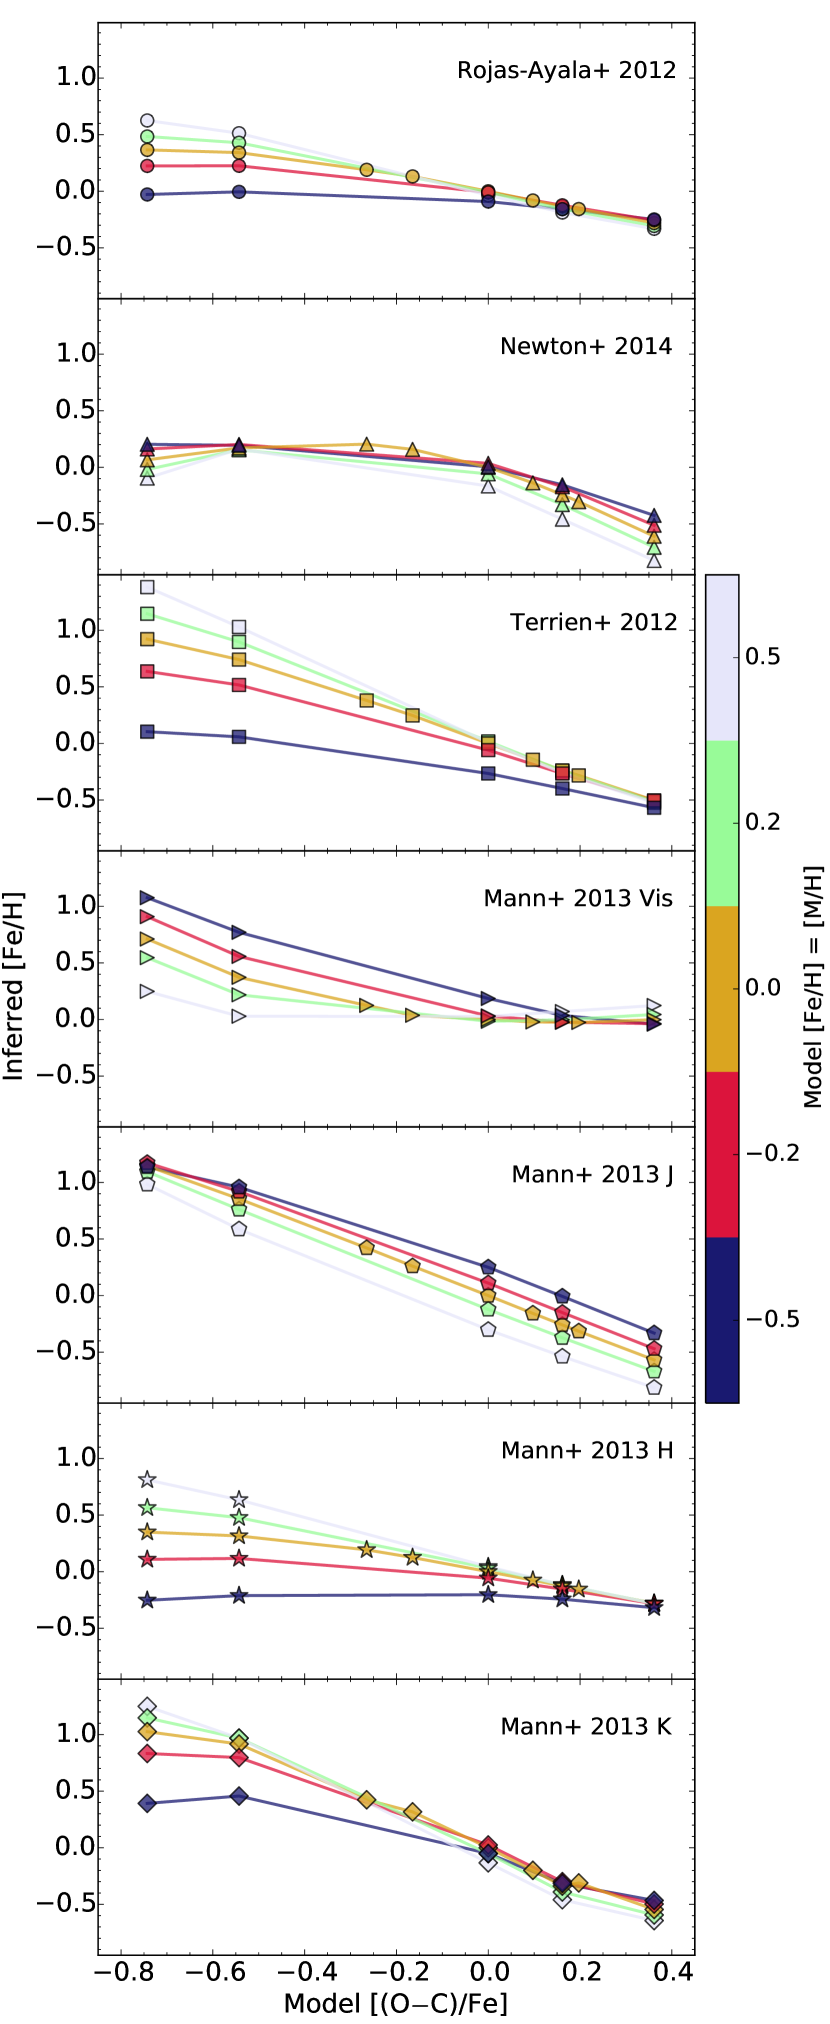
To explore the relative effects of varying [(OC)/Fe] and overall metallicity [M/H], we applied all seven metallicity calibrations to our = 3000 K and [M/H] = 0.0, [M/H] = 0.2, or [M/H] = 0.5 models. The inferred metallicities are shown in Figure 7. The [Fe/H] inferred from the solar composition model for each method has been subtracted off for clarity. The slopes in Figure 7 indicate a method’s sensitivity to [(OC)/Fe] and the spread at a given [(OC)/Fe] indicates a method’s sensitivity to [M/H]. The inferred [Fe/H] of metal-poor models tend to show less variation with [(OC)/Fe] than solar metallicity or metal-rich models. The inferred [Fe/H] also typically varies more with [M/H] than [(OC)/Fe] for lower [(OC)/Fe].
The pseudo-continuum level as determined by [(OC)/Fe] and the inherent opacity in metal lines due to the abundance of metals both play a role in the measured EWs of metal lines in M dwarf spectra and the metallicities inferred from them. Each method investigated shows a dependence on [(OC)/Fe] that varies as a function of and overall [M/H]. Aside from the Mann et al. (2013a) early-visible method applied to the = 3500 K model, the inferred [Fe/H] based on all methods increases as [(OC)/Fe] decreases.
One interesting feature to note is that most methods show a larger dependence on overall metallicity when [(OC)/Fe] is small and very little dependence on overall metallicity when [(OC)/Fe] is large. However, the opposite is true for the Mann et al. (2013a) J-band method. This is a product of the effect of increasing [M/H] on the pseudo-continuum in J-band versus H- and K-band. Increasing [M/H] adds additional opacity at nearly all visible and NIR wavelengths in an M dwarf spectrum. To maintain the same effective temperature, flux is redistributed to regions of low opacity. In O-rich atmospheres, the flux is redistributed to around J-band, so the pseudo-continuum level and EWs of absorption lines in J-band are sensitive to [M/H]. In O-poor atmospheres, there is more opacity throughout J-band due to FeH and TiO lines than there is in the H2O bands. Then, J-band line EWs are not very sensitive to [M/H] while H- and K-band lines are.
5. The physical mechanism behind M dwarf metallicity indicators
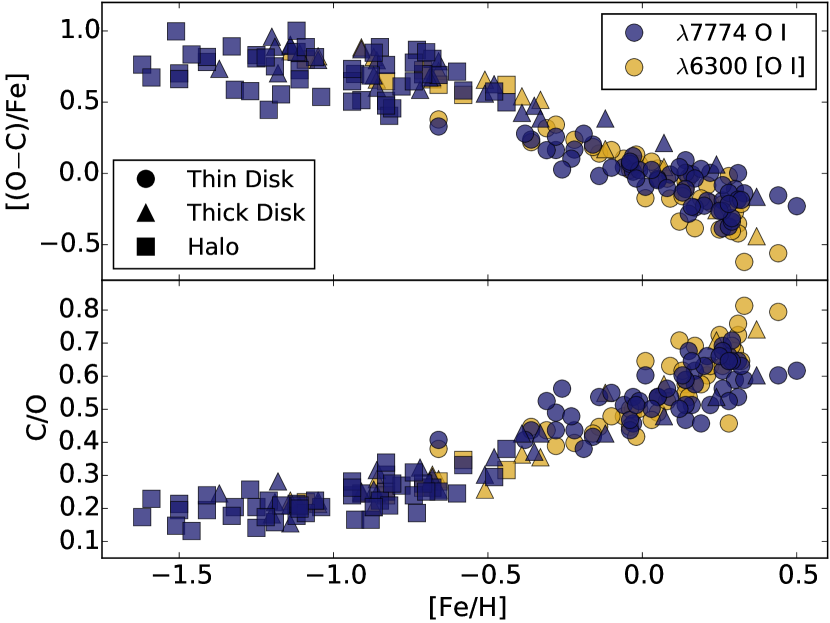
Recent spectroscopic surveys of solar neighborhood FGK stars have found a clear relationship between [Fe/H] and the relative abundance of C and O, such that C/O can be used as a tracer of [Fe/H] (Delgado Mena et al., 2010; Petigura & Marcy, 2011; Nissen, 2013; Teske et al., 2014; Nissen et al., 2014). Figure 8 shows this relation using data from Nissen et al. (2014). The variance at a given [Fe/H] is consistent with measurement uncertainty. As [Fe/H] increases, [(OC)/Fe] decreases and C/O increases. Increasing C/O or decreasing [(OC)/Fe] leads to an increase in the EW of the Na I doublet and other metallicity indicators in our model M dwarf spectra.
C and O are synthesized in intermediate-mass () and massive () stars and ejected in the winds of asymptotic giant branch (AGB) stars and via type II supernovae (SNe) (Maeder, 1992; Woosley & Weaver, 1995; van den Hoek & Groenewegen, 1997; Portinari et al., 1998; Marigo, 2001; Meynet & Maeder, 2002; Limongi & Chieffi, 2003; Chieffi & Limongi, 2004; Hirschi et al., 2005; Kobayashi et al., 2006; Karakas & Lattanzio, 2007; Karakas, 2010; Romano et al., 2010; Doherty et al., 2014). Stars less massive than 10 and with sub-solar metallicity eject more C than O, tending to increase C/O in the interstellar medium (ISM). More massive stars eject more O than C and decrease C/O in the ISM. Enrichment of Fe in the ISM is largely due to the synthesis of \ce^56Ni in the cores of massive stars and in type II (Woosley & Weaver, 1995; Limongi & Chieffi, 2003; Chieffi & Limongi, 2004; Kobayashi et al., 2006; Romano et al., 2010) and type Ia SNe (Nomoto et al., 1984; Iwamoto et al., 1999; François et al., 2004). \ce^56Ni rapidly decays via into \ce^56Co and then to \ce^56Fe.
Galactic chemical evolution (GCE) models, which combine the star formation history and initial mass function of the Galaxy with nucleosynthesis yields of evolved stars, predict a positive trend in C/O with [Fe/H] above [Fe/H] (Chiappini et al., 2006; Cescutti et al., 2009; Romano et al., 2010; Mattsson, 2010). Early in the life of the Galaxy, type II SNe were the major polluters of the ISM, leading to low C/O among old, metal-poor stars. By [Fe/H] = , type Ia SNe begin to contribute large amounts of Fe and [Fe/H] begins to increase rapidly with the age of the Galaxy. The progenitors of these SNe are metal-poor, intermediate-mass stars formed early in the life of the Galaxy when the star formation rate was higher. As lower-mass, but more abundant, stars reach the AGB phase, their C-rich contribution to the ISM dominates over the O-rich ejecta of type II SNe. The observed trend between C/O and [Fe/H] is due to the common source of both Fe- and C-enrichment of the ISM.
The tight correlations predicted and observed between C, O, and Fe abundance in solar neighborhood FGK stars imply that methods sensitive to these abundances make for good statistical metallicity indicators. It should be noted that these methods do not directly probe [Fe/H] and are degenerate with C and O abundance, however, for the purpose of measuring [Fe/H] or overall metallicity, the empirical relations determined from FGK+M binary system should still hold in most cases. The tight correlation between M dwarf metal line EWs and [Fe/H] exists because of the tight correlation between C/O and [Fe/H].
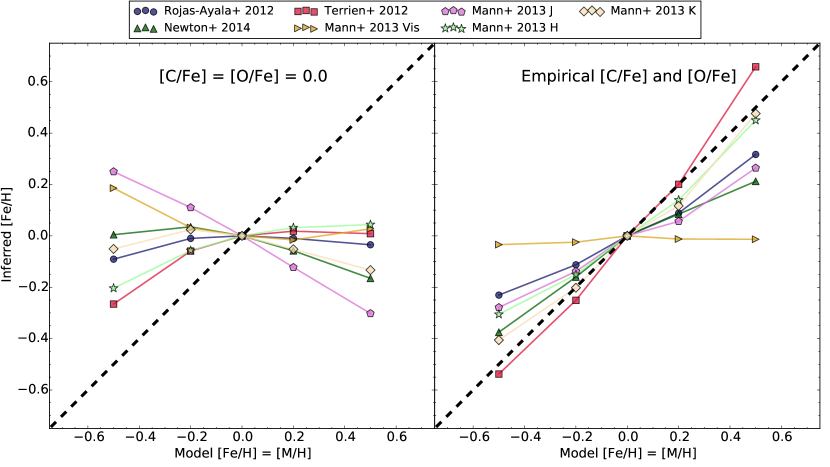
In the left panel of Figure 9, we show the metallicities inferred from our = 3000 K and [M/H] = 0.0, 0.2, and 0.5 models with solar [C/Fe] = 0.0 and [O/Fe] = 0.0 at all metallicities. The black dashed line marks a 1:1 relation between model [M/H] and inferred [Fe/H]. If for a particular method the inferred [Fe/H] lie close to the dashed line, then the empirically derived calibration is reproduced in the model spectra. For the solar C/O models, the spectra do a poor job of reproducing the observed trends between metal line EWs and [Fe/H], in fact, many methods show a negative trend in inferred [Fe/H] with increasing model [M/H].
In the right panel of Figure 9, we show the metallicities inferred from models with [M/H] = 0.0, 0.2, and 0.5, but with realistic [C/Fe] and [O/Fe] values based on the empirical trends between [Fe/H], [C/Fe], and [O/Fe] derived by Nissen et al. (2014). Models with realistic C and O abundances do a much better job reproducing the observed trend between metal line EWs and [Fe/H]. All methods show a positive trend in inferred [Fe/H] with increasing model [M/H], except the Mann et al. (2013a) visible method which remains roughly flat over the entire metallicity range. In general, the inferred metallicities lie closer to the 1:1 dashed line over the full metallicity range when using realistic [C/Fe] and [O/Fe] values.
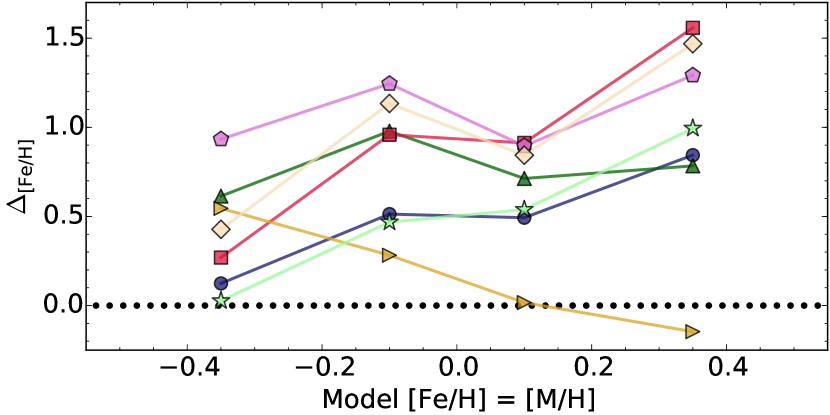
To assess the relative contribution of changing [M/H] versus changing C and O abundances to the change in inferred [Fe/H], we define as the difference between the change in inferred [Fe/H] with model [M/H] for empirical C/O models and the change in inferred [Fe/H] with model [M/H] for strictly solar C/O models. is simply the difference in slope between the right and left panels of Figure 9. Formally,
| (3) |
where [Fe/H]inf is the inferred [Fe/H], [M/H]mod is the model [M/H], “Emp C/O” denotes [C/Fe] and [O/Fe] values based on empirical relations, and “Sol C/O” denotes [C/Fe] = [O/Fe] = 0.0. indicates the net contribution of C and O abundances variation to the inferred [Fe/H]. Positive values indicate the change in inferred [Fe/H] with model [M/H] is mostly due to variations in [C/Fe] and [O/Fe]. as a function of model [M/H] is show in Figure 10. A dotted line is drawn at = 0.0, where the change in inferred [Fe/H] would be equally due to both changing the overall metallicity and changing C and O abundances. Except for the Mann et al. (2013a) visible method at high metallicity, all methods are more sensitive to C and O variations than to changing the overall metallicity.
6. A observational case study of the effect of C/O on M dwarf spectra
To validate the effect of C/O on M dwarf spectra pseudo-continua and metallicity indicators, we compared our synthetic spectra to the observed spectrum of NLTT 37349. NLTT 37349 is an M4.5 dwarf star and the common proper motion companion of the K0 dwarf HIP 70623 (Gould & Chanamé, 2004). Valenti & Fischer (2005) determined HIP 70623 is metal-rich and measured metallicities of [Fe/H] = and [M/H] = from a high-resolution optical spectrum obtained with HIRES on Keck. Petigura & Marcy (2011) also analyzed a HIRES spectrum of HIP 70623 to measure C and O abundances of [C/H] = from the 6587 C I line and [O/H] = from the 6300 [O I] forbidden line (C/O = 1, [(OC)/Fe] = for Asplund et al. 2009 solar abundances). As a binary system, the two stars are assumed to have formed at the same time from the same material and share a common chemical composition.
The high C/O measurements reported by Petigura & Marcy (2011) have been called into question (see Section 1). Nevertheless, HIP 70623 has one of the highest C/O in the Petigura & Marcy (2011) sample and is, therefore, likely C-rich compared to the Sun. Using the empirical relations between [Fe/H] and C and O abundances derived by Nissen et al. (2014), we calculate HIP 70623 should have [C/Fe] = and [O/Fe] = or (C/O = 0.72 or 0.85, [(OC)/Fe] = or ) based on the relation derived from either the 7774 O I triplet or the 6300 [O I] line, respectively. NLTT 37349 is the most metal-rich M dwarf we have NIR observations of that also has an FGK companion with a C/O value available in the literature. With such a high metallicty and C/O, NLTT 37349 provides an opportunity to test an extreme case of the effects of C and O abundances on the NIR spectrum of an M dwarf.
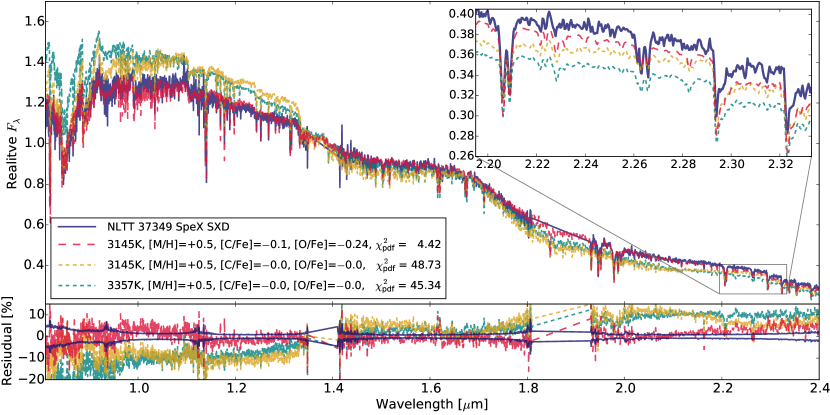
We used the SpeX instrument (Rayner et al., 2003) in the SXD mode on NASA’s Infrared Telescope Facility (IRTF) to obtain spectra of NLTT 37349 over the 0.8-2.4 m range (for observational details, see Mann et al., 2013a). We computed synthetic spectra for = 3100, 3200, 3300, and 3400 K, = 5.0, [M/H] = +0.5, [C/Fe] = 0.0, and [O/Fe] = 0.0. First, we used -minimization to find the best fitting model spectrum by linearly interpolating the model fluxes over as the only free parameter other than a scaling factor applied to the whole spectrum. The resulting best-fit ( = 45) is 3357 K, which is 240 K higher than temperatures typical of M4.5 stars (Lépine et al., 2013). Next, we produced a grid of synthetic spectra for the same parameters listed above, but with [C/Fe] = , and [O/Fe] = , , and . Allowing both and [O/Fe] to be free parameters, we obtained a best-fit ( = 4.4) = 3145 K and [O/Fe] = (C/O = 0.76, [(OC)/Fe] = ). These values are in much better agreement with expectations from empirical relations between [Fe/H] and [O/Fe] and between spectral type and .
The observed spectrum of NLTT 37349 is displayed in Figure 11 along with the best-fit model with solar C/O and only as a free parameter, the best-fit model with fixed [C/Fe] = -0.1 but and [O/Fe] as free parameters, and a model with the same but solar C/O. The solar C/O models provide a very poor fit to the overall shape of the NIR spectrum due to an excess of \ceH2O absorption in the H- and K-bands. Additionally, they under-predict the strengths of the 2.2 m Na I doublet, 2.26 m Ca I triplet, and 2.3 m CO bandhead. The model with higher C/O provides a much better fit to the overall shape of the spectrum, the H- and K-band \ceH2O bands (1.3–1.6 m and 1.7–2.3 m), and the strengths of metal-sensitive absorption features in K-band, except for the 2.26 m Ca I triplet used in the Rojas-Ayala et al. (2012) method which is still underestimated. Conversely, all models overpredict the strength of the 1.62 m Ca I feature used in the Terrien et al. (2012) method, as can be seen clearly in the residuals in Figure 11.
Comparisons between the observed spectrum of NLTT 37349 and synthetic spectra with either solar or enhanced C/O provide observational evidence of the effect of C and O abundances on the pseudo-continuum level and the EWs of metal-senstive features.
7. Discussion
Our investigation of model spectra has determined that variations in C and O abundances can account for a large portion of the variation in the apparent strength of atomic metal lines in observed M dwarf spectra. We conjecture that the EWs of metal lines in M dwarf spectra probe both the abundance of the element responsible line and the relative abundance of C and O. In the case of low metallicity and high [(OC)/Fe], when the inherent opacity in the line is low, metal line EWs are more sensitive to the pseudo-continuum level. In the high metallicity and low [(OC)/Fe] case, when the pseudo-continuum opacity is low and a larger portion of the opacity in the line is due to the element responsible for the line, metal line EWs are more sensitive to the abundance of that element.
If reliable methods existed to measure O and C abundance in M dwarfs, the degeneracy between [(OC)/Fe] and [Fe/H] could be lifted. Tsuji & Nakajima (2014) and Tsuji et al. (2015) developed a “blend-by-blend” analysis of high-resolution (=20000) K-band spectra to determine C and O abundances of M dwarfs via the EWs of blended \ceCO and \ceH2O lines. By assuming the vast majority of C is in \ceCO and the remaining O is in \ceH2O, measuring the abundances of \ceCO and \ceH2O yields the abundances of C and O. Their method relies on “mini curves of growth” produced by Unified Cloudy Models (UCM) (Tsuji, 2002; Tsuji et al., 2004; Tsuji, 2005). However, this method has yet to be empirically calibrated. Furthermore, their analysis of the \ceCO band assumes a solar C/O in order to determine C abundance. We have shown in this paper that small changes in C/O can have a large effect on relative abundance of \ceCO and \ceH2O. Tsuji & Nakajima (2016) improve upon this by performing a second iteration of the analysis based on the C/O determined from an initial iteration and measured C and O abundances for eight late M dwarfs. Follow-up moderate-resolution observations of these M dwarfs in the JHK bands could provide further observational support of the effects of C and O abundances on M dwarf NIR metallicity indicators.
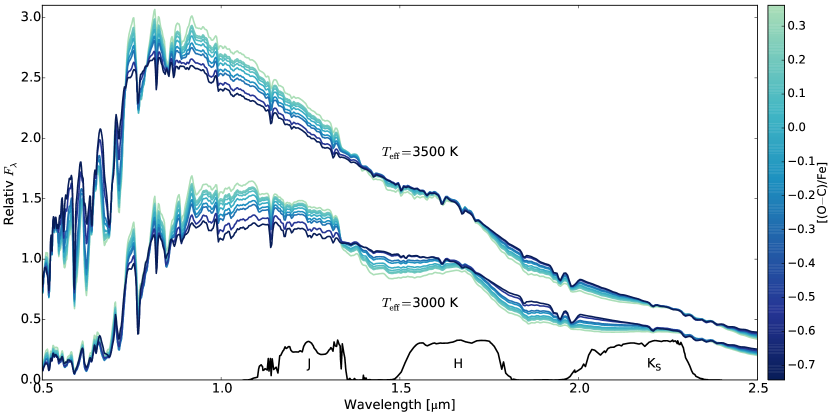
High-resolution spectra may not be required to determine the relative abundance of C and O in M dwarfs. Figure 12 shows our = 3500K and = 3000K, [M/H] = 0.0 models at low resolution (=200) to highlight how [(OC)/Fe] affects the overall spectral energy distribution (SED). O-rich models show greater H- and K-band depression due to increased \ceH2O opacity. This effect is stronger in low- models. O-rich models also show increased flux at 0.8-1.3 m as flux is redistributed to maintain the same . Well flux-calibrated, low-resolution, NIR spectra of M dwarfs with an FGK companion for which accurate C and O abundances can be determined could be used to calibrate methods for for measuring the relative abundance of C and O in M dwarfs.
The effects of C and O abundances on the SED of M dwarfs are large enough to affect their broadband NIR colors. Unfortunately, the largest change, increased \ceH2O opacity in H- and K-band, is also an effect seen in substellar objects and young, low-gravity M dwarfs (Lucas et al., 2001; Allers et al., 2007; Bonnefoy et al., 2014). Broadband colors may not be enough to break the degeneracy between , surface gravity, and [(OC)/Fe].
We argue that the effects of C/O on both the SED and the strength of individual metal lines in M dwarf NIR spectra are large enough to warrant a new grid of models for M dwarfs. Current grids of PHOENIX atmosphere models include only overall metallicity ([M/H]) and alpha-enhancement ([/Fe]) as independent parameters. Scaling all elemental abundances only by [M/H] assumes a constant solar C/O at all metallicities. When O is included as an element and C is not, the largest effect of varying [/Fe] for M dwarf models will arise from the variation in C/O. This is the case in the newest grid of PHOENIX models (Husser et al., 2013). The grid covers [/Fe]=-1.2 with a step size of 0.2, but only for models with 3500 K and [Fe/H] . As we have shown, M dwarf spectra are more sensitive to C/O at lower . Ideally, a new grid would include [C/Fe] and [O/Fe] as additional independent parameters at all 3800 K and cover realistic values according to the chemical trends observed in the solar neighborhood.
8. Summary
We have presented NIR synthetic spectra of typical early ( = 3500 K) and mid ( = 3000 K) M dwarfs with varied C and O abundances for otherwise solar metallicity, [M/H] = 0.2, and [M/H] = 0.5 models. We applied multiple recently published methods for determining M dwarf metallicity to our models and concluded the following.
-
•
Variations in C and O abundances effect the pseudo-continua of M dwarf spectra across the entire visible-NIR region. These variations in pseudo-continuum affect the apparent strength of metal lines in M dwarf spectra.
-
•
The relative difference in O and C abundance, [(OC)/Fe], is a better metric for determining the magnitude of this effect than the more common carbon-to-oxygen ratio, C/O.
-
•
Varying C and O abundances strongly affects the metallicity inferred from recently published metallicity tracers. The inferred metallicity ranges over a full dex for some methods when [C/Fe] and [O/Fe] are varied independently by 0.2 for otherwise solar abundance models.
-
•
The dependence of the inferred metallicity on [(OC)/Fe] is stronger for lower and higher metallicity models.
-
•
Empirical calibrations of metallicity indicators in M dwarf spectra are likely still valid as solar neighborhood stars show a tight correlation between [Fe/H] and [(OC)/Fe].
-
•
When applied to our mid-M dwarf models with realistic C and O abundances assumed at different metallicities, all seven metallicity calibrations explored in this investigation show a larger dependence on C and O abundances than on [M/H].
-
•
Models that include realistic C and O abundances for metal-rich M dwarfs provide a much better fit to observed spectra (e.g. NLTT 37349) than those that assume solar C/O.
-
•
A method to directly measure the relative abundance of C and O in M dwarfs could break the degeneracy in metallicity indicators and could be used to calibrate out the effects of [(OC)/Fe], leading to increased precision of M dwarf metallicities.
-
•
The spectral energy distribution in low-resolution, NIR spectra of M dwarfs is highly sensitive to the relative abundance of C and O and may provide a path toward measuring [(OC)/Fe] or C/O in M dwarfs.
References
- Allard et al. (2012a) Allard, F., Homeier, D., & Freytag, B. 2012a, Royal Society of London Philosophical Transactions Series A, 370, 2765
- Allard et al. (2012b) Allard, F., Homeier, D., Freytag, B., & Sharp, C. M. 2012b, in EAS Publications Series, Vol. 57, EAS Publications Series, ed. C. Reylé, C. Charbonnel, & M. Schultheis, 3–43
- Allers et al. (2007) Allers, K. N., Jaffe, D. T., Luhman, K. L., et al. 2007, ApJ, 657, 511
- Asplund et al. (2009) Asplund, M., Grevesse, N., Sauval, A. J., & Scott, P. 2009, ARA&A, 47, 481
- Ballard et al. (2013) Ballard, S., Charbonneau, D., Fressin, F., et al. 2013, ApJ, 773, 98
- Baraffe et al. (2015) Baraffe, I., Homeier, D., Allard, F., & Chabrier, G. 2015, A&A, 577, A42
- Barman et al. (2015) Barman, T. S., Konopacky, Q. M., Macintosh, B., & Marois, C. 2015, ApJ, 804, 61
- Bochanski et al. (2010) Bochanski, J. J., Hawley, S. L., Covey, K. R., et al. 2010, AJ, 139, 2679
- Bond et al. (2010) Bond, J. C., O’Brien, D. P., & Lauretta, D. S. 2010, ApJ, 715, 1050
- Bonfils et al. (2005) Bonfils, X., Delfosse, X., Udry, S., et al. 2005, A&A, 442, 635
- Bonnefoy et al. (2014) Bonnefoy, M., Chauvin, G., Lagrange, A.-M., et al. 2014, A&A, 562, A127
- Boyajian et al. (2012) Boyajian, T. S., von Braun, K., van Belle, G., et al. 2012, ApJ, 757, 112
- Burrows & Sharp (1999) Burrows, A., & Sharp, C. M. 1999, ApJ, 512, 843
- Carter-Bond et al. (2012a) Carter-Bond, J. C., O’Brien, D. P., Delgado Mena, E., et al. 2012a, ApJ, 747, L2
- Carter-Bond et al. (2012b) Carter-Bond, J. C., O’Brien, D. P., & Raymond, S. N. 2012b, ApJ, 760, 44
- Casagrande et al. (2008) Casagrande, L., Flynn, C., & Bessell, M. 2008, MNRAS, 389, 585
- Cescutti et al. (2009) Cescutti, G., Matteucci, F., McWilliam, A., & Chiappini, C. 2009, A&A, 505, 605
- Chiappini et al. (2006) Chiappini, C., Hirschi, R., Meynet, G., et al. 2006, A&A, 449, L27
- Chieffi & Limongi (2004) Chieffi, A., & Limongi, M. 2004, ApJ, 608, 405
- Cohen et al. (2003) Cohen, M., Wheaton, W. A., & Megeath, S. T. 2003, AJ, 126, 1090
- Dahn et al. (1977) Dahn, C. C., Liebert, J., Kron, R. G., Spinrad, H., & Hintzen, P. M. 1977, ApJ, 216, 757
- Dearborn et al. (1986) Dearborn, D. S. P., Liebert, J., Aaronson, M., et al. 1986, ApJ, 300, 314
- Delgado Mena et al. (2010) Delgado Mena, E., Israelian, G., González Hernández, J. I., et al. 2010, ApJ, 725, 2349
- Doherty et al. (2014) Doherty, C. L., Gil-Pons, P., Lau, H. H. B., Lattanzio, J. C., & Siess, L. 2014, MNRAS, 437, 195
- Dotter et al. (2008) Dotter, A., Chaboyer, B., Jevremović, D., et al. 2008, ApJS, 178, 89
- Dressing & Charbonneau (2013) Dressing, C. D., & Charbonneau, D. 2013, ApJ, 767, 95
- Dressing & Charbonneau (2015) —. 2015, ApJ, 807, 45
- Fortney (2012) Fortney, J. J. 2012, ApJ, 747, L27
- François et al. (2004) François, P., Matteucci, F., Cayrel, R., et al. 2004, A&A, 421, 613
- Gaidos (2015) Gaidos, E. 2015, ApJ, 804, 40
- Gaidos & Mann (2014) Gaidos, E., & Mann, A. W. 2014, ApJ, 791, 54
- Gizis et al. (2016) Gizis, J. E., Marks, Z., & Hauschildt, P. H. 2016, MNRAS, 455, 3824
- Gould & Chanamé (2004) Gould, A., & Chanamé, J. 2004, ApJS, 150, 455
- Green (2013) Green, P. 2013, ApJ, 765, 12
- Hejazi et al. (2015) Hejazi, N., De Robertis, M. M., & Dawson, P. C. 2015, AJ, 149, 140
- Heng et al. (2016) Heng, K., Lyons, J. R., & Tsai, S.-M. 2016, ApJ, 816, 96
- Hirschi et al. (2005) Hirschi, R., Meynet, G., & Maeder, A. 2005, A&A, 433, 1013
- Hoeijmakers et al. (2015) Hoeijmakers, H. J., de Kok, R. J., Snellen, I. A. G., et al. 2015, A&A, 575, A20
- Holtzman et al. (2015) Holtzman, J. A., Shetrone, M., Johnson, J. A., et al. 2015, AJ, 150, 148
- Husser et al. (2013) Husser, T.-O., Wende-von Berg, S., Dreizler, S., et al. 2013, A&A, 553, A6
- Iwamoto et al. (1999) Iwamoto, K., Brachwitz, F., Nomoto, K., et al. 1999, ApJS, 125, 439
- Johansson et al. (2003) Johansson, S., Litzén, U., Lundberg, H., & Zhang, Z. 2003, ApJ, 584, L107
- Johnson et al. (2010) Johnson, J. A., Aller, K. M., Howard, A. W., & Crepp, J. R. 2010, PASP, 122, 905
- Johnson & Apps (2009) Johnson, J. A., & Apps, K. 2009, ApJ, 699, 933
- Johnson et al. (2012) Johnson, J. A., Gazak, J. Z., Apps, K., et al. 2012, AJ, 143, 111
- Karakas & Lattanzio (2007) Karakas, A., & Lattanzio, J. C. 2007, PASA, 24, 103
- Karakas (2010) Karakas, A. I. 2010, MNRAS, 403, 1413
- Kobayashi et al. (2006) Kobayashi, C., Umeda, H., Nomoto, K., Tominaga, N., & Ohkubo, T. 2006, ApJ, 653, 1145
- Kopparapu (2013) Kopparapu, R. K. 2013, ApJ, 767, L8
- Lépine et al. (2013) Lépine, S., Hilton, E. J., Mann, A. W., et al. 2013, AJ, 145, 102
- Limongi & Chieffi (2003) Limongi, M., & Chieffi, A. 2003, ApJ, 592, 404
- Lindgren et al. (2016) Lindgren, S., Heiter, U., & Seifahrt, A. 2016, A&A, 586, A100
- Lucas et al. (2001) Lucas, P. W., Roche, P. F., Allard, F., & Hauschildt, P. H. 2001, MNRAS, 326, 695
- Madhusudhan et al. (2011) Madhusudhan, N., Harrington, J., Stevenson, K. B., et al. 2011, Nature, 469, 64
- Maeder (1992) Maeder, A. 1992, A&A, 264, 105
- Maldonado et al. (2015) Maldonado, J., Affer, L., Micela, G., et al. 2015, A&A, 577, A132
- Mann et al. (2013a) Mann, A. W., Brewer, J. M., Gaidos, E., Lépine, S., & Hilton, E. J. 2013a, AJ, 145, 52
- Mann et al. (2013b) Mann, A. W., Gaidos, E., Kraus, A., & Hilton, E. J. 2013b, ApJ, 770, 43
- Mann et al. (2012) Mann, A. W., Gaidos, E., Lépine, S., & Hilton, E. J. 2012, ApJ, 753, 90
- Marigo (2001) Marigo, P. 2001, A&A, 370, 194
- Mattsson (2010) Mattsson, L. 2010, A&A, 515, A68
- Meynet & Maeder (2002) Meynet, G., & Maeder, A. 2002, A&A, 390, 561
- Moriarty et al. (2014) Moriarty, J., Madhusudhan, N., & Fischer, D. 2014, ApJ, 787, 81
- Morton & Swift (2014) Morton, T. D., & Swift, J. 2014, ApJ, 791, 10
- Moses et al. (2013) Moses, J. I., Madhusudhan, N., Visscher, C., & Freedman, R. S. 2013, ApJ, 763, 25
- Mould (1976) Mould, J. R. 1976, ApJ, 210, 402
- Mould (1978) —. 1978, ApJ, 226, 923
- Muirhead et al. (2012a) Muirhead, P. S., Hamren, K., Schlawin, E., et al. 2012a, ApJ, 750, L37
- Muirhead et al. (2012b) Muirhead, P. S., Johnson, J. A., Apps, K., et al. 2012b, ApJ, 747, 144
- Muirhead et al. (2014) Muirhead, P. S., Becker, J., Feiden, G. A., et al. 2014, ApJS, 213, 5
- Neves et al. (2013) Neves, V., Bonfils, X., Santos, N. C., et al. 2013, A&A, 551, A36
- Neves et al. (2014) —. 2014, A&A, 568, A121
- Neves et al. (2012) —. 2012, A&A, 538, A25
- Newton et al. (2014) Newton, E. R., Charbonneau, D., Irwin, J., et al. 2014, AJ, 147, 20
- Nissen (2013) Nissen, P. E. 2013, A&A, 552, A73
- Nissen et al. (2014) Nissen, P. E., Chen, Y. Q., Carigi, L., Schuster, W. J., & Zhao, G. 2014, A&A, 568, A25
- Nomoto et al. (1984) Nomoto, K., Thielemann, F.-K., & Wheeler, J. C. 1984, ApJ, 279, L23
- Önehag et al. (2012) Önehag, A., Heiter, U., Gustafsson, B., et al. 2012, A&A, 542, A33
- Passegger et al. (2016) Passegger, V. M., Wende-von Berg, S., & Reiners, A. 2016, A&A, 587, A19
- Petigura & Marcy (2011) Petigura, E. A., & Marcy, G. W. 2011, ApJ, 735, 41
- Pineda et al. (2013) Pineda, J. S., Bottom, M., & Johnson, J. A. 2013, ApJ, 767, 28
- Portinari et al. (1998) Portinari, L., Chiosi, C., & Bressan, A. 1998, A&A, 334, 505
- Rajpurohit et al. (2014) Rajpurohit, A. S., Reylé, C., Allard, F., et al. 2014, A&A, 564, A90
- Rayner et al. (2003) Rayner, J. T., Toomey, D. W., Onaka, P. M., et al. 2003, PASP, 115, 362
- Rice et al. (2015) Rice, E. L., Oppenheimer, R., Zimmerman, N., Roberts, L. C., & Hinkley, S. 2015, PASP, 127, 479
- Rojas-Ayala et al. (2010) Rojas-Ayala, B., Covey, K. R., Muirhead, P. S., & Lloyd, J. P. 2010, ApJ, 720, L113
- Rojas-Ayala et al. (2012) —. 2012, ApJ, 748, 93
- Romano et al. (2010) Romano, D., Karakas, A. I., Tosi, M., & Matteucci, F. 2010, A&A, 522, A32
- Schlaufman & Laughlin (2010) Schlaufman, K. C., & Laughlin, G. 2010, A&A, 519, A105+
- Schlaufman & Laughlin (2011) —. 2011, ApJ, 738, 177
- Sorahana & Yamamura (2014) Sorahana, S., & Yamamura, I. 2014, ApJ, 793, 47
- Sullivan et al. (2015) Sullivan, P. W., Winn, J. N., Berta-Thompson, Z. K., et al. 2015, ApJ, 809, 77
- Swift et al. (2013) Swift, J. J., Johnson, J. A., Morton, T. D., et al. 2013, ApJ, 764, 105
- Swift et al. (2015) Swift, J. J., Montet, B. T., Vanderburg, A., et al. 2015, ApJS, 218, 26
- Terrien et al. (2012) Terrien, R. C., Mahadevan, S., Bender, C. F., et al. 2012, ApJ, 747, L38
- Teske et al. (2014) Teske, J. K., Cunha, K., Smith, V. V., Schuler, S. C., & Griffith, C. A. 2014, ApJ, 788, 39
- Tsuji (2002) Tsuji, T. 2002, ApJ, 575, 264
- Tsuji (2005) —. 2005, ApJ, 621, 1033
- Tsuji & Nakajima (2014) Tsuji, T., & Nakajima, T. 2014, PASJ, 66, 98
- Tsuji & Nakajima (2016) —. 2016, PASJ, 68, 13
- Tsuji et al. (2015) Tsuji, T., Nakajima, T., & Takeda, Y. 2015, PASJ, 67, 26
- Tsuji et al. (2004) Tsuji, T., Nakajima, T., & Yanagisawa, K. 2004, ApJ, 607, 511
- Valenti & Fischer (2005) Valenti, J. A., & Fischer, D. A. 2005, ApJS, 159, 141
- van den Hoek & Groenewegen (1997) van den Hoek, L. B., & Groenewegen, M. A. T. 1997, A&AS, 123, doi:10.1051/aas:1997162
- van Zeggeren & Storey (1970) van Zeggeren, F., & Storey, S. 1970, The Computation of Chemical Equilibria (New York: Cambridge University Press)
- Woosley & Weaver (1995) Woosley, S. E., & Weaver, T. A. 1995, ApJS, 101, 181