Hard X-ray morphology of the X1.3 April 25, 2014 partially occulted limb solar flare
Abstract
At hard X-ray energies, the bright footpoint emission from solar flare loops often prevents a detailed analysis of the weaker loop-top source morphology due to the limited dynamic range available for X-ray imaging. Here, we study the X1.3 April 25, 2014 flare with the Reuven Ramaty High-Energy Solar Spectroscopic Imager (RHESSI). This partially occulted limb flare allows the analysis of the loop-top emission in isolation. We present results on the flare light curve at different energies, the source morphology from X-ray imaging and a detailed spectral analysis of the different source components by imaging spectroscopy. The loop-top source, a likely site of particle acceleration, shows a clear composition of different emission components. The results indicate the opportunities that detailed imaging of hard X-rays can provide to learn about particle acceleration, transport and heating processes in solar flares.
1 Introduction
Hard X-rays provide one of the most direct diagnostics for energetic particle processes in solar flares [1]. Studies in the past have shown that in some flares at least two distinct types of sources, namely from the coronal solar flare loop-top and chromospheric footpoints, can be distinguished [2, 3, 4, 5, 6, 7, 8, 9]. It is suggested by theory and observations that the coronal region at the loop-top is the main acceleration site for electrons (see, e.g. the review [10]). However, due to the limited dynamical range of RHESSI [11], it is often hard to clearly distinguish a coronal source, once strong footpoint emission is present. Partially occulted flares, in which the footpoints are a few degrees behind the solar limb, offer the opportunity to observe the coronal sources in isolation. Krucker & Lin [12] performed a statistical study of partially occulted flares during solar cycle 23. They concluded that thin-target radiation of electrons is a plausible scenario for the coronal emission. Some of the analyzed flares also show significant structure, indicating multiple coronal source regions. Kappa-distribution models [13, 14, 15] have been discussed as possible models for coronal X-ray sources, in particular if the sources are separated into different components, including an “above-the-loop-top” source.
Here, we focus on the X1.3 April 25, 2014 partially occulted limb flare, which shows a rich loop-top source morphology. Results on the flare light curve in different energies, the source structure from X-ray imaging, and a detailed spectral analysis of the different source components from imaging spectroscopy are presented. We note that this flare has also recently been studied in the context of CME initiation and a magnetic breakout scenario. See the paper by Chen et al. [16] for further details on these aspects.
2 Temporal evolution
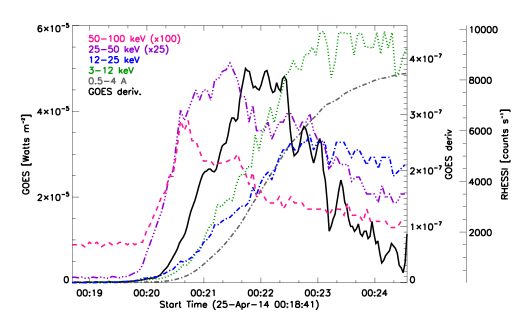
We analyzed the temporal evolution of the hard X-ray flux for this flare and compared it with the GOES soft X-ray evolution in the high energy channel (0.4 to 4 Å). The left panel of Figure 1 gives an overview of the RHESSI light curve in four energy channels and the correlation with the GOES flux and its time derivative.
It can be seen that the two lowest energy channels are delayed with respect to the GOES derivative and are roughly correlated with the slow rise in GOES flux. The two high energy channels 25-50 keV and 50-100 keV, on the other hand, have an earlier and quicker rise to their maxima. In particular the 50-100 keV shows a prominent peak at the early onset and then a fast decay. A cross-correlation analysis showed the best correlation between the 25-50 keV channel and the GOES derivative, with a correlation coefficient of 0.81 and a lag of 12 s.
We note that a statistical study of more partially occulted events is currently in progress and a significant number of flares show better correlations and often small or zero lag. The implications of these results, in particular in the context of the so-called Neupert effect [17, 18], will be discussed elsewhere.
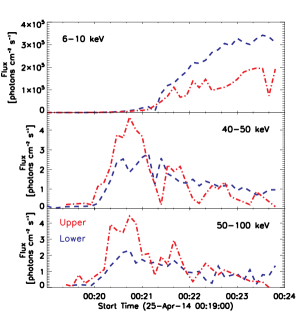
The right panel of Figure 1 shows the photon flux evolution in two different regions of the coronal source, namely an upper and lower part. The regions are defined in the right panel of Figure 2. We see that there is a faster rise at high energies in the upper part of the coronal source resulting in a stronger maximum. The lower energy fluxes slowly rise to larger values for the lower source. We now turn to the details of the source structure in X-ray images.
3 Hard X-ray Imaging
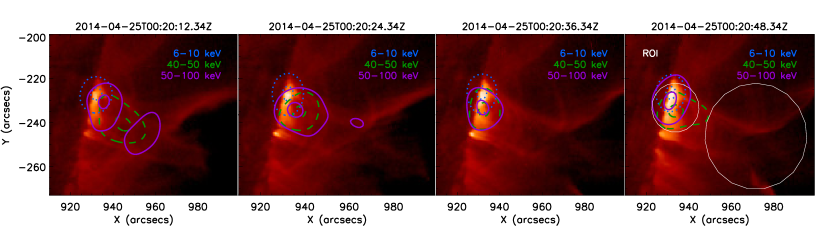
RHESSI’s unique imaging capability allows a detailed study of the spatial structure of the hard X-ray emission. In Figure 2, we present the evolution over four subsequent time intervals of 12 s length. The X-ray contours, obtained using the CLEAN algorithm [19], at three different energies are overlaid over AIA 131 Å background images closest in time to the RHESSI integration time interval (start times given above the images). An expanding upper loop structure can be detected in the AIA images, associated to a high energy (50-100 keV) upper source moving outwards.
The high energy (up to 100 keV), non-thermal loop-top emission comes mainly from the upper region of the X-ray source, while the thermal 6-10 keV emission is much stronger in the lower parts of the loops. We note that no quasi-footpoint emission is detected, confirming that the flare is partially occulted and that we are seeing a simultaneously observed loop-top and a second higher above-the-loop-top source (see, e.g., [20, 21, 22]). These uncommon observations allow us to separate the upper and lower coronal emission for further studies. To this end, we performed an imaging spectroscopy study discussed next.
4 Imaging spectroscopy
Thanks to the high energy and spatial resolution of RHESSI, it is possible to obtain X-ray spectra of different separated regions. In order to study the spectral evolution of the two sources, we defined two regions of interest (ROI), indicated as white circles in the right panel of Figure 2. We obtained photon spectra of the two different regions resulting from the CLEAN images of these regions.
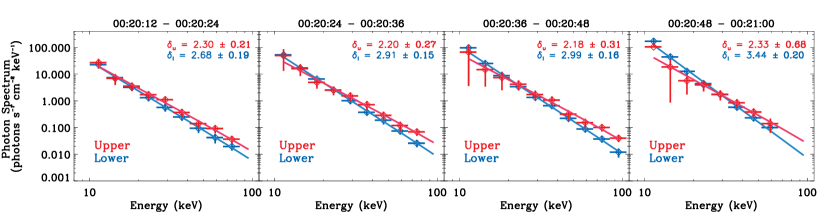
The red and blue data points of Figure 3 give the results for the upper and lower sources, respectively, at four different times. The spectra are fitted to a thin-target model with a power law electron energy spectrum. The resulting electron spectral index is reported in the bottom part of the figures. In general, the upper source has a harder high energy spectrum.
The fit derived from the thin target model is in good agreement with the data in all cases. We note that a thick-target model is often not an appropriate model for coronal sources, due to the low column depth of gas in the source (see, however, [23]). In particular, the relevant time scales of particle escape and energy loss in the loop source are often such that particles tend to lose only a fraction of their energy before they escape. This was found in the study by Chen & Petrosian [24] for an X3.9 and an M2.1 on disk flares, where these time scales could be determined non-parametrically with an inversion procedure.
A thin-target kappa function fit [13] to the photon spectra gives, as should be expected, almost identical values for and . This is due to the fact that is defined to be the parameter in the number density distribution while is the index of the electron flux density distribution, see the discussion in [14]. We do not show these fit results since they look very similar to Figure 3.
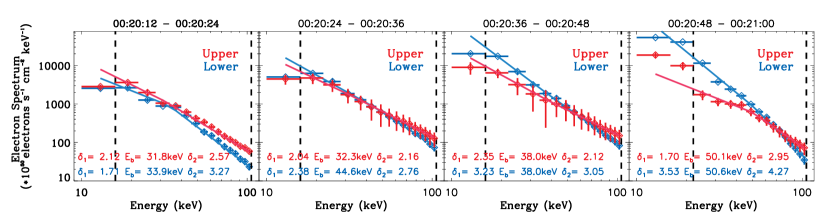
To gain an additional perspective on the spectral properties of electrons, we obtained electron images and spectra directly using a regularized imaging inversion method [25]. The resulting electron images (not shown) display a similar upward motion of the upper source as in the photon images. The electron spectra for the same ROI are shown in Figure 4, and were fitted to a broken power-law. We see that there is significant electron flux at high energies, with clear power-laws extending to up to keV, for both source regions. Considering that the errors in the fitting parameters are of the same order as in the previous thin-target fit, the upper source has generally slightly harder spectral indices and higher fluxes at high energies, pointing at a possibly more effective acceleration mechanism in this part of the loop. Most of the spectra are compatible with a single power-law, in particular for the two time intervals in the middle.
Taking into account the confidence intervals for the photon spectra thin target fitting parameters, as stated in Figure 3, we find that the resulting electron spectra are in reasonable agreement for both methods. This confirms the notion of thin-target emission for the entire coronal source region and gives independent support to the different spectral characteristics of the two parts of the source.
5 Conclusions
We have analyzed the X1.3 April 25, 2014 partially occulted limb flare in hard X-rays with RHESSI imaging and spectroscopy. The coronal emission shows a rich morphology with at least two different coronal source regions. The upper source is moving upwards and detaching from the lower source during the flare evolution over a short time interval of tens of seconds (see also [26, 27] for similar observations of other flares).
We found a different electron spectral behavior in the upper and lower source derived from a forward thin-target fit and regularized imaging inversion. The differences between the results obtained with the two methods are mostly within the error bounds. The upper source has somewhat smaller (harder) spectral indices than the lower source. Different scenarios could explain this result. Assuming the reconnection region lies between these two source regions, the effective distance to the reconnection region could imply different turbulence levels. This in turn can result in harder (higher turbulence level) or softer (lower turbulence level) electron spectra for the accelerated population [20, 28].
For further insights into the differences of coronal source modeling and electron properties, a larger sample of partially occulted flares needs to be studied. Detailed comparisons with simulations of particle acceleration and transport will help to uncover the acceleration mechanisms at work in different parts of the flare loop.
The authors thank S. Krucker for suggesting the combined RHESSI and GOES light-curve analysis. F.E. thanks the organizers and participants of the 15th Annual International Astrophysics Conference for the stimulating discussions. This work was supported by NASA grants NNX14AG03G and NNX13AF79G.
References
References
- [1] Fletcher L, Dennis B R, Hudson H S et al. 2011 Space Sci. Rev. 159 19–106
- [2] Frost K J and Dennis B R 1971 ApJ 165 655
- [3] Roy J R and Datlowe D W 1975 Sol. Phys. 40 165–182
- [4] McKenzie D L 1975 Sol. Phys. 40 183–191
- [5] Hudson H S 1978 ApJ 224 235–240
- [6] Masuda S, Kosugi T, Hara H, Tsuneta S and Ogawara Y 1994 Nature 371 495–497
- [7] Petrosian V, Donaghy T Q and McTiernan J M 2002 ApJ 569 459–473
- [8] Krucker S, White S M and Lin R P 2007 ApJ 669 L49–L52
- [9] Simões P J A and Kontar E P 2013 A&A 551 A135
- [10] Petrosian V 2012 Space Sci. Rev. 173 535–556
- [11] Lin R P, Dennis B R, Hurford G J et al. 2002 Sol. Phys. 210 3–32
- [12] Krucker S and Lin R P 2008 ApJ 673 1181–1187
- [13] Kašparová J and Karlický M 2009 A&A 497 L13–L16
- [14] Oka M, Ishikawa S, Saint-Hilaire P, Krucker S and Lin R P 2013 ApJ 764 6
- [15] Bian N H, Emslie A G, Stackhouse D J and Kontar E P 2014 ApJ 796 142
- [16] Chen Y, Du G, Zhao D, Wu Z, Liu W, Wang B, Ruan G, Feng S and Song H 2016 ApJ 820 L37
- [17] Neupert W M 1968 ApJ 153 L59
- [18] Veronig A M, Brown J C, Dennis B R, Schwartz R A, Sui L and Tolbert A K 2005 ApJ 621 482–497
- [19] Hurford G J, Schmahl E J, Schwartz R A et al. 2002 Sol. Phys. 210 61–86
- [20] Liu W, Petrosian V, Dennis B R and Jiang Y W 2008 ApJ 676 704-716
- [21] Liu W, Chen Q and Petrosian V 2013 ApJ 767 168
- [22] Oka M, Krucker S, Hudson H S and Saint-Hilaire P 2015 ApJ 799 129
- [23] Fleishman G D, Xu Y, Nita G N and Gary D E 2016 ApJ 816 62
- [24] Chen Q and Petrosian V 2013 ApJ 777 33 (Preprint 1307.1837)
- [25] Piana M, Massone A M, Hurford G J, Prato M, Emslie A G, Kontar E P and Schwartz R A 2007 ApJ 665 846–855
- [26] Sui L and Holman G D 2003 ApJ 596 L251–L254
- [27] Sui L, Holman G D and Dennis B R 2004 ApJ 612 546–556
- [28] Petrosian V and Liu S 2004 ApJ 610 550–571