Si K Edge Structure and Variability in Galactic X-Ray Binaries
Abstract
We survey the Si K edge structure in various absorbed Galactic low-mass X-ray binaries (LMXBs) to study states of silicon in the inter- and circum-stellar medium. The bulk of these LMXBs lie toward the Galactic bulge region and all have column densities above cm-2. The observations were performed with the Chandra High Energy Transmission Grating Spectrometer. The Si K edge in all sources appears at an energy value of 18440.001 eV. The edge exhibits significant substructure which can be described by a near edge absorption feature at 18490.002 eV and a far edge absorption feature at 18650.002 eV. Both of these absorption features appear variable with equivalent widths up to several mÅ. We can describe the edge structure with several components: multiple edge functions, near edge absorption excesses from silicates in dust form, signatures from X-ray scattering optical depths, and a variable warm absorber from ionized atomic silicon. The measured optical depths of the edges indicate much higher values than expected from atomic silicon cross sections and ISM abundances, and appear consistent with predictions from silicate X-ray absorption and scattering. A comparison with models also indicates a preference for larger dust grain sizes. In many cases we identify Si xiii resonance absorption and determine ionization parameters between log = 1.8 and 2.8 and turbulent velocities between 300 and 1000 km s-1. This places the warm absorber in close vicinity of the X-ray binaries. In some data we observe a weak edge at 1.840 keV, potentially from a lesser contribution of neutral atomic silicon.
1 Introduction
Our knowledge about how much dust is suspended in the gas phase of the interstellar medium (ISM) is important for our understanding of what the ISM is composed of and how the ISM evolves. The metal composition of the ISM helps define the cooling and star formation rates in our Galaxy. Determining the composition of the ISM also teaches us about metal enrichment through supernova explosions in various regions in the Galaxy. In this respect there are fundamental differences between the Galactic disk versus the Galactic bulge. Metal enrichment through supernova activity is thought to be very effective in the bulge and here we expect overabundances relative to disk compositions, specifically with respect to higher Z elements. This likely drives the dust-to-gas ratio in the ISM in various regions of the Galaxy and we expect the dust depletion factors to be different than in the Galactic disk.
The fact that significant fractions of Mg, Si , and Fe are depleted into dust grains in the ISM has been established in the second half of the last century (Draine & Lee, 1984; Savage & Sembach, 1996; Draine, 2003). Significant amounts of silicates are required to explain extinction in the infrared (Draine, 2003). Another issue arises about how silicates actually agglomerate into dust grains, which impacts interpretations of results from X-ray dust scattering (Smith, 2008; Xiang et al., 2011; Seward & Smith, 2013)) is well as IR signatures (see Mathis 1998).
![[Uncaptioned image]](/html/1605.04837/assets/x1.png)
The quantum efficiencies of FI (red) and BI (blue) devices onboard chandra. FI devices have a substantial instrumental Si K edge and much lower efficiences.
Generally dust signatures in the IR to UV band are inferred indirectly through extinction curves and to date only partially identified absorption bands. The X-ray band offers a rare opportunity to measure elemental dust compositions directly through X-ray absorption fine structures (XAFS) and X-Ray absorption near edge structure (XANES). One of the expectations with the advent of the High Energy Transmission Grating (HETG) spectrometer (Canizares et al., 2005) was to measure precise photoelectric edges of major cosmic elements such as O, Ne, Mg, Si, S, Ar, Ca, and Fe. While great strides have been made since the launch of Chandra and XMM-Newton to determine structure and optical depths of O K, Ne K, and Fe L edges (Paerels et al., 2001; Takei et al., 2002; Schulz et al., 2002; de Vries et al., 2003; Juett, Schulz & Chakrabarty, 2004; Juett et al., 2006), studies of properties of higher Z edges have been rare to date. There are some individual references of silicon properties in early Chandra observations of sources like GRS 1915+105 (Lee et al., 2002) and GX 13+1, GX 5-1, and GX 340+0 (Ueda et al., 2005). The latter study specifically analyzed X-ray binary HETG data of silicon and found a strong presence of X-ray absorption fine structures (XAFS) in these sources. The study concluded from these observations of GX sources that most of the silicon abundance exists in the form of solid silicate dust.
In this paper we provide a comprehensive survey of the Si K edge structure as observed the HETG spectrometer onboard Chandra . The survey includes 45 observations of 11 sources with column densities larger than about cm-2 and X-ray fluxes between 40 and 1100 mCrab. The study is limited to the Si K edge region and the determination of the edge energy and optical depth as well as any accompanying absorption components. We specifically focus on edge location, optical depths, common discrete absorption features, and variability.
2 Chandra Observations
To date there are 45 HETG observations in the Chandra archive of sources which have column densities near or above cm-2 and sufficient X-ray flux to study the Si K edge region. These observation are summarized in Table 1. The sample involves 11 Galactic sources with several observations for each source ranging from one observation for 4U 1624-49 up to eight observations for GX 349+2 in various data modes.
All observations were processed using CIAO4.6 with the most recent CALDB products and the on-line transmission grating catalog (TGCAT111see http://tgcat.mit.edu/ Huenemoerder et al. (2011)) processing procedures. The zero-order point spread function (psf) is heavily piled up in most observations and an improved zero-order position was determined using findzo.sl which uses the intersection of the psf read-out streak and the HETG dispersion tracks 222see also http://asc.harvard.edu/ciao/threads/.
TABLE 1: OBSERVATIONS AND SOURCE PARAMETERS: SOURCE OBSID Date Start Exp. Rate Mode Ftime RA DEC NH Fx UT UT ks c/s s deg deg (1) (2) GX 5-1 716 2000-07-18 06:32:12 8.9 67.1 TE 1.328 270.284 -25.079 5.78 0.65 0.43 5888 2005-10-30 02:03:55 45.0 65.1 CC 0.003 5.76 0,68 3.00 10691 2009-02-10 05:30:21 8.0 61.8 CC 0.003 5.67 0.95 2.92 10692 2009-05-14 09:10:17 8.1 68.9 CC 0.003 5.36 0.91 3.05 10693 2009-05-24 21:29:26 8.1 51.4 CC 0.003 6.05 1.11 2.81 10694 2009-10-27 22:25:49 5.0 50.2 CC 0.003 5.61 1.14 2.75 GX 13+1 2708 2002-10-08 11:12:56 29.3 13.8 TE 1.094 273.632 -17.157 4.30 0.51 0.74 11814 2010-08-01 00:31:31 28.1 11.7 TE 1.094 4.54 0.60 0.62 11815 2010-07-24 05:46:27 28.1 14.6 TE 1.094 4.63 0.53 0.75 11816 2010-07-30 14:47:25 28.1 14.2 TE 1.094 4.65 0.53 0.74 11817 2010-08-03 10:12:10 28.1 13.5 TE 1.093 4.64 0.51 0.62 11818 2010-08-05 14:09:39 23.0 17.2 CC 0.003 4.22 1.07 0.76 13197 2011-02-17 17:57:04 10.1 17.1 CC 0.003 4.32 1.66 0.71 GX 9+1 717 2000-07-18 03:20:24 8.4 23.0 TE 1.647 270.385 -20.529 1.72 0.30 1.00 6569 2007-05-11 19:41:36 33.6 36.8 CC 0.003 2.02 0.28 1.12 GX 349+2 715 2000-03-27 18:25:04 9.4 40.8 TE 0.9375 256.435 -36.423 2.02 0.90 1.57 3354 2002-04-09 00:43:26 25.7 25.8 TE 1.375 1.98 0.65 1.58 6628 2006-07-04 18:52:16 12.5 77.0 CC 0.003 2.52 0.29 2.33 7336 2006-08-20 05:36:32 12.1 68.2 CC 0.003 2.52 0.28 1.41 12199 2011-10-09 04:31:35 19.2 42.2 CC 0.003 2.44 0.29 1.92 13220 2011-07-05 20:04:36 18.9 43.6 TE 0.9375 2.18 0.25 0.88 13221 2011-05-15 04:43:48 23.0 46.6 CC 0.003 2.35 0.27 1.50 13222 2011-10-18 08:42:43 32.5 48.7 CC 0.003 2.44 0.26 1.52 GX 17+2 4564 2004-07-01 11:35:16 30.1 41.2 CC 0.003 274.006 -14.036 3.64 0.38 1.64 6629 2006-05-10 01:59:44 23.6 43.5 CC 0.003 3.55 0.37 1.76 6630 2006-08-19 22:26:31 24.0 40.9 CC 0.003 3.58 0.39 1.54 11088 2010-07-25 08:18:44 29.1 29.5 TE 1.125 3.75 0.38 1.27 11888 2010-07-24 14:10:03 4.6 32.2 CC 0.003 4.03 0.50 1.61 GX 340+0 1921 2001-08-09 05:36:19 23.4 8.4 TE 1.25 251.449 -45.611 6.31 1.05 0.64 1922 2001-08-09 12:35:11 5.8 12.8 CC 0.003 6.81 0.99 0.90 6631 2006-05-19 20:11:58 25.0 20.7 CC 0.003 6.84 0.78 0.13 6632 2006-06-21 10:08:31 23.6 19.9 CC 0.003 6.61 0.77 0.13 4U 1705-44 1923 2001-07-01 17:20:28 24.4 18.5 TE 1.25 257.227 -44.102 3.11 0.35 0.79 1924 2001-06-25 00:38:41 5.9 25.9 CC 0.003 3.46 0.60 0.91 5500 2005-10-26 07:20:13 26.5 5.8 TE 1.25 3.86 0.39 0.17 4U 1728-34 2748 2002-03-04 15:19:31 29.6 3.4 TE 1.25 262.990 -33.834 5.54 0.62 0.17 6567 2006-07-18 19:51:21 151.25 11.1 CC 0.003 4.41 0.47 0.42 6568 2006-07-17 12:42:01 49.3 9.0 CC 0.003 4.44 0.48 0.33 7371 2006-07-22 21:46:23 39.6 6.3 CC 0.003 4.45 0.54 0.23 4U 1624-49 4559 2004-06-04 06:25:02 73.4 1.4 TE 1.6 247.010 -49.190 6.47 0.72 0.11 GX 3+1 2745 2002-04-09 10:50:50 8.9 29.6 CC 0.003 266.983 -26.564 3.40 0.50 0.99 16307 2014-07-22 23:36:59 43.6 18.8 TE 1.094 3.47 0.38 0.71 16492 2014-08-17 00:05:52 43.6 19.2 TE 1.094 3.55 0.38 0.71 Ser X-1 17485 2015-02-13 08:08:40 83.2 22.3 TE 0.42 279.990 +05.036 1.23 0.13 0.54 17600 2015-02-21 06:36:50 37.1 21.7 TE 0.42 1.42 0.17 0.46
(1) 1022 cm-2; (2) 10-8 erg s-1 sec-2
The spectral analysis was performed using the latest version of ISIS333see http://space.mit.edu/ASC/ISIS with imported Xspec.v12 functions for spectral modeling. Uncertainties are 90 confidence limits calculated using the multi-parameter grid search utility confloop in ISIS (Houck & Denicola, 2000). In all cases we had sufficient statistics to pursue minimization. In the case of searching for more detailed edge structure we also employed a cash statistic in combination with a subplex fit method as provided by ISIS.
2.1 Data Modes and Reduction
Table 1 shows that about 40 of the observations were taken in timed event (TE) mode. Some of these data were taken in the early phases of the mission where the effects of pileup in the HETG has not yet fully been recognized and mitigated. Specifically in observations IDs 1000, photon pileup in grating spectra is significant and even though there are procedures to reconstruct the data, these results have high systematic uncertainties. We include these data in the survey but treat them with caution. Most TE mode data were taken with tight subarrays with row numbers between 300-420 and consequently much lower frame times. The bulk of the pileup events comes from the MEG +1st order where the Si K edge resides on a back-illuminated CCD. These devices have significantly higher effective areas between 1 and 3 keV than front-illuminated devices and in TE mode we exclude some of these data (see Fig. 1). We can in extreme cases eliminate significant sources of pileup by only using HEG +/-1st orders. The optical depths in the TE mode sample are then affected up to by pileup at the Si K edge in the worst cases.
In most cases, however, pileup affects the edge by much less than . We tested this on the example of GX 13+1 using the gpile2 function in ISIS, which allows a simple pileup reconstruction of HETG continuum spectra. Even though here we find pileup of up to 20 in the hard parts of the spectra Å, the value around Si K was of the order of . The continua in LMXB spectra increase with energy in part because of absorption due to high column densities but also intrinsically. Thus even though the HETG effective area is high around Si, the bulk of the photon pileup affects the hard part of the spectra. Furthermore, an edge optical depth is only affected by the pileup difference between the top and the bottom edge flux. In GX 13+1 the difference of the effective pileup at the top and bottom of the Si K edge is less than . The average effect in all sources is and we correct optical depths upwards by this amount as well as add this amount to the uncertainties in optical depth and equivalent width.
The remainder of the data were taken in continuous clocking (CC-mode) with a fast read time (note: the frame times in Table 1 are approximate and for reference only). Here the spectra are devoid of any pileup and ideally the edge structure and optical depth are fully preserved. However, absorbed CC-mode spectra are affected by contributions from dispersions from all incident photons. In most cases this at least includes the central source but also a substantial scattering halo. In CC-mode these contributions collapse into a one dimensional image and the HETG extraction then contains the source spectrum as well as dispersed photons from the zero order scattering halo which get added to the dispersed first order spectra and ultimately will alter the spectral shape of these spectra. In addition, while in TE- and CC-mode any contributions including the ones from higher orders are effectively filtered out by the pulse height channels in every CCD pixel, this filter is not fully effective in CC-mode. For example, the HEG 1st orders are confused by the MEG 2nd orders. In the sources of this sample the scattering halo is prominent because of the high absorption columns involved. While the edge structure remains preserved, optical depth values become affected. From comparisons with data taken in TE-mode we estimate that this effect adds about 20 systematic uncertainty to the optical depth on average.
FI devices also have an intrinsic Si K edge from the SiO2 gate structural layer located at the atomic Si K edge location. A high resolution correction is applied in TE-mode data to account for this contribution. However, since the optical depths appear slightly reduced in CC-mode due to the effects described above, this correction cannot be properly applied and we cannot use FI data. In BI devices there is no significant instrumental contribution to the Si K edge (see Fig. 1)and in CC-mode we therefore use exclusively the MEG +1st order located on the S3 device. We then correct optical depths by 20 as well as add this amount to the uncertainties in optical depth and equivalent width.
2.2 Survey Source Parameters
The spectra were all fitted with a two component spectral model consisting of a disk blackbody in the soft and a power law in the hard end of the spectral bandpass plus absorbing column density for which we used the TBnew function in XSPECv12. For this continuum fit we apply the ISM abundances from Wilms, Allen & McCray (2000). The bandpass is limited at the soft end by the high column density to about 9Å (1.4 keV) and at the high end to 5.2 Å (2.6 keV) in CC-mode spectra leaving about 180 independent resolution bins for the spectral fitting in MEG spectra, and 340 bins in HEG spectra. The spectra are well fit by this model with reduced values below 1.8 in the worst case. Note, in this analysis we do not require a physical interpretation of the spectral continuum, but want a good representation for flux and broadband column densities. The resulting hydrogen equivalent column densities are listed in Tab. 1. We will use this column as the x-scale in some of the plots. All sources are bright with 1st order count rates between as low as 1.4 cts/s to as high as 77 cts/sec, which translates to a flux range of 1 erg s-1 to 3 erg s-1 (0.04 to 1.1 Crab) in the range between 2 and 10 keV. The column densities in the data vary from 1.23 cm-2 in obsid 17485 for Ser X-1 and 6.84 cm-2 in obsid 6631 for GX 340+0. The columns have low statistical but a substantial systematic error of 10 added due to the limited bandpass. Most values obtained are consistent within these uncertainties with columns obtained in previous studies.
![[Uncaptioned image]](/html/1605.04837/assets/x3.png)
The Si K optical depths from the Draine (2003) model calculated for the MRN grain size distribution (top) and for large grain sizes of 0,3 m (middle) from dust codes in Corrales & Paerels (2015). Shown are absorption and scattering as well as the final extinction functions. The red and green double arrows mark the optical depth extractions for cases A and B. A comparison of various grain sizes (bottom) shows that X-ray extinction at Si is very similar for the MRN distribution and small grain sizes, while larger sizes behave significantly different due to increased contributions from scattering.
2.3 Survey Analysis Strategy
The variety of data modes and their systematic uncertainties do not allow to directly fit models to these data to determine sensible physical information. However, the data are good enough to deduce common trends with respect to existing models. First, we take advantage of the superbly calibrated energy (wavelength) scale of the Chandra HETG data. The scale calibration is entirely independent of the data modes and have low systematical uncertainties for all survey data. In this respect we will determine most accurate energy (wavelength) locations of Si K edge features with mosty statistical variances of the order of about 1 eV or 4 mÅ.
Second, the optical depths of features in the Si K edge is a directly measurable quantity fairly independent of the detailed shape of the edge but still subject to systematical uncertainties that come with the use of various data modes. However in the case of the optical depths we can account for most of them. In this paper we therefore survey the data in terms of how optical depths of Si K absorption features distribute among X-ray sources in the Galactic bulge and how these properties compare to predictions from existing models of atomic and silicate absorption models.
3 Edge Models
There are several ways to describe neutral absorption edges of elements and molecular compounds. These range from the standard edge model usually describing elements in their basic atomic form up to more complex structure: low ionization levels as shown for O-K and Ne-K (Juett, Schulz & Chakrabarty, 2004; Juett et al., 2006), multiple edges from unresolved resonances as in Fe-L (Kortright & Kim, 2000; Schulz et al., 2002), and complex structures from laboratory measurements as applied in Ueda et al. (2005) for the cases of magnesium, silicon, and sulfur K edges. In the following we describe the models we use for our Si K data in detail.
3.1 Standard Edge Absorption
In order to explore a first cut of the structure of the Si K edge, we employ the standard edge function implemented in XSPECv12. The K edge structure can be decomposed into various elements. Standard edge parameters are the edge location ( [Å], [keV]) and optical depth giving it a step like shape. The function in detail is
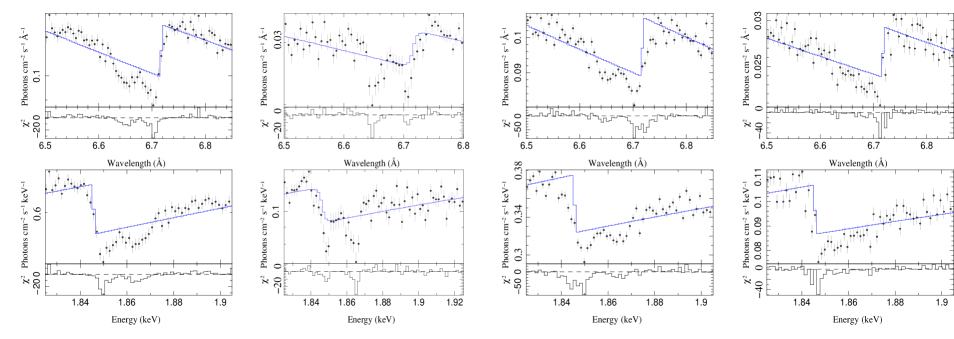
with an exponential edge recovery at the high energy side. The edges in the survey are also accompanied by structure, which in all cases are represented as Gaussian shaped absorption features. Figure 1 shows edge structure examples in four different sources plotted on an Å (top) and keV (bottom) scale. The following subsections describe these structures in detail for all survey sources.
3.2 Extinction from Silicate Dust
Most previous efforts to decribe neutral and near neutral absorption edges in the X-ray band relied entirely on atomic absorption properties at or in the vicinity of the edge. In the case of silicon this approach is incomplete since it is now assumed that at least a significant fraction of Si is bound in molecular form and conglomerated into dust grains. In that case X-rays in the line of sight are affected by scattering as well as absorption, both contributing to the affecting optical depth. The sum of the absorption and scattering optical depth is called extinction and affects radiation throughout the entire electromagnectic spectrum. Studies by Weingartner & Draine (2001), Draine (2003) and most recently Hoffman & Draine (2015) and Corrales et al. (2016), laid out some of the ground work how to treat the Si K edge band with respect to both scattering and absorption.
Figure 2.2 shows the optical depth from the Draine (2003) model per unit column for the Si K edge for scattering, absorption and total extinction (see also Corrales et al. 2016). Using the dust scattering codes of Corrales & Paerels (2015), the total Si K edge extinction cross section shown in Figure 2.2 (top) was calculated from a power law distribution (MRN) of dust grain sizes (see Mathis 1998), where is the radius for spherical dust grains. The minimum and maximum cut-offs to the grain size distribution were and , respectively. To calculate the Mie scattering cross section, we use the optical constants derived by (Draine, 2003), which rely on laboratory Si K edge absorption measurements of silicate materials (Li et al., 1995), in this case specifically modeling properties of olivines, i.e. Mg2SiO4. Figure 2.2 (middle) shows the same but for 0.3 m grain sizes only. To arrive at the total opacity of the Si K edge, Figure 2.2 assumes that all neutral Si is locked up in dust and that all of the interstellar dust is in amorphous silicate (olivine) form. These calculations also were done using solar abundances (Asplund et al., 2009) and we use a renormalization factor (0.59 for olivine) to convert to ISM abundances (Wilms, Allen & McCray, 2000) used in the data analysis.
![[Uncaptioned image]](/html/1605.04837/assets/x4.png)
The measured Si K edge locations of all survey sources as determined by the standard edge model (unfilled circles). The lower straight line marks the average value at 1.844 keV. Also plotted are the centroid values of the near (filled squares) and far edge (unfilled squares) absorption features where they were detected. The upper straight line marks the rest frame value of the Si xiii resonance line. A wavelength scale is added on the right side.
The fit with the standard edge function determines the optical depth of the Si K edges in all survey observations. This optical depth ignores additional edge structure and treats the Si K edge as the simple step function determined by the continuum below and above the edge location (in keV units). We refer to these depths as case A. Another method to determine the optical depth is to refer to the flux values directly below and above the edge location (in keV units), which accounts for the substructure - in this case the near edge absorption (see Sect. 4.3) - of the edge. Here the optical depth is calculated by
| (1) |
where is the flux below, the flux above the edge location where it is lowest (with respect to energy scale). We refer to these depths as case B.
4 Measuring the Si K Edge Structure
4.1 Edge Location
We fitted all Si K edge data with the standard edge model described in Eq. 1. The unfilled circles in Figure 3.2 show the measured Si K edge energies for all survey sources as a function of source flux. The measured edge energies show little variations, the smallest value we find is at 1.840 keV, the largest at 1.848 keV, both these values come from edges with lower statistics. Edge values cluster tightly around an average value of 0.001 keV (0.004 Å). Many of these edges have additional structure and the edge fit here does not take in account any contribution from the near edge absorption feature (Sect. 4.3) which adds a systematic uncertainty of another 0.75 eV (0.003 Å). Variations within single sources are very small, the largest deviations are again associated with lower statistics. We do not observe any dependence of the edge location with source flux, nor any correlations with other source or edge parameters. The expected atomic edge location is 1.839 keV (Bearden & Burr, 1967) and the measured values are larger by 5 eV, which is an order of magnitude larger than the uncertainty of the HETG energy scale.
4.2 Optical Depth
The hydrogen equivalent column density for a specific element relates to the optical depths via the absorption cross sections as
| (2) |
where the abundance from a specified distribution and is an over-abundance factor Here we generally refer to ISM abundances from Wilms, Allen & McCray (2000). The atomic absorption cross section in that study has a value of 1.58 cm2 from Verner & Yakovlev (1995).
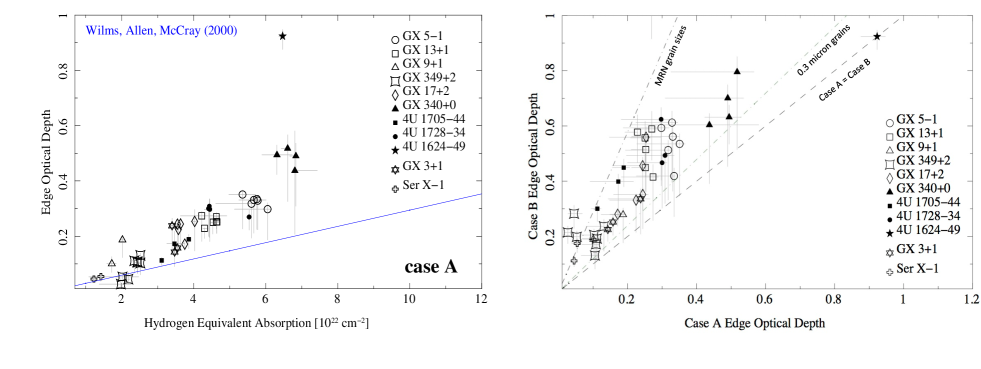
Case A depths (see definition in Fig. 2.2) show that the measured optical depths in most sources are significantly higher than expected from the ISM abundance and the atomic Si cross section (blue line), on average about a factor 2. For all sources we obtain values for Si abundance factors when we fit the edges with the TBnew function and a free Si abundance parameter. We will show below that that much of this apparent overabundance is removed when we use better Si cross sections. The scatter of the data within each of the sources (i.e. same symbols) is mostly due to the different data modes. Case B depths (see Fig. 2.2) of all sources are much larger by factors 1.6 (GX 349+2) up to a factor 5 (GX 13+1) (Figure 2). The plot on the left shows the case A optical depths versus the fitted broadband column densities. Even though there is some scatter in the data, the optical depths show a good correlation with overall column. The plot on the right shows the case A optical depths versus the case B optical depths. The scatter of case B optical depths is somewhat larger. This is likely due to systematic variations from the different data modes (see Sect. 2.1) as well as variability in the near edge absorption features (see below).
These depth excesses cannot be attributed to any of our measuring deficiencies as either pileup in TE mode as well as imaging distortions in CC mode would reduce our edge optical depth determinations. Note, 4U 1624-49 is exceptional in that the depth is higher by about a factor 5 for case A, but here the case for substantial intrinsic absorption is known (Xiang et al., 2009). Here it is also interesting to note that the data do not show any near edge absorption (case A = case B).
4.3 Near Edge Absorption
The Si K edge structures in Figure 1 show significant absorption close to the bottom of the edge function. We modeled the properties of this absorption by fitting a broadened Gaussian function to the data. The filled squares in Figure 3.2 show the centroids of the absorption line fits. Their values lie between 1.844 and 1.852 keV with the bulk fit at 1.849+0.002 KeV (6.7060.006 Å). In some cases this absorption feature has very low contrast with respect to the edge function and the centroid fit overlaps with the actual edge location. In the MEG, where we have most of our data, we observe this as a smeared but steep and unresolved edge drop. The average offset of the absorption centroid with respect to the edge location is about 5 eV.
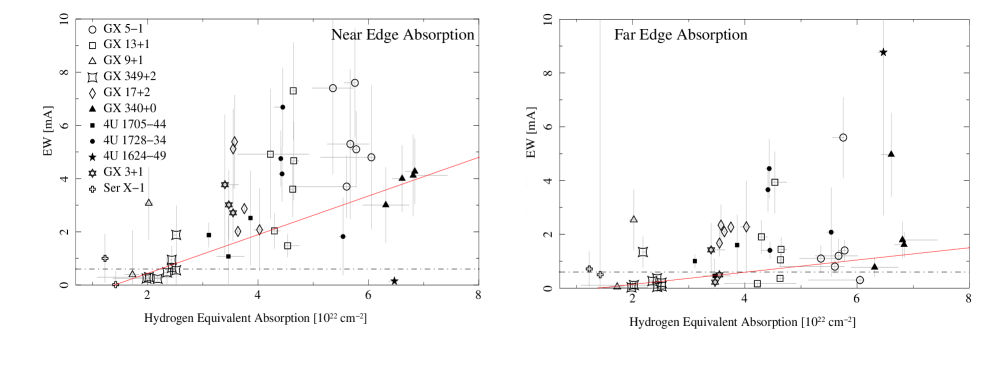
Figure 3 (left) shows the measured near edge absorption equivalent widths with respect to column density for all survey observations. The equivalent widths cover a range of values between 0.6 and 8 mA. The horizontal hatch-dot line at 0.6 mA marks the non-detection limit for most observations and any value below that line is an upper limit. The red line marks a regression to the lowest values in all sources. It is very close to what equivalent widths would we expect from the models in Fig. 2.2. There is a correlation of equivalent widths with column density in that the equivalent widths become larger with increasing column density. This is not surprising as this reflects the general behavior of absorbing power on the curve of growth. However, there are many widths that are above the expectation from the model and there is a significant amount of scatter.
4.4 Far Edge Absorption
We also modeled the far edge absorption feature using a Gaussian function. The centroids are plotted in Figure 3.2 as unfilled squares. The values center tightly around 1.865+/-0.001 keV (6.6480.005 Å). The straight line fit is the location of the rest wavelength of resonance line of He-like Si xiii as listed in APED444http://www.atomdb.org and XSTAR555http://heasarc.nasa.gov/docs/software/xtar/xstar.html. The actual fit to the values is almost identical to this line and we identify this feature with Si xiii.
The measured equivalent widths (see Figure 3 right) range between 0.6 and 8 eV and are similar to the amounts observed in the near edge absorption feature. In the case of the far edge feature, however, many values are not significantly detected and measurements scatter near or below the detection threshold. The correlation of equivalent width with column density is much less pronounced compared with the near absorption case, which is expected most of that feature comes from plasma material close to the sources.
4.5 Variability and Source Differences
We noticed that even though in many sources the general appearance of the Si K edge seemed quite similar, there were also some major differences. Most apparent was the difference between 4U 1624-49, which hardly shows any structure, i.e. the case A optical depth is equal to the case B optical depth, and GX 5-1, which perhaps exhibits the most prominent pattern, i.e. the case A optical depth is significantly smaller than the case B optical depth, even though both sources have large columns.
When we compare different observations of the same source, we find that both, near and far edge absorption appear variable. This is the case in at least half the sources in the sample. This variability cannot be explained by differences in observing and detector modes; in many cases the variability in the pattern is present while a source is observed at similar source flux and in the same detector mode. We searched for correlations with observed source flux and found none. More important here is the slope of the continuum well above the Fe K edge, because these photons are mostly responsible for Si K shell ionization. However, we do not have statistical significance in the HETG data in this specific bandpass. Unfortunately, we also cannot use the 0th order spectrum because it is so heavily piled up, and therefore we cannot investigate this issue further with our available data. In the following we focus on some prominent examples.
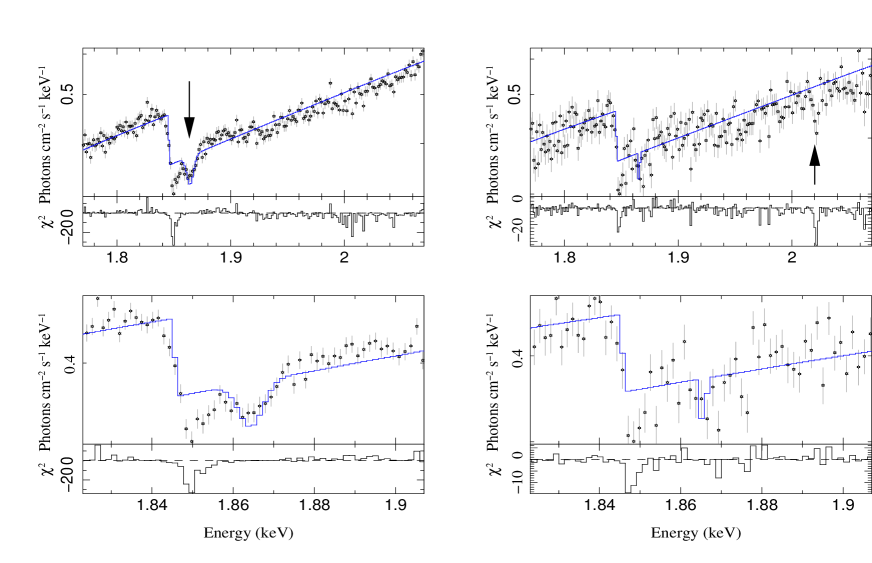
GX 5-1 is the brightest source in the sample with flux values exceeding 1 Crab. There are 6 observations in the Chandra archive. The first observation (Obsid 715) appears to fit quite well to the established silicate dust models as was shown by Ueda et al. (2005). Other observations of this source are different, though. The panels on the left in Figure 4 show probably the best example of a multi-peaked K edge structure as observed in Obsid 5888. The fit shows the edge and the far edge absorption feature leaving the near edge absorption feature as a residual. The right panel shows a sum of observations a few years later, i.e. Obsids 10691-4. While the former features a strong far edge absorption feature, the latter in contrast show very weak far edge absorption. Interestingly here we see significant Si xiv absorption. This indicates a shift in ionization parameter of atomic Si. In Obsid 5888 we measure an equivalent width of 5.6 mÅ for the Si xiii resonance line, while in Obsids 10691-4 the average equivalent width is very close to the detection limit of 0.6 mÅ. The near edge absorption, on the other hand is significant in all observations, but the equivalent widths vary from 3.8 to 7.6 mÅ with a 90 uncertainty of about 0.5 mÅ.
Perhaps the most intriguing source is GX 13+1 where we have six very similar observation segments distributed over weeks and years. Figure 4.5 shows these observations in sequence. Obsid 2708 was the one used by Ueda et al. (2005) in their Si K edge analysis. Readily detected is strong H-like Si xiv absorption stemming from an accretion disk wind reported by Ueda et al. (2004) also using Obsid 2708. However, we find that the Si K edge structure is highly variable in the observations of GX 13+1 and while we can apply the dust model from Ueda et al. (2005) in Obsid 2708 with some minor residuals, we cannot reproduce such a fit in the other observations. We now identify the far edge absorption feature with He-like Si xiii resonance absorption and observe variations in equivalent widths from m Å to about 4 mÅ. The 90 uncertainties are of the order of 0.7 mÅ. Near edge absorption is present in all observations, however again with significant variations in equivalent widths. Equivalent widths vary from 1.4 mÅ to 7.4 mÅ.
For the two sources, GX 5-1 and GX 13+1, we also fitted a warm absorber model to the Si K edge data where we fixed the TBnew(1).nh parameter to the values in Tab. 1 . For the warm absorber model we use the XSTAR function warmabs in XSPEC. The parameters of the near edge absorption function we fixed to the near edge locations and to the observed case B optical depths with a width equivalent to the HEG resolution. Such a function mimics the a basic Si K edge structure. The ionization parameter was constrained to values between 1.6 and 2.0, here the Si xiii line absorption is strong and Si xiv is still weak. In GX 13+1 we added a warm absorber with in order to account for the apparent Si xiv absorption feature from a known disk wind Ueda et al. (2004). We tested the warm absorber model for three specific cases, GX 5-1 (Obsid 5888), GX 13+1 (Obsids 2708, 11814), GX 13+1 (Obsids 11815, 11816). In the last, Si xiii is hardly detected and here we see the least ionized case and a more accurate silicate edge structure. The warm absorber needs high turbulent velocities ( 700 km s-1) in order to fit the full Si xiii feature width but also to smooth out small absorption features which are nested in the continuum noise. This fact makes the fit very difficult because this creates many shallow minima in the fit parameter space and allows for multiple solutions. In that respect such a simple warmabs fit is not unique. This effect was minimized by constraining the ionization parameter (log ) to 1.6 on the low, and 2.0 to the high side for finding the best fit. To compute 90 confidence limits, we then released the constraint at got values for GX 5-1 of 1.80.3 and for GX 13+1 of 1.90.3. If we would not constrain the fit first, lower values down to 1.1 were found as well. In general, these fits are able to provide for the major features and their variability near the Si K edge.
Variations of EW span similar ranges among different sources and observations. The source 4U 1624-49 is different in a sense that it is the only one where we do not observe significant near edge absorption, but high far edge absorption which stems from an identified warm absorber in the accretion disk (Xiang et al., 2009).
![[Uncaptioned image]](/html/1605.04837/assets/x8.png)
The Si K edge in GX 13+1. The panels show the six HETG observations to date. All observations, except OBSID 11818, were taken using the same timed event mode configuration. The fits here include all features described in Sect. 5 below. The plot demonstrates the variable appearance of the Si K edge specifically with respect to the line absorptions. The residuals at the edge locations in the TE mode data likely stem from the scattering contribution to the optical depths (see Fig. 2.2). OBSID 11818 is in CC-mode which also has lower spectral resolution and this feature is likely smeared.
Ser X-1 is the source with the lowest overall column ( cm-2). An early Chandra observation was pileup dominated and mostly useless (OBSID 700), but we carried out two observations in TE mode with a very narrow subarray (134 rows, OBSIDs 17485, 17600) reducing pileup to less than 3 at the Si K edge. Here we do not observe any edge structure in the MEG spectrum and only a very weak and unresolved near edge feature in the HEG.
5 High Definition HEG Modeling
There are a few observations in the sample that provide a specifically high brilliance view of the Si K edge region. MEG data do not provide enough resolution to see possible super-fine structure in the edge. In first order the HEG provides a spectral resolution of = 610 at the Si K edge, which might be enough to detect some of this substructure. GX 3+1 at a moderately high flux and column density was observed in configurations which kept pileup to less than 3 in TE mode. In addition to the fit model described in Sect. 2.2 we added some components local to the Si K edge necessary to remove fit residuals. One component is approximated by a broad Gaussion emission function to correct a slightly curved edge recovery centered at 1.88 keV (6.59 Å) (see Fig. 4.5) and which does not appear obvious in the extinction models in Fig. 2.2. Other components involve a narrow Gaussian peak on top of the edge, as well as a second standard edge function at slightly lower energies.
Figure 6 shows the Si K edge in the HEG summed first orders in the observations of GX 3+1. Several elements are identified: a peak on top of the edge stemming from X-ray scattering (see Fig. 2.2), a possible edge at 1.840 keV, the main edge at 1.845 keV, and a weak Si xiii absorption line. The scattering peak is seen in most of the edges, the possibility of more than one edge is also hinted in some of the GX 13+1 edges (see Fig. 4.5). The edge in GX 3+1 shows a two edge structure, with an optical depth ratio below 0.1, an about 10 contribution to the measured optical depths above. The effect is currently barely at the 3 level, but it demonstrates that these edges have substantial complexity.
6 Silicate Extinction Modeling
The previous sections have shown that the Si K edge in high resolution spectra is not only very complex, i.e. they show various structures due to silicate properties, as well as neutral and ionized atomic contributions, but there is scatter due to systematic uncertainties. This makes detailed data modeling extremely difficult. However there are some signatures and trends in our measurements which allow us to do some global model comparisons. In this section we attempt to characterize the observed silicate dust properties in the context of the models shown in Fig. 2.2. The most common signatures in all the data stemming from silicate properties, besides the edge location, are the case A and B optical depths. Their values as well as their ratio carry significant information about dust properties. The models shown in Fig. 2.2 show that scattering is an important contributor to the final optical depths oberved in the edges. Scattering specifically becomes a dominant factor when we focus on the underlying grain size distributions. In terms of scattering, small grain sizes produce less, and large grain sizes produce a greater contribution to the extinction optical depths. Figure 2.2 (bottom) shows how large grain sizes modify the edge function to a much larger extent than the small grains, which produce an edge shape that is similar to the MRN distribution.
![[Uncaptioned image]](/html/1605.04837/assets/x9.png)
The observed Si K edge in GX 3+1 summing up the HEG 1st orders of Obsids 2745, 16307, 16492 with a total exposure of about 120 ks. Marked are the contributions from scattering (see Fig. 2.2), a possible atomic Si K edge at 1.840 keV, a silicate edge at 1.845 keV, and a weak absorption line from ionized Si xiii.
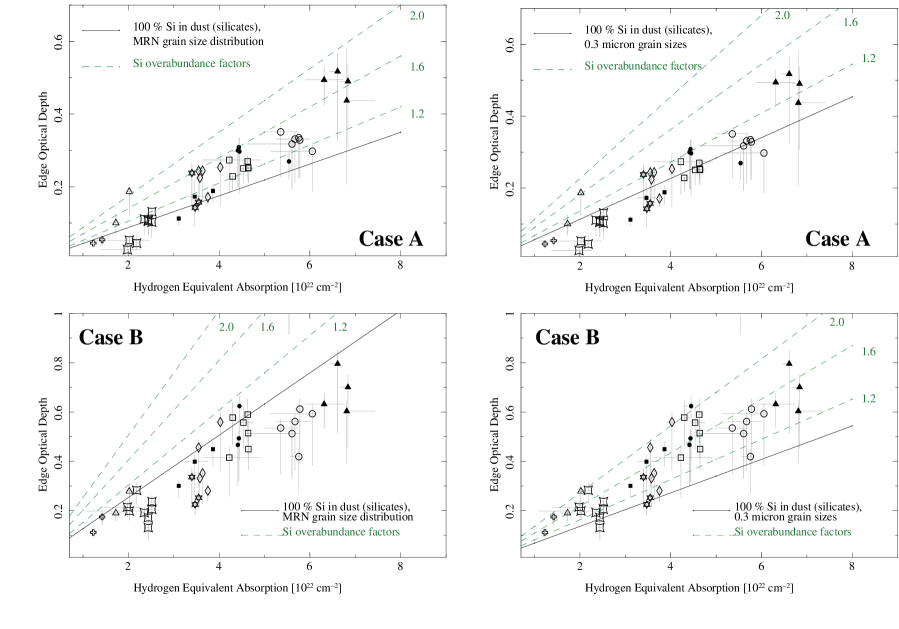
We created model grids for the two model examples described above, one for the MRN grain size distribution which features predominantely small (m) grain sizes (see Fig. 5, left diagrams) and for large grain sizes of m (see Fig. 5, right diagrams) of Si dust. The black solid line refers to the model with the silicon abundance of Wilms, Allen & McCray (2000) with all the Si in dust (i.e. a depletion factor of 1). The green hatched lines represent the same as the black lines but with different relative overabundance factors. Note that the model calculations include effects of self-shielding, which reduces the edge optical depth for large grains.
When we compare the data to the model we see that in all cases the measured optical depths generally follow the slope of the model tracks, which for case A optical depths is expected, however for case B optical depths it might not necessarily. It generally means that all lines of sight have fairly common dust properties notwithstanding the data scatter. More importantly, however, as can be seen for the MRN distribution model, the case A to case B optical depths do not follow the same model tracks indicating that the observed ratio of the two depths is not consistent with an MRN distribution of dust or we do not have the correct model. The m grain size model provides smaller case B optical depths which is what we observe. Even though the case A to case B optical depths do not follow common model tracks in both shown cases, the two cases appear much more consistent when larger grain sizes are considered. A case for this can be made when we plot grain size effects into the right panel of Fig. 2. Here the observed case B optical depths appear in between the expectation from the MRN distribution and the m case. We likely observe significant contributions from scattering of large grain sizes and that future dust models have to consider that.
7 Discussion
The Si K edge in high resolution X-ray spectra observed with Chandra shows very distinct structures. Next to the edge itself we observe broad near edge absorption as well as broad far edge absorption. Both absorption features can be fit with Gaussian line absorption. Due to the fact that there is so much additional sub-structure, the placement of the edge location is difficult. This has to do with the interpretation of the nature of the near absorption edge structure. In dust absorption models and laboratory data of silicates such as presented in Li et al. (1995) and Costantini, de Vries & Zeegers (2014), the near edge drop in flux is very steep and we would place the onset of the edge itself right where it is observed. This value is shown in Figure 3.2 at 1.844 keV. In most observed edges, however, there is a near edge absorption feature which is consistent with a Gaussian shape and cuts into the actual edge making it appear slightly redshifted. Correcting for this effect would place the edge slightly higher near 1.845 keV.
Whether this edge location is truly a signature of silicates or is still consistent with atomic silicon is a matter of debate. Literature values for atomic Si are some times significantly lower, Bearden & Burr (1967), for example, has 1.838.90.4 keV, a value still commonly used to calibrate laboratory data (see Drake et al. 2006). In fact our measured values are lower but very close to the value of 1.8466 keV from Verner & Yakovlev (1995) and 1.8486 from Hartree-Fock calculations (Huang et al., 1976; Gould & Jung, 1991) for atomic silicates. The former value has been adopted in the XSPEC absorption functions such as tbabs and TBnew, while the more commonly used wabs and phabs still have the lower value implemented for atomic Si. However, we caution the use of calculations for absolute wavelength determinations. In our previous studies we always had to apply significant wavelength shifts to match calculations and Chandra measurements using benchmarked lines (Juett, Schulz & Chakrabarty, 2004; Juett et al., 2006). During the ACIS instrument development phase in the mid-1990s, measurements of atomic Si in poly-silicon films based on synchrotron measurements of the Chandra CCD gate structures (Prigozhin et al., 1998) were performed to characterize the instrument contribution of Si K absorption and here also the above value of 1.839 keV was determined. This also marks the location of the instrumental Si edge in the uncorrected Chandra data. The studies by Ueda et al. (2005) and Draine (2003) rely on laboratory data from Li et al. (1995). More recently newer laboratory X-ray studies of silicates basically confirm the expectation of the Si K edge from silicates at the observed location of 1.844 keV by Chandra (Costantini, de Vries & Zeegers, 2014). If we adopt the hypothesis that the lower value is atomic and the higher value is from silicates, then we believe that we see some atomic Si at the lower edge location and the bulk of Si K absorption at the higher edge location from silicates.
The question still remains as to what exactly causes most of the edge to emerge blue-shifted by about 5 - 6 eV with respect to the expectation from atomic Si. The consensus to date is that most observed Si is bound in silicates. Consequently the X-ray study by Ueda et al. (2005) also has concluded that most of the edges origins has to be silicates. However, our study shows that even though the edge location is consistent with silicates, its observed structure appears more complex, and the models used by Draine (2003) and Ueda et al. (2005) do not provide a common fit to all the data.
One of the first complications is that we observe variablity with respect to the far edge feature which we identify as Si xiii absorption local to the X-ray emitting binaries. Absorption in the Ueda et al. (2005) study was modeled as a very shallow almost flat absorption trough as it would appear in some silicate XANES. In that study this was a consequence of limited and selective data choices aided by the fact that this absorption appeared rather weak in these data sets. The examples provided here by many more data sets from GX 13+1 and GX 5-1 show that this part is actually highly variable and more consistent with ionized silicon. The basic shape of the silicate edge has the near absorption feature superimposed on a standard edge step shape, which is illustrated in the sequence shown in Fig. 4.5. Here the edge in OBSID 11815 appears to have minimal structure which could allow to set limits on the non-variable structure of neutral silicates. All other structure features appear variable on relatively short time scales and likely have their origins in ionization effects.
In this respect the edge shape suggested in Fig. 2.2 appears reasonable, but needs some modification and context. The optical depths in both cases in Fig 2 appear systematically above the expectation from Wilms, Allen & McCray (2000). The mere fact that we observe more optical depth does not easily translate into a simple Si overabundance but depends on various factors as how much Si is actually bound in dust, how much Si exists in atomic and ionized form as well as details about dust properties such as the choice of a dust size distribution. This fact has been recently emphasized by Hoffman & Draine (2015) and Corrales et al. (2016) by pointing out the importance of scattering with respect to the Si extinction optical depth in the X-ray band. Our preliminary attempt to compare our data with silicate models and various dust distributions showed that we likely will not find a unique solution in the X-ray band. Fig. 5 shows that even though larger grain sizes may be indicated, there are additional unknowns such as the amount of Si in dust, the amount of atomic Si, a possible overabundance with respect to ISM abundances. It is interesting to note, that even if we assume that all the excess of Si in the case A optical depths is due to an overabundance, the amount is still slightly less that what we would expect from solar abundances (Asplund et al., 2009) for some of the data.
Our first attempt to observe more fine structure in the Si K edge has also revealed that we observe another edge at 1.840 keV, which is very close to the value expected for atomic silicon. The effect is small, likely contributing less than 10 to the overall optical depth. This is the first time we have observed both, neutral atomic silicon with the bulk of absorption from silicates. The fact that there is atomic silicon in the line of sight is also evident from the presence of ionized atomic silicon. However the measured properties of the ionized absorption suggests that it is of circum-binary nature. The identified Si xiii resonance absorption shows velocities in excess of 700 km s-1, which cannot be part of the generic interstellar medium in the line of sight because here we would expect velocities of much less than 100 km s-1. Interestingly, we do not observe resonance absorption from other elements such as Mg xi or S xv, which might point to a specific overabunance of Si even with respect to these other elements. When we model this component with a warm absorber model we determine moderate ionization parameters again indicating a circum-binary origin. We can estimate the ionized column from the linear part of the curve of growth which relates the equivalent width to the column density as
| (3) |
where is the column of the ion species , the oscillator strength, and the equivalent width of the absorption line (see Schulz & Brandt (2002) for details). For an oscillator strength of 0.747 (Kramida et al., 2014) for the Si xiii resonance line the observed equivalent widths ranging from 0.6 mA to 5.8 mA then correspond to silicon columns ranging from to . In terms of hydrogen equivalent columns using abundances from Wilms, Allen & McCray (2000), these range from to and are a very small fraction with respect to the overall column density consistent with a local origin for these columns. However, when we combine these columns with the result for GX 3+1 for the fraction of the atomic Si column, which in that case would be around , then we find an ionized fraction of about 7, which is similar to ionization fractions observed for lower ionizations of O and Ne in the warm ISM Juett, Schulz & Chakrabarty (2004); Juett et al. (2006).
Even though the two component structure of the K edge consisting of a cold and an ionized component has been found for lower Z edges, i.e. oxygen K and neon K (Juett, Schulz & Chakrabarty, 2004; Juett et al., 2006; Gatuzz et al., 2014), the case for Si K is different. In the low Z case we observe mostly cold edge signatures from atomic oxygen and neon as well as ionization signatures from a wide range of ionization stages. The features did not appear variable and rather consistent with contributions from the warm and hot phases of the interstellar medium. In these cases there is also hardly any measurable dust component involved, even though Pinto et al. (2013) estimates the presence of about 10 as forms of dust. The Fe L edge is different again as here the entire edge is likely various forms of dust Juett et al. (2006); Lee et al. (2009). The Si K edge structure appears different again, as here the main cold component is dust in form of silicates, while the ionized component is circum-binary material. The hot phase of the interstellar medium is not hot enough to produce collisional ionized Si and the observed velocities are too high.
There are yet not many sources available that allow us to compare hydrogen equivalent columns from silicate optical depths with observations in other wavelengths. However, two sources in our sample are also present in the low Z survey by Juett et al. (2006), which include Ne K and Fe L edges. Ser X-1 and GX 349+2 have low enough columns to also exhibit Ne K and Fe L edges in the X-ray spectrum. Here we find that the columns from our Si K edges are very consistent with the ones found at Ne K, but Fe L columns appear about 30 lower. However, when we compare the Fe L column found in GX 9+9 from that study with the ones found in the recent study by Corrales et al. (2016) which uses the dust model used in our study, then there is a similar discrepancy. More studies are necessary to confirm these findings, however these few cases already demonstrate the necessity of proper modeling of scattering from dust in the ISM.
One of the more interesting tasks is to compare the measured Si optical depths with results from other wavebands. Predehl & Schmitt (1995), for example, established a relationship of optical extinction AV with X-ray column density based on measurements of the scattering halos observed with ROSAT . Our sample compares fairly well with theirs with a somewhat larger scatter around that relationship that they observe.
The Si K (Case A) optical depths also do not indicate significant Si overabundances and, as shown in previous paragraphs, the columns are consistent with other elements in the X-ray band. However, we also know from the ionization signatures in our spectra that there are source intrinsic contributions. We then compared our Si K Case A columns to recent H I surveys as the Leiden/Argentine/Bonn Survey of Galactic H I by Kalberla et al. (2005) and more recently the Parks Galactic All-Sky Survey (GASS) III by Kalberla & Haud (2015). The column densities from the GASS survey are expected to be much lower than what we expect from the Si K values because only a fraction of all the hydrogen is expected to be in H I form. Surveys such as the WHAM survey of ionized hydrogen (Haffner et al., 2003) as well as molecular surveys (Dame, Hartmann & Thaddeus, 2001) show significant contributions of both, H II and H2, in the direction of the Galactic Bulge (see also Gordon & Burton 1976). Here we find that the Si K optical depths follow the column densities from the GASS survey quite well with the H I values systematically lower by about a factor 3, which is not unreasonable. We also expect some line of sight variations due to ionized and molecular hydrogen. However, what this comparison shows is that the silicate columns we observe trace well with columns from H I surveys and that the intrinsic source contributions of less than 10 we observe are reasonable. In order to make more quantitative comparisons, the availability of more comprehensive surveys specifically for molecular hydrogen is clearly needed.
7.1 Conclusions
-
•
The Si K edge as measured with Chandra has significant substructure and consists of an edge at 1.8440.001 keV, additional near edge absorption at 1.8500.002 keV, and far edge absorption at 1.8650.001 keV.
-
•
The Si K edge structure cannot be fit by a common silicon dust model as was done in a more limited previous study by Ueda et al. (2005).
-
•
The Si K edge structure in X-ray binaries appears highly variable in time scales of days to weeks and should be explained by local ionization effects.
-
•
The far edge absorption feature is identified as Si xiii resonance absorption in the close vicinity of the X-ray binaries’ accretion disk.
-
•
Variations in far edge absorption feature include the appearance of Si xivresonance absorption in same cases and are an expression of changing ionization parameters in circum-binary material.
-
•
The bulk of the Si K edge systematically appears at a value where silicate absorption is expected, however the associated near edge absorption also appears variable possibly indicating local ionization effects in silicon compounds.
-
•
Comparisons with extinction models show that the Si K edge optical depth is determined by contributions from absorption and significant amounts of scattering.
-
•
A preliminary comparison of Si K edge optical depths with models using differenct grain sizes suggest that larger grain sizes are favored.
-
•
Data from highly resolved edges with good statistics indicate the presence of an additional edge at 1.840 keV with about 10 of the optical depth likely coming from atomic silicon.
-
•
The Si K edge in X-rays then has several contributions to consider: absorption from atomic silicon and from silicates attenuated by considerable contributions of scattering optical depths and variable ionized absorption featues.
Future studies should focus on the variability and multiplicity aspect of the Si K edge structure and sub-structure as well as scattering optical depths. We are in the process of gathering more data less affected by instrumental effects in order to further study the possibility of multiple edge components. At the end future observations with the upcoming X-ray spectroscopy mission Astro-H will become instrumental and most fruitful for these studies.
References
- Asplund et al. (2009) Asplund, M., Grevesse, N., Sauval, A. J., & Scott, P., 2009, ARA&A, 47, 481
- Bearden & Burr (1967) Bearden, J. A., & Burr, A. F., 1967, Reviews of Modern Physics, 39, 125
- Canizares et al. (2005) Canizares, C. R., et al., 2005, PASP, 117, 1144
- Corrales et al. (2016) Corrales, L. R., García, J., Wilms, J., & Baganoff, F., 2016, MNRAS
- Corrales & Paerels (2015) Corrales, L. R., & Paerels, F., 2015, MNRAS, 453, 1121
- Costantini, de Vries & Zeegers (2014) Costantini, E., de Vries, C., & Zeegers, S., 2014, in The X-ray Universe 2014, 54
- Dame, Hartmann & Thaddeus (2001) Dame, T. M., Hartmann, D., & Thaddeus, P., 2001, ApJ, 547, 792
- de Vries et al. (2003) de Vries, C. P., den Herder, J. W., Kaastra, J. S., Paerels, F. B., den Boggende, A. J., & Rasmussen, A. P., 2003, A&A, 404, 959
- Draine (2003) Draine, B. T., 2003, ApJ, 598, 1026
- Draine & Lee (1984) Draine, B. T., & Lee, H. M., 1984, ApJ, 285, 89
- Drake et al. (2006) Drake, I., Zhang, Y., Gilles, M. K., Teris Liu, C. N., Nachimuthu, P., Perera, R., Wakita, H., & Bell, A., 2006, Journal of Physical Chemistry B, 110, 11665
- Gatuzz et al. (2014) Gatuzz, E., García, J., Mendoza, C., Kallman, T. R., Bautista, M. A., & Gorczyca, T. W., 2014, ApJ, 790, 131
- Gordon & Burton (1976) Gordon, M. A., & Burton, W. B., 1976, ApJ, 208, 346
- Gould & Jung (1991) Gould, R. J., & Jung, Y.-D., 1991, ApJ, 373, 271
- Haffner et al. (2003) Haffner, L. M., Reynolds, R. J., Tufte, S. L., Madsen, G. J., Jaehnig, K. P., & Percival, J. W., 2003, ApJS, 149, 405
- Hoffman & Draine (2015) Hoffman, J. A., & Draine, B. T., 2015, ArXiv e-prints
- Houck & Denicola (2000) Houck, J. C., & Denicola, L. A., 2000, in Astronomical Data Analysis Software and Systems IX, ed. N. Manset, C. Veillet, D. Crabtree, Vol. 216, 591
- Huang et al. (1976) Huang, K.-N., Aoyagi, M., Chen, M. H., Crasemann, B., & Mark, H., 1976, Atomic Data and Nuclear Data Tables, 18, 243
- Huenemoerder et al. (2011) Huenemoerder, D. P., et al., 2011, AJ, 141, 129
- Juett, Schulz & Chakrabarty (2004) Juett, A. M., Schulz, N. S., & Chakrabarty, D., 2004, ApJ, 612, 308
- Juett et al. (2006) Juett, A. M., Schulz, N. S., Chakrabarty, D., & Gorczyca, T. W., 2006, ApJ, 648, 1066
- Kalberla et al. (2005) Kalberla, P. M. W., Burton, W. B., Hartmann, D., Arnal, E. M., Bajaja, E., Morras, R., & Pöppel, W. G. L., 2005, A&A, 440, 775
- Kalberla & Haud (2015) Kalberla, P. M. W., & Haud, U., 2015, A&A, 578, A78
- Kortright & Kim (2000) Kortright, J. B., & Kim, S.-K., 2000, Phys. Rev. B, 62, 12216
- Kramida et al. (2014) Kramida, A., Yu. RalchenkoReader, J., & and NIST ASD Team 2014, NIST Atomic Spectra Database (ver. 5.2), [Online]. Available: http://physics.nist.gov/asd [2015, September 24]. National Institute of Standards and Technology, Gaithersburg, MD.
- Lee et al. (2002) Lee, J. C., Reynolds, C. S., Remillard, R., Schulz, N. S., Blackman, E. G., & Fabian, A. C., 2002, ApJ, 567, 1102
- Lee et al. (2009) Lee, J. C., Xiang, J., Ravel, B., Kortright, J., & Flanagan, K., 2009, ApJ, 702, 970
- Li et al. (1995) Li, D., Bancroft, G. M., Fleet, M. E., & Feng, X. H., 1995, Physics and Chemistry of Minerals, 22, 115
- Mathis (1998) Mathis, J. S., 1998, ApJ, 497, 824
- Paerels et al. (2001) Paerels, F., et al., 2001, ApJ, 546, 338
- Pinto et al. (2013) Pinto, C., Kaastra, J. S., Costantini, E., & de Vries, C., 2013, A&A, 551, A25
- Predehl & Schmitt (1995) Predehl, P., & Schmitt, J. H. M. M., 1995, A&A, 293
- Prigozhin et al. (1998) Prigozhin, G. Y., Woo, J. W., Gregory, J. A., Loomis, A. H., Bautz, M. W., Ricker, G. R., & Kraft, S., 1998, Optical Engineering, 37, 2848
- Savage & Sembach (1996) Savage, B. D., & Sembach, K. R., 1996, ARA&A, 34, 279
- Schulz & Brandt (2002) Schulz, N. S., & Brandt, W. N., 2002, ApJ, 572, 971
- Schulz et al. (2002) Schulz, N. S., Cui, W., Canizares, C. R., Marshall, H. L., Lee, J. C., Miller, J. M., & Lewin, W. H. G., 2002, ApJ, 565, 1141
- Seward & Smith (2013) Seward, F. D., & Smith, R. K., 2013, ApJ, 769, 17
- Smith (2008) Smith, R. K., 2008, ApJ, 681, 343
- Takei et al. (2002) Takei, Y., Fujimoto, R., Mitsuda, K., & Onaka, T., 2002, ApJ, 581, 307
- Ueda et al. (2005) Ueda, Y., Mitsuda, K., Murakami, H., & Matsushita, K., 2005, ApJ, 620, 274
- Ueda et al. (2004) Ueda, Y., Murakami, H., Yamaoka, K., Dotani, T., & Ebisawa, K., 2004, ApJ, 609, 325
- Verner & Yakovlev (1995) Verner, D. A., & Yakovlev, D. G., 1995, A&AS, 109, 125
- Weingartner & Draine (2001) Weingartner, J. C., & Draine, B. T., 2001, ApJ, 548, 296
- Wilms, Allen & McCray (2000) Wilms, J., Allen, A., & McCray, R., 2000, ApJ, 542, 914
- Xiang et al. (2011) Xiang, J., Lee, J. C., Nowak, M. A., & Wilms, J., 2011, ApJ, 738, 78
- Xiang et al. (2009) Xiang, J., Lee, J. C., Nowak, M. A., Wilms, J., & Schulz, N. S., 2009, ApJ, 701, 984