Also at ]Center for Astrophysics and Space Sciences, University of California, San Diego, La Jolla, CA 92093-0424
Galactic Energetic Particles and Their Radiative Yields in Clusters
Abstract
As energetic particles diffuse out of radio and star-forming galaxies (SFGs), their intracluster density builds up to a level that could account for a substantial part or all the emission from a radio halo. We calculate the particle time-dependent, spectro-spatial distributions from a solution of a diffusion equation with radio galaxies as sources of electrons, and SFGs as sources of both electrons and protons. Whereas strong radio galaxies are typically found in the cluster (e.g., Coma) core, the fraction of SFGs increases with distance from the cluster center. Scaling particle escape rates from their sources to the reasonably well determined Galactic rates, and for realistic gas density and magnetic field spatial profiles, we find that predicted spectra and spatial profiles of radio emission from primary and secondary electrons are roughly consistent with those deduced from current measurements of the Coma halo (after subtraction of emission from the relic Coma A). Nonthermal X-ray emission is predicted to be mostly by Compton scattering of electrons from radio galaxies off the CMB, whereas -ray emission is primarily from the decay of neutral pions produced in interactions of protons from SFGs with protons in intracluster gas.
pacs:
98.54, 98.65.Cw, 98.70.SaI Introduction
A quantitative study of energetic particles (‘cosmic rays’) and magnetic fields in galaxy clusters is motivated by the need for a more complete physical description of these systems, and for improved knowledge of the origin of non-thermal (NT) quantities in extragalactic environments. Current and future measurement capabilities necessitate fairly detailed modeling of energetic particles, their origin and impact on the properties of intracluster (IC) gas.
Direct evidence for the presence of relativistic electrons in IC space is presently limited to measurements of extended regions of radio emission, ‘halos’ and relics, which have already been observed in many clusters [Ferrari et al., 2008]. Mapping these extended low brightness regions is quite challenging due to the inherently imprecise process of subtracting out the emission from many galactic radio sources. Searches for NT X-ray emission have not yet yielded conclusive results (e.g., [Rephaeli, 2008]). Analysis of superposed Fermi/LAT measurements of 50 clusters yielded an upper limit on the mean emission above MeV [Ackermann et al., 2014]. Radio measurements provide direct evidence for acceleration of electrons in SN shocks, whereas recent Fermi/LAT measurements [Ackermann et al., 2013] reveal the signature of acceleration also of protons, whose interactions with ambient protons produce neutral pions () which decay into two ( MeV) photons, giving rise to the ‘pion bump’ in the measured spectra. Since energetic electrons and protons do not lose all their energy while diffusing out of their galactic sources, star-forming galaxies (SFGs) are likely to contribute appreciably to their respective extragalactic energy densities. While the sources of the radio emitting electrons have not yet been fully identified these clearly include also radio galaxies.
It has been suggested long ago that the (typically) transonic motion of galaxies through IC plasma excites turbulence that may re-accelerate particles, maintaining electron populations that could explain the observed radio halos [Jaffe, 1980]. The main focus has been in merger and accretion shocks as particle acceleration sites (e.g., [Fujita, Takizawa, Sarazin, 2003], [Brunetti & Jones, 2014]). Particle acceleration by mildly supersonic shocks in the dilute IC gas is not fully understood, and the efficiency of conversion of kinetic to particle energy is substantially uncertain.
There is considerable motivation to model NT phenomena under typical conditions in most clusters. Realistic estimates of the emission from particles originating in SFGs yield lower limits on IC emission. Together with direct emission from the galaxies, a minimal level of the cluster total emission is obtained. Adding the emission from SFGs to the similarly deduced emission of strong radio galaxies yields the total galactic and IC emission. A basic issue is whether the combined emission from all galactic sources can fully account for emission from a cluster radio halo. This important consideration has obvious implications for the need to assume efficient particle re-acceleration in IC space.
The above considerations warrant a detailed assessment of galactic origin for energetic particles in clusters, our main objective here. In Section 2 we calculate particle spectra from SF and central radio galaxies, and present results of the calculations for the particle radiative spectra in Section 3. A brief discussion follows in Section 4.
II Particle Distributions
Particles random-walk through the magnetized IC gas with their propagation likely controlled by magnetic field inhomogeneities, quantified by the field coherence scale denoted by , and an implied diffusion coefficient . The particle time-dependent, spectro-spatial distribution is governed by the spherical diffusion equation [Atoyan, Aharonian, Völk, 1995]
| (1) |
where denotes the spectral particle density at time , is the particle Lorentz factor, is the energy loss rate, and is a source term for initial injection of monoenergetic particles at , expressed as the product of Dirac delta functions in , , and . For a (functionally) separable spectral dependence of the source term, , the solution can be obtained from the Green function in and [Atoyan, Aharonian, Völk, 1995]
| (2) |
where is the initial value of the Lorentz factor that reduces to after a time , during which the particle diffuses a distance .
The superposed contributions of sources at positions to the particle distribution function at time and observation point is
| (3) |
where is the source density 111Cluster galaxies (excluding a galaxy at the dynamical center) move substantial distances during characteristic times they are active sources of energetic particles; thus, their density can be approximated by a continuous function at radial position , and is the lowest injection time over which a particle initial energy is reduced to . In spherical coordinates,
| (4) |
Assuming a spherically symmetric source distribution, the spectral density at is independent of the angular variables; by setting and integrating over and we obtain
| (5) |
Substituting the particle escape and energy loss rates (specified below) in the above equation fully determines the time-dependent, spectro-spatial distribution. We treat separately the evolution of electrons and protons from the very extended distribution of SFGs and that of electrons from strong radio sources in the cluster core.
II.1 Electrons from Central Radio Galaxies
In many radio halo clusters there are dominant radio galaxies within the core region, and a population of elliptical radio galaxies whose distribution is centrally peaked. For modeling simplicity, we consider the case when there are no strong radio sources outside the core and the total contribution of radio galaxies outside this region can be ignored. Due to the special location of the central (AGN-powered) radio galaxies the period of their activity (which is likely to be sustained by accretion and mergers), either continuously or intermittently, is longer than a typical lifetime of a radio galaxy. During this period radio sources that are not at the dynamical center move substantial distances across the cluster core. Therefore, we model these galaxies as a spatially uniform core component with a source term that is scaled to their total radio luminosity and the mean value of their magnetic field.
II.2 Electrons & Protons from Star-Forming Galaxies
The close link between high-mass stars and particle acceleration provides a basis for estimating the total number of Galaxy-equivalent SFGs, , from the ratio of the cluster blue luminosity to the blue luminosity of the Galaxy. In the Coma cluster this ratio is ; we scale to the lower value. Due to the considerable evidence for star formation in some S0 and elliptical galaxies (e.g., [Riguccini et al., 2015]), is not simply the number of spiral galaxies.
The radial distribution of the fractional number of SFGs can be derived from their measured fraction in a compilation of 55 clusters [Whitmore, Gilmore, Jones, 1993]. Up to a projected distance Mpc the measured fraction is well fit by , where , and is the projected distance. Assuming cylindrical symmetry about the los through the cluster center, the continuum limit of the SFG density, , can be calculated from an inverse Abel transform,
| (6) |
with .
Energetic protons interacting with ambient IC nuclei produce both charged and neutral pions; the former produce secondary electrons and positrons whose spectral density can be derived from the spectral density of energetic protons using [Dermer, 1986].
| (7) |
where Ep is the (total) proton energy in GeV, Eth=1.22 GeV is the threshold for pion creation, is the proton distribution, and is the pion distribution. Here, is the target nucleon density, is the hadronic reaction multiplicity, and is the cross section for pion production, calculated using an analytical fit [Kelner, Aharonian, & Bugayov, 2006]. Substituting in Eq. (7), then yields . For a proton escape rate , with spectral index , the pion distribution expressed in terms of the pion Lorentz factor becomes . Note that the accuracy of the above treatment can be improved by using the more detailed calculations of pion yields in p-p interactions in Ref. [Kachelriess, Moskalenko, & Ostapchenko, 2014]; given the considerable uncertainties basic parameter values in our generic model, use of the approximate relations in Ref. [Dermer, 1986] is adequate for our purposes here.
The distribution function of electrons produced by charged pion decay can be approximated [Ramaty & Lingenfelter, 1966] as , where . Calculation of the secondary electron distribution is carried out by tracking the protons diffusing out from their sources to the point of electron creation, yielding proton distributions analogous to Eq. (5), and consequent diffusion of secondary electrons to the observation point. Using the expression for to transform the distribution of the pions into that of pre-diffusion electrons as , and substituting the electron escape rate in Eq. (5), then yields the distribution of secondary electrons.
II.3 Energy Loss Rates & Magnetic Field Profile
Energy loss processes for IC energetic electrons are electronic (Coulomb) excitations, bremsstrahlung, and Compton-synchrotron, with the total energy loss rate given by
| (8) |
where is the loss rate by electronic excitations in ionized gas [Gould, 1972]; is the IC electron density. The coefficients of the bremsstrahlung and Compton-synchrotron rates are [Blumenthal & Gould, 1970] , and , respectively. Compton scattering of the electrons is by the CMB, whose energy density increases with redshift, . The main energy loss of energetic protons is by p-p interactions at a rate , where and are the mean inelasticity and cross section in inelastic p-p interactions, respectively. (Note that the above expressions are valid for ; the correct expressions at the trans-relativistic regime can be found in [Rephaeli & Persic, 2015].)
A realistic profile of the mean IC magnetic field is of central importance for reliable calculations of the level and spatial distribution of the halo emission. In the hot, fully-ionized, highly electrically conductive IC gas, magnetic fields are likely frozen into the plasma; if so, the field spatial dependence is expected to scale as [Rephaeli, 1988]. The index in this scaling is somewhat lower, , if magnetic energy density is in equipartition with the gas energy density.
III Results
Electron and proton escape rates from the Galaxy were deduced based on results obtained by Strong et al. (2010; Ref. [Strong et al., 2010] ) from a set of diffusion and diffusive re-acceleration models with different Galactic halo sizes. From the range of values for their different models we determine average rates, , that are s-1, for electrons, and s-1 and for protons. As noted, we take the number of Galaxy-equivalent SFGs to be .
In a 1.4 GHz survey of Coma [Miller et al., 2009], 19 elliptical radio galaxies were identified as definite cluster members, including the very strong NGC4869 & NGC4874 in the cluster core. The emission of the other 17 elliptical radio is dominated by the NGC4839 and NGC4827, which are part of the infalling NGC4839 group in the SW region of the cluster, the radio relic Coma A. We confine our modeling to the nearly spherical radio halo, and since the extended emission of Coma A is outside the central Mpc radial region, we ignore the contribution of all the 17 galaxies to the electron density. Radio emission scales as , where is the total number of emitting electrons and is the radio power-law index, but since the estimated mean magnetic fields in the extended radio emitting regions of the two central radio galaxies ([Feretti & Giovannini, 1987], Feretti et al., 1990]) are about the same as the mean Galactic field (G), we scale the Galactic electron rate by the ratio of the combined radio luminosity of these galaxies to that of the Galaxy. Doing so yields a spectral escape rate of s-1, taking ; in our calculations we adopt a value that is lower by a factor of 2/3.
The distributions of electrons and protons escaping SFGs and their yields are evolved for Gyr (over which the electron distribution is essentially in its asymptotic steady-state), whereas for electrons from the central radio galaxies we show results for Gyr, a more typical time for their AGN-powered emission, either continuously or successively. This period of activity is reasonable given the long duration of mergers and strong tidal interactions, processes that enhance particle acceleration in galactic nuclei. Other key parameters in the calculation are the central value of the cluster magnetic field, G (somewhat lower than deduced from Faraday Rotation measurements [Feretti et al., 1995]).
A wide range of magnetic field coherence scales is expected, reflecting the varying properties of IC plasma, with values as low as a few tenths of a kpc to kpc. A fiducial value of kpc is adopted, for which cm2 s-1.
Having selected Coma () as our fiducial cluster, we adopt the (-like) gas density profile used in the analysis of Planck SZ measurements [Ade et al., 2013]
| (9) |
with cm-3, Mpc, Mpc, and .
We calculated the spectral radio synchrotron and Compton (in the Thomson limit) X-ray and -emissivities by relativistic electrons, traversing IC fields and scattering off the CMB, using the relevant expressions in Ref. [Blumenthal & Gould, 1970]. The spectral -ray emissivity from neutral pion decay was calculated using the expression in Ref. [Mannheim & Schlickeiser, 1994].
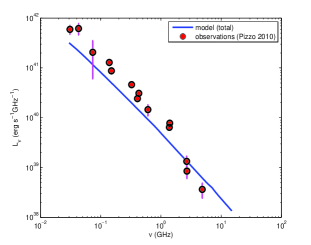
The spectral and spatial distributions of radio emission by primary and secondary electrons originating in SFGs, and the corresponding emission by primary electrons from central radio galaxies, are shown in Figure (1). Our fiducial spectral profile seems to be somewhat flatter than the trend seen in the data above GHz. In fact, a linear fit to current data yields a spectral index of (at 95% significance) that implies a somewhat steeper spectral profile of electrons emerging from radio and SFGs, i.e., , rather than the value of adopted in our generic model. Also shown are measurements of the Coma halo compiled in Ref. [Pizzo, 2010].
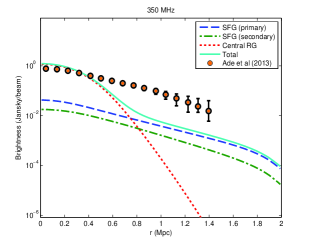
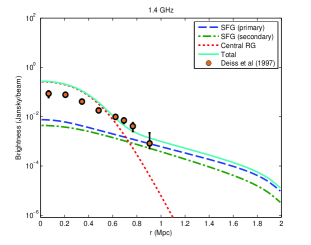
For a direct comparison with the profile deduced from the 350 MHz measurements reported in Ref. [Brown & Rudnick, 2011], and plotted in Figure 10 in Ref. [Ade et al., 2013], we convolved the (line of sight) integrated emissivities with a gaussian 10’ (FWHM) beam. We note that the plotted 350 MHz data were obtained by azimuthally averaging the substantially angle-dependent emission profile (shown in Ref. [Ade et al., 2013]). Above Mpc, the plotted profile includes emission from the relic Coma A, which is locally as much as a factor higher than the emission in the SE part of the cluster. Subtracting the flux of Coma A in the the SW 0.8-1.4 Mpc region would bring the data points appreciably closer to our profile. Indeed, the profile of the Coma halo was measured also at 1.4 GHz smoothed with 9.35’ beam) by Deiss et al. (1997, Ref. [Deiss, 1997]), whose data cover only the main halo region, Mpc. As is obvious from the right panel of Figure (1), our profile agrees well with this steeper profile that does not include substantial emission from Coma A. Comparison of the measured profiles demonstrates the increased significance of the relative contribution of emission by electrons from SFGs, clearly establishing the need for SFGs as electron sources.
The spatially integrated 350 MHz flux from Coma is somewhat lower than that deduced from the measured profile, a difference that is reflected in the respective spatial profiles in Figure (1), with the predicted emission more pronounced in the cluster core, but this emission falls steeply and cannot account for the measured emission beyond Mpc. We emphasize that our aim here is to present generic features of our approach, rather than best-fitting model parameters to the specific Coma spectral and spatial measurements. Therefore, the fact that the predicted emission does not exactly match the observations is actually not surprising given the appreciable range of parameter (, , ) values.
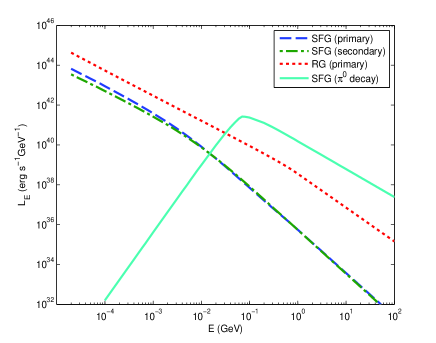
Spectral -ray luminosity by neutral pion decay is shown in Figure (2). The emission is spatially extended reflecting the large diffusion radii of the parent protons. Also shown in the figure are the spectral distributions of X-and--ray emission by Compton scattering of relativistic electrons off the CMB, whose combined power-law spectral luminosity has a mean index of . The emission is clearly more extended than in the radio (due to the CMB spatial uniformity). The integrated luminosity above 100 MeV, erg s-1, is mostly from decay.
IV Discussion
The approach adopted in our work is minimalistic as it rests on known properties of galactic energetic particles, quantitative description of their diffusion in IC space and consequent radiative yields, thereby establishing the level of radio emission beyond which turbulent (re)acceleration might be needed to fully account for halo emission, if electrons and protons from star-forming and other widely distributed galaxies cannot account for the relatively high 350 MHz emission measured in the outer region of the Coma cluster. A basic result of our work is that with either known or estimated values of these quantities, the predicted level of the radio luminosity can be comparable to the measured value. The significance of this result rests also on the fact that we have not included any additional sources of energetic particles, such as AGN or radio galaxies other than NGC 4869 & NGC 4874.
Of primary importance are the proton and electron escape fractions from a SFG, which are based on the detailed study in Ref. [Strong et al., 2010]. Whereas for protons this fraction is only a few percent, it is about half for electrons; if anything, the calorimetric fraction is expected to be lower due to reduced halo size of a SFG in the more tidally interactive cluster environment. 222Evidence for a relatively extended radio halo of SFGs has recently been obtained [Wiegert et al., 2015] from a stacking analysis of 1.5 GHz measurements of 30 nearby field galaxies. Nonetheless, the exact values of the electron escape rates from radio galaxies are uncertain; a lower escape rate than estimated here would reduce the level of radio emission in the core, weakening the discrepancy with the measured 1.4 GHz profile. The dependence of synchrotron emission on the magnetic field, ( for Coma) is sufficiently steep to make the feasibility of detection of a low brightness radio halo very sensitive to specific conditions in the cluster. Our fiducial central value, G, implies a volume-averaged value of only G across the cluster.
Extended radio emission is far less ubiquitous than X-ray emission from IC gas. A major issue then is what cluster evolutionary processes give rise to this emission; suggestions abound, ranging from strong radio galaxies and AGN as sources of energetic particles, and particle acceleration by turbulent shocks excited by galactic motions or by merger shocks (e.g., Ref. [Brunetti & Jones, 2014] ). Various scaling relations reflecting correlations between radio emission and cluster properties have been either deduced or invoked in support of specific models. However, such relations may not always be reliable due to inherent parameter degeneracies, reflecting the considerable coupling between respective cluster properties and evolutionary processes. An example for this inherent limitation in testing a specific model for the origin of extended radio emission is the commonly advocated view that energetic particles are accelerated by merger shocks. Indeed, during cluster hierarchical evolution, mergers of sub-clusters can create conditions under which shocks may have the properties required for efficient particle acceleration. But mergers enhance star formation in cluster galaxies, which also results in increased SN activity with the same end result of particle acceleration; thus, a basic evolutionary process can be generically the root cause of different models for the origin of enhanced particle acceleration.
The predicted level of -ray emission from energetic protons and electrons emanating from SFGs and radio galaxies in a Coma-like cluster is erg s-1. A recent search for -ray emission from the Coma region in the Fermi/LAT 6 yr database has not yielded a statistically significant detection [Ackermann et al., 2016] ; the implied upper limit on emission above MeV is about an order of magnitude higher than the level predicted here. Obviously, this is a bound on the total emission from the Coma region, including the intrinsic emission from all radio galaxies and SFGs. Multiplying our overall normalization factor () by the total -ray luminosity of the Galaxy [Strong et al., 2010] we obtain for the range of models considered in the latter paper.
Also of much interest is the predicted NT X-ray luminosity due to Compton scattering of relativistic electrons off the CMB. As shown in the right panel of Figure 2, most of the Compton emission is predicted to be by primary electrons originating in the central radio galaxies; the total (including contributions of electrons from SFGs) MeV luminosity is erg s-1. Dedicated searches for NT emission above 20 keV began long ago [Rephaeli, Gruber, & Rothschild, 1987] and continued with almost all successive X-ray satellites. Results of all these searches (e.g., Refs. [Rephaeli, 2008], [Wik et al., 2014]) yielded no unequivocal detections. For Coma, extensive RXTE measurements [Rephaeli & Gruber, 2002] yielded the upper limit erg s-1, much higher than the luminosity of IC electrons predicted here. However, our estimated level is clearly a lower limit on the total cluster emission since it does not include intrinsic emission from galactic sources.
Acknowledgements.
We are grateful to the referee for constructive evaluation of our work and for several useful suggestions that improved presentation, and to Dr. Larry Rudnick for a useful discussion. This work has been supported by a grant from the Israel Science Foundation.References
- Ferrari et al. (2008) Ferrari C., et al., 2008, Space Science Reviews, 134, 93
- Rephaeli (2008) Rephaeli Y., et al. 2008, Space Science Reviews, 134, 71
- Ackermann et al. (2014) Ackermann M., et al., 2014, ApJ, 787, 18
- Ackermann et al. (2013) Ackermann M., et al., 2013, Science, 339, 807
- Jaffe (1980) Jaffe W., 1980, ApJ, 241, 925
- Brunetti & Jones (2014) Brunetti G., Jones T., 2014, Intel. J. of Modern Phys D, 23, 1430007
- Fujita, Takizawa, Sarazin (2003) Fujita Y., Takizawa M., Sarazin C.L., 2003, ApJ, 584, 190
- Atoyan, Aharonian, Völk (1995) Atoyan A.M., Aharonian F.A., Völk H.J., 1995, PRD, 52, 3265
- Riguccini et al. (2015) Riguccini L., et al., 2015, ApJ, 810, 138
- Whitmore, Gilmore, Jones (1993) Whitmore B.C., Gilmore D.M., Jones, C., 1993, ApJ, 407, 489
- Dermer (1986) Dermer, C.D., 1986, A&A, 157, 223
- Kelner, Aharonian, & Bugayov (2006) Kelner, S.R., Aharonian, F.A., & Bugayov, V.V., 2006, PRD, 74, 034018
- Kachelriess, Moskalenko, & Ostapchenko (2014) Kachelriess, M., Moskalenko, I.V., & Ostapchenko, S.S., 2014, ApJ, 789, 136
- Ramaty & Lingenfelter (1966) Ramaty R., Lingenfelter R.E., 1966, JGR, 71, 3687
- Gould (1972) Gould R.J., 1972, Physica, 60, 145
- Blumenthal & Gould (1970) Blumenthal G.R., Gould R.J., 1970, Rev Mod Phys, 42, 237
- Rephaeli & Persic (2015) Rephaeli Y., Persic M., 2015, ApJ, 805, 111
- Rephaeli (1988) Rephaeli Y., 1988, Comm. Ap, 12, 265
- Strong et al. (2010) Strong A.W., Porter T.A., Digel S.W., Jóhannesson G., Martin P., Moskalenko I.V., Murphy E.J., Orlando E., 2010, ApJL, 722, L58
- Miller et al. (2009) Miller, N.A., et al., 2009, Astron J., 137, 4450
- Feretti & Giovannini (1987) Feretti L., Giovannini G., 1987, A&A, 182, 15
- Feretti et al. (1990) Feretti L., et al., 1990, A&A, 232, 337
- Feretti et al. (1995) Feretti L., et al., 1995, A&A, 302, 680
- Ade et al. (2013) Ade, P.A.R., et al., 2013, Planck collaboration, A&A, 554, A140
- Mannheim & Schlickeiser (1994) Mannheim K., Schlickeiser R., 1994, A&A, 286, 983
- Pizzo (2010) Pizzo R., 2010, PhD thesis, Groningen University, Holland
- Brown & Rudnick (2011) Brown S., Rudnick L., 2011, MNRAS, 412, 2
- Deiss (1997) Deiss, B.M., 1997, A&A, 321, 55
- Wiegert et al. (2015) Wiegert, T. et al., 2015, Astron. J. 150, 81
- Ackermann et al. (2016) Ackermann M., et al., 2016, ApJ. 819, 149
- Rephaeli, Gruber, & Rothschild (1987) Rephaeli Y., Gruber D.E., Rothschild R.E., 1987, ApJ, 320, 139
- Wik et al. (2014) Wik, D.R. et al. 2014, ApJ, 792, 48
- Rephaeli & Gruber (2002) Rephaeli Y., Gruber D.E., 2002, ApJ, 579, 587