Amplitude Variability in Dor and Sct Stars Observed by the Kepler Spacecraft
Abstract
The NASA Kepler spacecraft data revealed a large number of multimode nonradially pulsating Dor and Sct variable star candidates. The Kepler high precision long time-series photometry makes it possible to study amplitude variations of the frequencies. We summarize recent literature on amplitude and frequency variations in pulsating variables. We are searching for amplitude variability in several dozen faint Doradus or Scuti variable-star candidates observed as part of the Kepler Guest Observer program. We apply several methods, including a Matlab-script wavelet analysis developed by J. Jackiewicz, and the wavelet technique of the VSTAR software (http://www.aavso.org/vstar-overview). Here we show results for two stars, KIC 2167444 and KIC 2301163. We discuss the magnitude and timescale of the amplitude variations, and the presence or absence of correlations between amplitude variations for different frequencies of a given star. Amplitude variations may be detectable using Kepler data even for stars with Kepler magnitude 14 with low-amplitude frequencies (100 ppm) using only one or a few quarters of long-cadence data. We discuss proposed causes of amplitude spectrum variability that will require further investigation.
keywords:
stars: Sct; stars: Dor; stellar pulsations; Kepler spacecraft1 Why are amplitude variation unexpected and important?
For single stars with pulsations unstable to a driving mechanism such as the mechanism, pulsation properties are determined by the structure of the star, which usually changes very slowly with time via evolutionary processes, e.g., nucleosynthesis for main-sequence stars, or cooling for white dwarfs. The timescales for these processes are hundreds to thousands of years, rather than the hours to years over which we have photometric data and detect significant variations. Since growth rates calculated by linear nonadiabatic pulsation codes can be large (normalized work 10-3–10-6 per period), pulsation amplitudes should grow relatively quickly to reach a limiting amplitude. On the other hand, stochastically excited pulsations, as found in solar-like and red giant stars, are continuously excited and damped, so their amplitudes are expected to vary.
Amplitude variations may be useful diagnostics of energy partition/exchange between modes, and may involve modes of degree 3 that are more difficult to observe in photometry, or gravity modes with high amplitude in the stellar interior that aren’t visible at the surface, or even stable modes. These variations may tell us something about energy exchange with internal dynamical processes (convection, rotation, magnetic fields) or changes in ionization regions that we cannot observe directly. They may indicate interaction with the external environment, e.g., via mass outflow, accretion, or tidal forces from a binary companion or planet. Understanding the mechanisms that limit amplitudes or cause amplitude variations will be important to understand mode selection, and to validate nonlinear nonradial and nonadiabatic pulsation models.
2 Causes of amplitude/frequency variations
Amplitude and/or frequency variations have been found among nearly all types of non-stochastically excited pulsating variables: Sct ([Breger et al. 2012, Breger & Pamyatnykh 2006, Bowman & Kurtz 2014]); Dor ([Rostopchina et al. 2013]); Cep ([Pigulski & Pojmanski 2008]), roAp ([Balona et al. 2013, Medupe et al. 2015]); classical pulsators such as high-amplitude Sct stars ([Zhou & Jiang 2011, Khokhuntod et al. 2011]), Cepheids ([Engle 2015]), RR Lyrae ([Chadid & Preston 2013]), Miras and yellow supergiants ([Percy & Yook 2014, Percy & Khatu 2014]); white dwarfs (DBV; [Handler et al. 2003] and DAV; [Bell et al. 2015]); GW Vir stars ([Vauclair et al. 2012]), sdB stars ([Kilkenny 2010, Langfellner et al. 2012]), and an extreme helium subdwarf ([Bear & Soker 2014]).
A non-comprehensive list of proposed explanations for the variations includes: parametric instability (unstable high frequency mode excites two lower frequency stable modes with + = ; see [Dziembowski & Krolikowska 1985]); resonant mode coupling ([Barceló Forteza et al. 2015]); stochastic excitation instead of intrinsically unstable modes (see, e.g., [Huber et al. 2011]); energy from the modulated mode exchanged with, e.g., the convection zone, ionization region or magnetic field; ‘weather’ (atmospheric disturbances) from a tidally locked planet ([Bear & Soker 2014]); tidal effects from an unseen binary or planetary companion; outbursts (e.g., Be star 102719279; [Gutierrez-Soto et al. 2010]), or accretion (e.g., GW Lib; [Toloza et al. 2015]) changing the star’s structure; pulsations sampling the crystallization region (white dwarf interior; [Hermes et al. 2015]); diffusive settling of helium ([Cox 1998]); the star is caught during a phase of rapid evolution, e.g., at the edge of an instability strip, or during the rapid core contraction phase at the end of core hydrogen burning. Sometimes apparent amplitude variations are attributable to insufficiencies in the time series data or analysis, e.g., to very close frequencies not being resolved, an interruption in the time series, or an artifact from the temporal distribution of data. The papers by [Bowman & Kurtz 2014, Breger & Montgomery 2014, Barceló Forteza et al. 2015, Holdsworth et al. 2014, Bowman & Kurtz (2014), Breger & Montgomery (2014), Barceló Forteza et al. (2015), Holdsworth et al. (2014)], and [Percy & Khatu 2014, Percy & Khatu (2014)] provide discussion and further references for causes of amplitude and frequency variations.
3 Amplitude variations in Dor/ Sct stars
Detecting (or ruling out) amplitude variations requires high-precision continuous time series data that captures many pulsation periods. We now have many data sets that can be used to study such variations, including those from Kepler and CoRoT ( Sct and Dor stars), ASAS (B stars), WET (white dwarfs and roAp stars), and AAVSO (long-period variables and giants) observations. The Kepler spacecraft has returned continuous time-series observations spanning months to years, either in long cadence (30-minute integrations per data point), or short cadence (1-minute integrations), with micro-magnitude precision in the amplitude spectrum.
We are searching for amplitude variations in mostly faint (Kp mag 14) Dor and Sct candidates discovered in long-cadence data via the Kepler Guest Observer program. We used the weighted-wavelet z-transform technique (Foster 1996) available in the VSTAR software from the American Association of Variable Star Observers. For the example analyses shown below, we use 1000 data points per Gaussian wavelet, that translate to 20-day windows for long-cadence data. We also show results for the wavelet-analysis script written using Matlab by J. Jackiewicz, choosing 50-day wide data windows, with 10-day or 5-day offsets. We note that it is important to consider the width of the time series to analyze, as well the offset between windows; too-large windows and too-large offsets will average out or decrease the size of amplitude variations, and too-small windows will have low signal-to-noise and fail to resolve closely spaced modes.
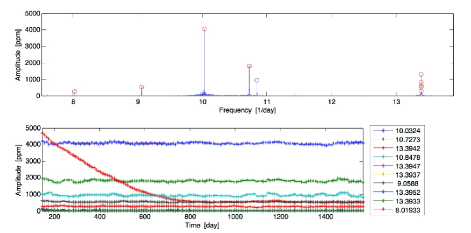
We first tested the Matlab script on Kepler data for KIC 7106205 (Kp mag = 11.455), and easily detect in long-cadence data the large amplitude decrease of the 13.3942 c/d mode reported by [Bowman & Kurtz 2014, Bowman & Kurtz (2014)] (Fig. 1). This script corrects the amplitude and phase vs. time for reduced duty cycle in the Kepler data. As seen in later analysis, this correction is only partially successful at the edges of observation quarters without data (zero duty cycle).
3.1 KIC 2167444
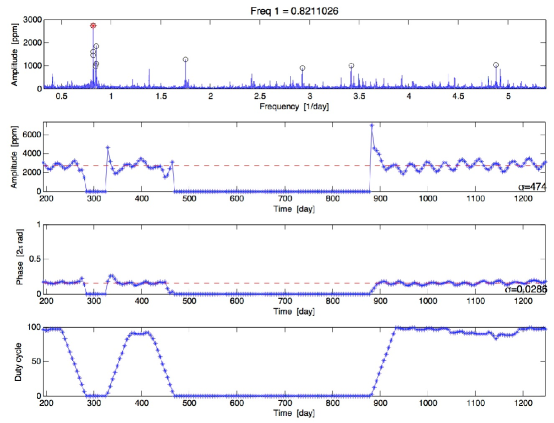
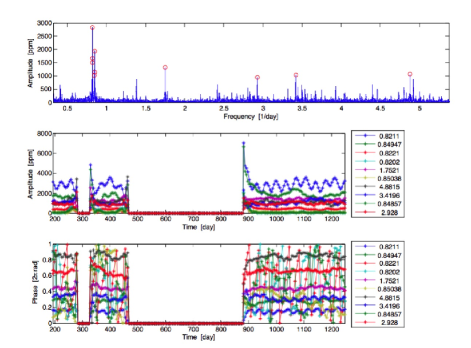
KIC 2167444 is a Kp mag 14.1 Dor candidate observed by Kepler in long cadence during Quarters 2, 4, and 10-13. Figure 2 shows the Matlab-script amplitude spectrum (top panel) and the wavelet-analysis amplitude (2nd panel) and phase (3rd panel) vs. time for the highest-amplitude peak at 0.8211 c/d. The amplitude and phase show a pronounced modulation of about 32 days. The amplitude is not reliable in the regions where the duty cycle drops off quickly (bottom panel). Figure 3 shows the Matlab-script results for the amplitude and phase variations of the 10 highest-amplitude modes (marked with red circles on the amplitude spectrum in the top panel). The second-highest amplitude mode at 0.8495 c/d shows an amplitude modulation similar to the 0.8211 c/d mode during Q2 and 4, but a more gradual variation in Q10-13. These two close frequencies should be resolved with the 50-day wavelet window, (resolution 0.02 c/d); their beating period is (1/(0.8211025-0.8494719)) = 35 days, so it is possible that beating between these modes is causing the amplitude variation, or that these two modes are interacting. There is a phase shift of 90∘ between the amplitude and phase variation of this mode, which fulfills the criteria for two modes beating against each other, according to [Breger & Pamyatnykh 2006, Breger & Pamyatnykh (2006)]. The modes at 1.7521, 4.8815, 3.4196, and 2.9280 c/d also show more subdued amplitude variations with similar periodicity; these modes are not obvious combination frequencies of the two highest-amplitude modes, so the periodicity is puzzling. An alternative explanation is that several high-amplitude modes are coupling to a low-frequency, possibly stable mode, as suggested by [Barceló Forteza et al. 2015, Barceló Forteza et al. (2015)] to explain amplitude modulations in the Sct star KIC 5892969.
The pair of modes at 0.8221 and 0.8202 c/d, and the pair at 0.8486 and 0.8504 c/d show very large phase variations in Fig. 3 (bottom panel). These modes are all multiples of 0.001 c/d away from a main mode, and are likely side-lobe artifacts generated by the finite-length data set of 1050 days (1/1050 days = 0.001 c/d). These modes essentially disappear when the main mode is prewhitened.
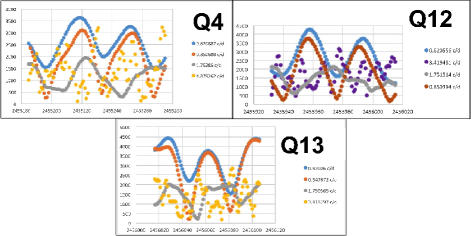
We also examined the data using the VSTAR wavelet analysis, and show results for the four highest-amplitude modes in Quarters 4, 10, and 13 (Fig. 4). VSTAR finds the same highest-amplitude modes, including the 0.82 and 0.85 c/d modes. The VSTAR plots show that the amplitude variations between the 0.82 and 0.85 c/d highest amplitude modes are not exactly in phase with each other. The amplitude variation of the 1.75 c/d mode is more regular during Q4 than in subsequent quarters. In Q12 and 13, the 3.42 c/d mode has a higher amplitude, while in Q4 the 4.88 c/d mode is more prominent.
3.2 KIC 2301163
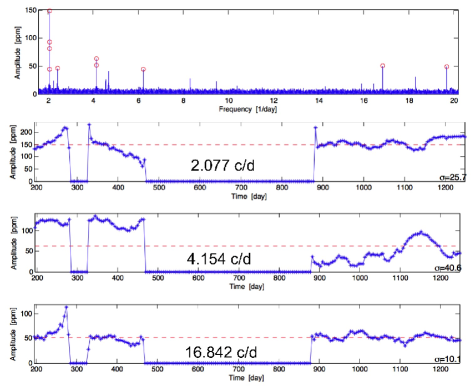
KIC 2301163 is a Kp mag 14.1 Dor/ Sct hybrid candidate that was also observed in Quarters 2, 4, and 10-13. This star shows significant amplitude variations, even though the amplitudes are an order of magnitude lower than for KIC 2167444 (100 ppm instead of 1000 ppm). Figure 5 shows the amplitude spectrum and the amplitude vs. time for three of the highest-amplitude peaks. The highest-amplitude mode at 2.077 c/d and the next-highest amplitude mode at 4.154 c/d, nearly exactly twice the frequency of the first mode, show different amplitude variations, even though one mode could be a harmonic of the other. The possible Sct-type p mode at 16.842 c/d does not show significant amplitude variation (standard deviation 10 ppm, about the noise level of the amplitude spectrum).
4 Conclusions
Amplitude variations may be detectable by Kepler even for stars with Kp14 with low-amplitude frequencies 100 ppm using only one or a few quarters of long-cadence data. Amplitude variations for different frequencies are sometimes correlated. It seems that analysis of the Kepler data to interpret amplitude variations requires significant effort for each star, and that it will be difficult to find patterns or draw a general conclusion by studying an ensemble of stars.
Acknowledgements.
We gratefully acknowledge the NASA Kepler Guest Observer Program, the DOE Science Undergraduate Laboratory Internship program, and Los Alamos National Laboratory.References
- [Balona et al. 2013] Balona, L.A. et al. 2013, MNRAS, 432, 2808
- [Barceló Forteza et al. 2015] Barceló Forteza, B. et al. 2015, A&A, 579, A133
- [Bear & Soker 2014] Bear, E. and Soker, N. 2014, MNRAS, 437, 1400
- [Bell et al. 2015] Bell, K.J. et al. 2015, ApJ, 809, 14
- [Bowman & Kurtz 2014] Bowman, D. & Kurtz, D. 2014, MNRAS, 444, 209
- [Breger et al. 2012] Breger, M. et al. 2012, ApJ, 759, 62
- [Breger & Montgomery 2014] Breger, M. & Montgomery, M. 2014, ApJ, 783, 89
- [Breger & Pamyatnykh 2006] Breger, M. & Pamyatnykh, A.A. 2006, MNRAS, 368, 571
- [Chadid & Preston 2013] Chadid, M. & Preston, G.W. 2013, EAS, 63, 47
- [Cox 1998] Cox, A.N. 1998, ApJ, 496, 246
- [Dziembowski & Krolikowska 1985] Dziembowski, W. & Krolikowska, M. 1985, AcA, 35, 5
- [Engle 2015] Engle, S.G. 2015, Ph.D. Thesis, James Cook University, 2015arXiv150402713E
- [Foster 1996] Foster, G. 1996, AJ, 112, 1709
- [Gutierrez-Soto et al. 2010] Gutierrez-Soto, J., et al. 2010, 2010arXiv1010.1910G
- [Handler et al. 2003] Handler, G. et al. 2003, MNRAS, 340, 1031
- [Hermes et al. 2015] Hermes, J.J. et al. 2015, ASPC, 493, 59
- [Holdsworth et al. 2014] Holdsworth, D.L. et al. 2014, MNRAS, 443, 2049
- [Huber et al. 2011] Huber, D., et al. 2011, ApJ, 743, 143
- [Khokhuntod et al. 2011] Khokhuntod, P. et al. 2011, IBVS, in preparation, 2011arXiv1109.3840K
- [Kilkenny 2010] Kilkenny, D. 2010, Ap&SS, 329, 175
- [Langfellner et al. 2012] Langfellner, J. et al. 2012, ASPC, 452, 203
- [Medupe et al. 2015] Medupe, R. et al. 2015 MNRAS, 446, 1347
- [Percy & Khatu 2014] Percy, J.R. & Khatu, V.C. 2014, JAAVSO, 42, 1
- [Percy & Yook 2014] Percy, J.R. & Yook, J.Y. 2014, JAAVSO, 42, 245
- [Pigulski & Pojmanski 2008] Pigulski, A. & Pojmanski, G. 2008, A&A, 477, 907
- [Rostopchina et al. 2013] Rostopchina, A., Breger, M., and Hansen, G. 2013, AAS, 22135424R
- [Toloza et al. 2015] Toloza, O., et al. 2015, ASPC, 493, 253
- [Vauclair et al. 2012] Vauclair, G. et al. 2012, ASPC, 462, 160
- [Zhou & Jiang 2011] Zhou, A.-Y. & Jiang, S.-Y. 2011, AJ, 142, 100