The frequency and properties of young tidal dwarf galaxies in nearby gas-rich groups
Abstract
We present high-resolution Giant Metrewave Radio Telescope (GMRT) Hi observations and deep Canada-France-Hawaii Telescope (CFHT) optical imaging of two galaxy groups: NGC 4725/47 and NGC 3166/9. These data are part of a multi-wavelength unbiased survey of the gas-rich dwarf galaxy populations in three nearby interacting galaxy groups. The NGC 4725/47 group hosts two tidal knots and one dIrr. Both tidal knots are located within a prominent Hi tidal tail, appear to have sufficient mass ( 108 ) to evolve into long-lived tidal dwarf galaxies (TDGs) and are fairly young in age. The NGC 3166/9 group contains a TDG candidate, AGC 208457, at least three dIrrs and four Hi knots. Deep CFHT imaging confirms that the optical component of AGC 208457 is bluer — with a 0.28 mag - colour — and a few Gyr younger than its purported parent galaxies. Combining the results for these groups with those from the NGC 871/6/7 group reported earlier, we find that the Hi properties, estimated stellar ages and baryonic content of the gas-rich dwarfs clearly distinguish tidal features from their classical counterparts. We optimistically identify four potentially long-lived tidal objects associated to three separate pairs of interacting galaxies, implying that TDGs are not readily produced during interaction events as suggested by some recent simulations. The tidal objects examined in this survey also appear to have a wider variety of properties than TDGs of similar mass formed in current simulations of interacting galaxies, which could be the result of pre- or post-formation environmental influences.
keywords:
galaxies: dwarf – galaxies: groups: individuals: NGC 3166/9, NGC 4725/47, NGC 871/6/7 – galaxies: interactions1 Introduction
Most present-day galaxies reside in medium-density group environments (Eke et al. 2004, Tago et al. 2008), where tidal interactions dominate the dynamics of the contained members. Gaseous material pulled from initial close encounters between galaxies can produce second-generation tidal dwarf galaxies (TDGs), which differ from first-generation ‘classical’ dwarfs by their lack of dark matter, increased star formation rates (SFRs) and higher metallicity due to pre-enriched stars drawn from parent galaxies (Hunter, Hunsberger & Roye 2000, Duc et al. 2007, Kaviraj et al. 2012, Lelli et al. 2015). The overall prevalence of TDGs and their significance within the dwarf galaxy population are hotly debated topics (e.g. Kroupa 2012, Duc et al. 2014).
Hierarchical galaxy formation simulations imply that the incidence of TDGs should be quite low at the current epoch (Sheen et al., 2009); whereas, numerical modelling and extrapolation by Dabringhausen & Kroupa (2013) conclude that the majority of nearby galaxies should be tidal in nature. Sample size is one of the main sources of discrepancy between various studies. For example, Kroupa (2012) uses three TDGs to argue that the similarities in the properties between tidal and classical dwarfs disproves the existence of dark matter. Additionally, very few () TDGs are widely considered as authentic (Weilbacher et al., 2003) due to the variety of corroborating observations that are required to confirm that classification (Duc et al., 2014).
The formation of tidal knots — i.e. clumps of gas and possibly stars located near or within tidal tails that do not show signs of self-gravitation and are therefore not (yet) considered to be actual galaxies — also appears to skew each argument. Numerical simulations of a multitude of paired spiral galaxy interactions by Bournaud & Duc (2006) show that 6.2 tidal knots (with ) are formed per interaction event. The majority of these knots fall back into their parents within 102 Myr and by the end of the simulations (t = 2 Gyr) 1.2 long-lived tidal knots, which at that point are considered TDGs, remain. Conversely, simulations used by Yang et al. (2014) and references therein — in an attempt to explain the planes of satellite galaxies detected in the Local Group (LG; see Pawlowski, Pflamm-Altenburg & Kroupa 2012, Ibata et al. 2013) — suggest that a few tens of tidal knots can be formed in each tidal filament produced during an encounter, and that each knot has adequate mass ( ) and separation distance from the gravitational well of their parent galaxies to survive for several Gyr.
We have conducted a detailed investigation of three nearby gas-rich interacting galaxy groups to study the properties and frequency of TDGs in these environments, affording an opportunity to place observational constraints on the different TDG formation and survival rates obtained in the aforementioned simulations. The groups were selected from the single-dish neutral hydrogen (Hi) Arecibo Legacy Fast ALFA survey (ALFALFA; Giovanelli et al. 2005) and show signs of recent or on-going tidal interaction events dominated by a pair of spiral galaxies, which optimizes likelihood of detecting young TDGs. The blind nature of ALFALFA allowed us to follow up every gas-rich detection in these groups in order to determine its origin, thereby producing an unbiased census of first- and second-generation systems.
We have obtained high-resolution follow-up observations for each group with the Giant Metrewave Radio Telescope (GMRT) to identify gas-rich dwarfs and measure their Hi and dynamical masses (see Lee-Waddell et al. 2012; hereafter Paper 1). Deep optical imaging, from the Canada-France-Hawaii Telescope (CFHT) MegaCam, has been used to identify putative low surface brightness optical counterparts of the low-mass features and estimate their stellar masses and ages (see Lee-Waddell et al. 2014; hereafter Paper 2). The combination of our Hi imaging and optical photometry allows for dynamical to baryonic mass calculations and stellar population estimates that we use to classify TDG candidates, short-lived tidal knots and first-generation gas-rich dwarf irregular galaxies (dIrrs) in our census of gas-rich dwarf galaxies in three nearby groups.
NGC 3166/9 is a gas-rich group that comprises three spiral galaxies and shows signs of recent tidal interactions. In Paper 1, we detected and resolved the atomic gas component of eight low-mass group members including a TDG candidate, AGC 208457, using a mosaic of six GMRT pointings. That paper outlines our methodology for analyzing interferometric Hi observations. The GMRT data for the NGC 3166/9 group indicate that AGC 208457 has sufficient mass to be self-gravitating and has a dynamical to gas mass ratio close to unity, which denotes a lack of dark matter and is one of the hallmarks of a TDG. Given the Hi and SDSS-depth optical properties of the remaining seven detections, we classified three as typical dIrrs and the remaining four as short-lived tidal knots that will likely fall back into their parent galaxies.
NGC 871/6/7 also consists of three gas-rich spirals that are located within an extended Hi distribution, which indicates ongoing tidal interactions within this group. In Paper 2, our Hi observations revealed five gas-rich low-mass objects, four of which are likely dIrrs. The other low-mass feature is AGC 749170, which has an Hi mass but an extremely faint stellar counterpart near the detection limit of our deep CFHT data, implying a dynamical mass to stellar light ratio . The lack of dark matter () associated with AGC 749170 and the apparently young age of the putative optical counterpart suggest tidal origins for this intriguing gas cloud; however, while it is massive enough to be long-lived (e.g. Bournaud & Duc 2006), its low stellar content does not resemble any of the tidal systems obtained in simulations. Note, the extremely optically dim optical feature that spatially coincides with AGC 749170 was detected, for the first time, by MegaCam and the Elixir/Elixir-LSB processing pipeline (Magnier & Cuillandre 2004, Cuillandre & Ferrarese 2011), which illustrates the utility of deep optical photometry for understanding the origin of Hi features in nearby interacting galaxy groups.
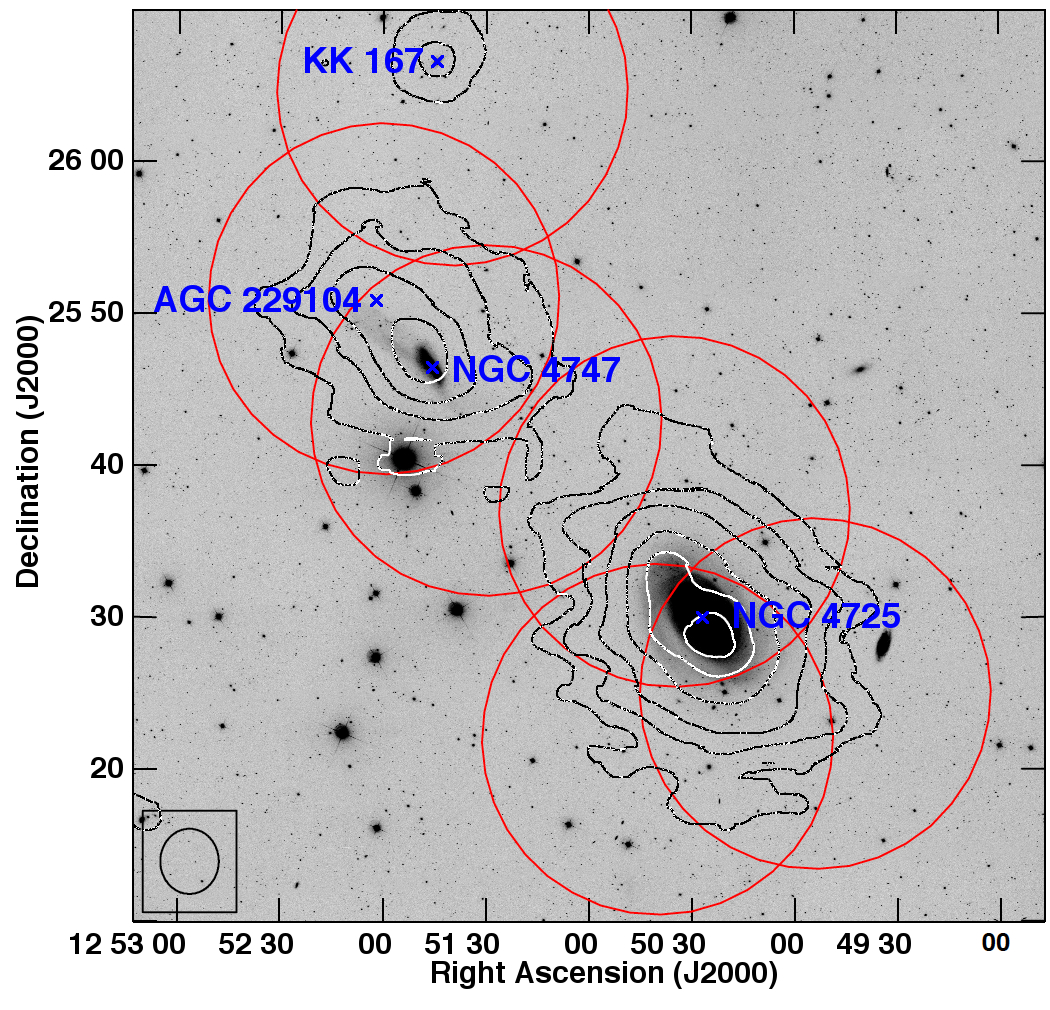
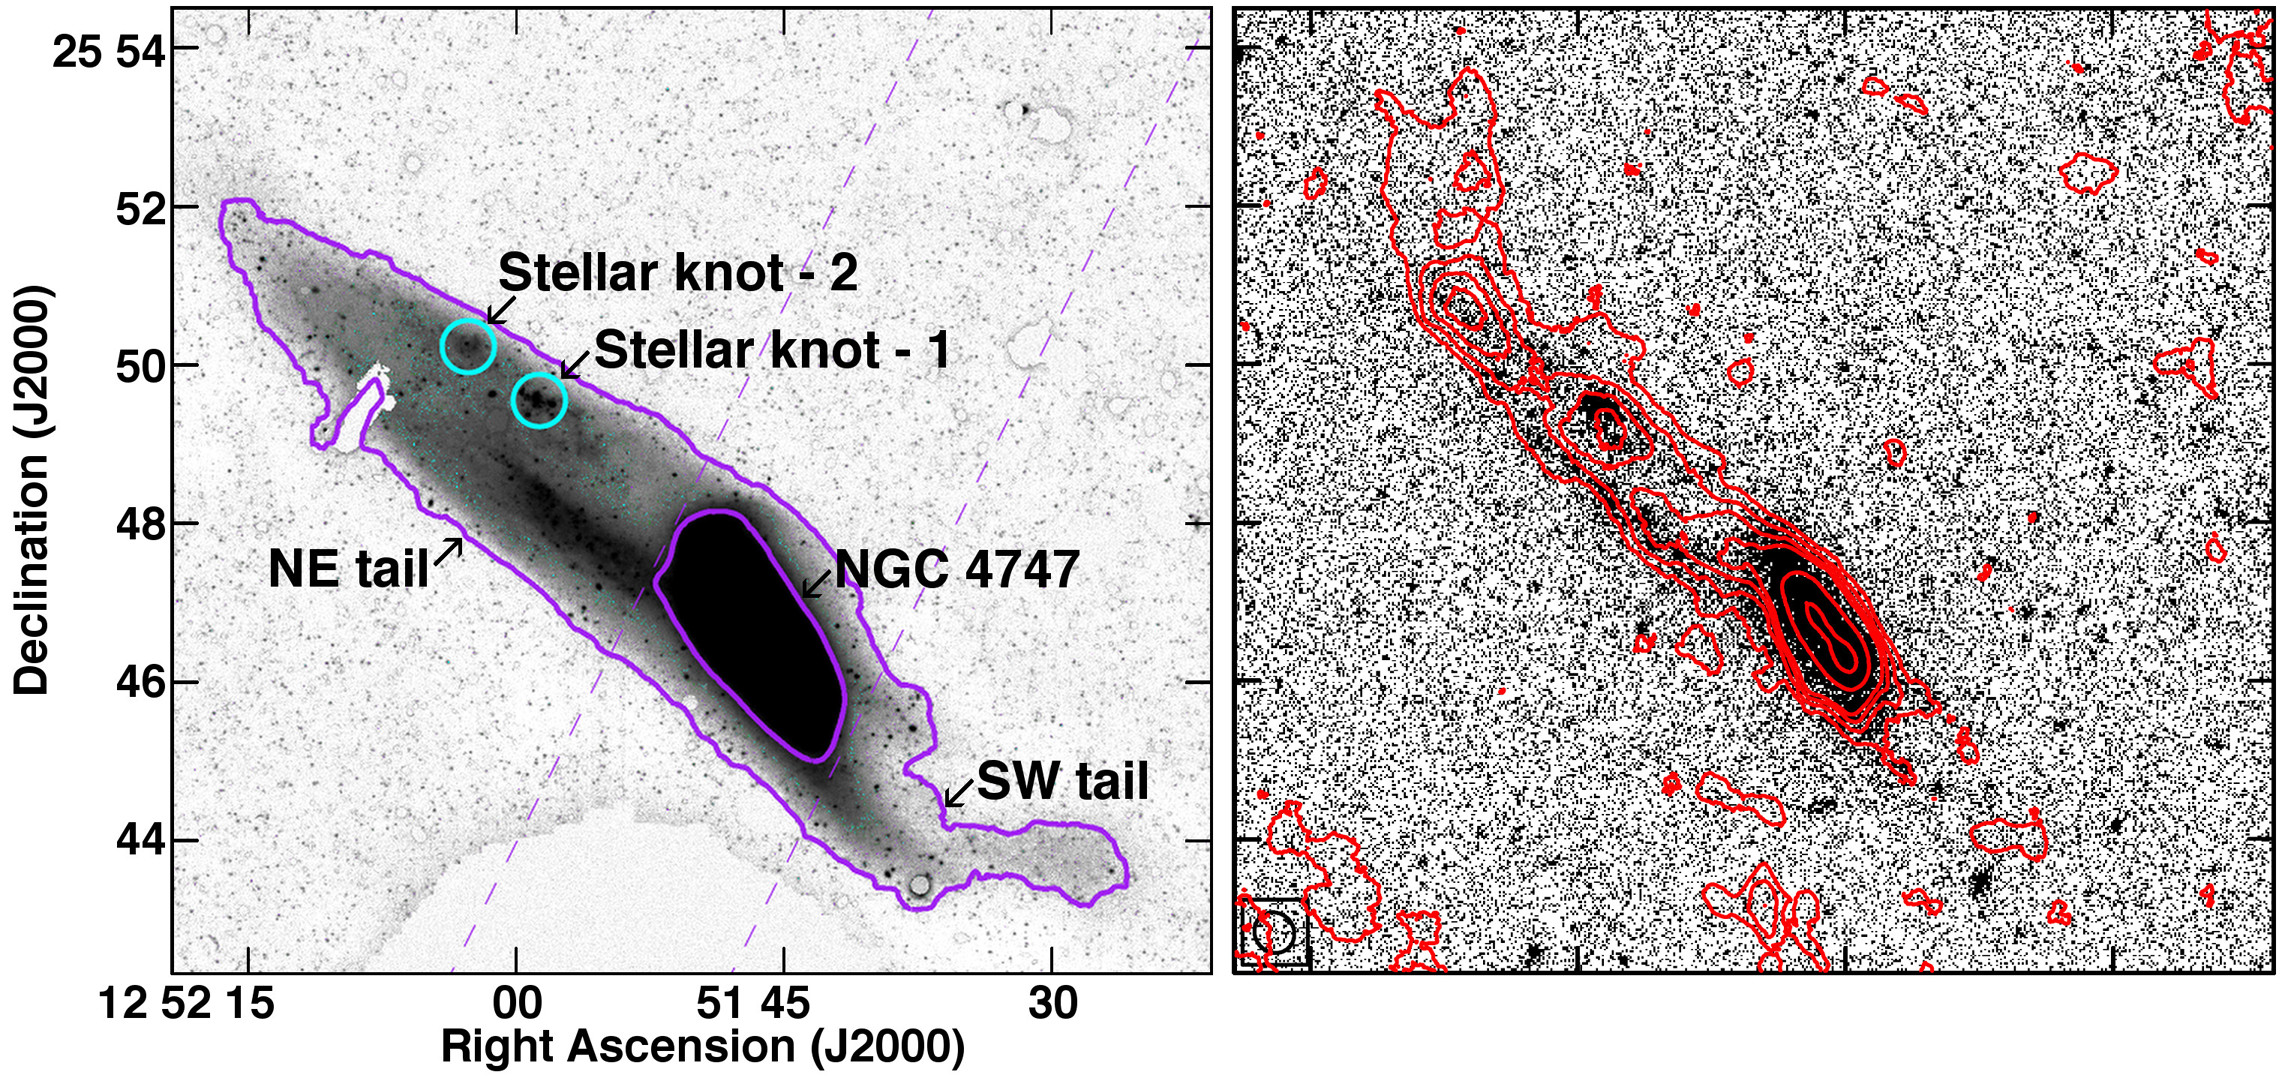
NGC 4725/47 is a galaxy group that contains two spirals, NGC 4725 and NGC 4747 (previously observed in Hi by Haynes 1979 and Wevers et al. 1984), and at least one dIrr galaxy KK 167 (Karachentseva & Karachentsev, 1998). NGC 4725 has a SABab visual morphology; whereas, NGC 4747 is a nearly edge-on system with a SBcd morphology (Wevers et al., 1984). The latter has a visibly perturbed disk, possibly three stellar tails — two directed north-east (NE) and one south-west (SW; see Fig. 1) — and an Hi tail extending away from NGC 4725, which strongly suggest that the two spirals are tidally interacting (Haynes, 1979). ALFALFA detects an Hi peak, AGC 229104, that coincides with the NE stellar tails (Haynes et al., 2011). The median distance to NGC 4725 — derived from Cepheid variable stars — is 13 Mpc (Gibson et al., 1999), which is the assumed distance for all group members throughout this paper.
This paper presents additional observational components of our multi-wavelength investigation of the gas-rich dwarf galaxy populations of three interacting groups. In Section 2, we present high-resolution interferometric Hi observations from the GMRT and the gas properties of each detectable group member in NGC 4725/47. Deep optical imaging from the CFHT MegaCam and estimates of the stellar properties for the low-mass objects found in NGC 3166/9 and NGC 4725/47 are detailed in Section 3. Section 4 summarizes the results of the low-mass galaxy populations in the two groups. In Section 5, we present the culmination of our study of gas-rich dwarf galaxies and tidal features in NGC 3166/9, NGC 871/6/7 and NGC 4725/47, and compare our results to TDG simulations found in the literature.
2 GMRT Observations of NGC 4725/47
Using the ALFALFA map as a pointing guide and following a similar observational set-up and reduction technique as described in Papers 1 and 2, the GMRT data consist of six pointings observed — at a central frequency of 1414.8 MHz — over seven nights in mid-December 2012, early February 2013 and mid-August 2013 (Fig. 1). The 48 hours of usable telescope time, which included calibration observations on standard flux calibrators (3C147, 3C138 and 3C286) and nearby phase calibrators 1227+365 and 1330+251, were divided between the six pointings. The observation set-up and map parameters are summarized in Table 1.
| Parameter | Value | Units |
|---|---|---|
| Number of pointings | 6 | |
| Average time on source per pointing | 330 | min |
| Primary beam HPBW per pointing | 19.7 | arcmin |
| Mosaicked map size | 80 | arcmin |
| Central observing frequency | 1414.8 | MHz |
| Observing bandwidth | 4.16 | MHz |
| Observing spectral resolution | 8.1 | kHz |
| Final cube spectral resolution | 24.4 | kHz |
| Final cube spectral resolution | 5.2 | km s-1 |
| Map spatial resolutions | 30 and 45 | arcsec |
| Peak map sensitivity: | ||
| 45 arcsec angular resolution | 1.5 | mJy beam-1 |
| 30 arcsec angular resolution | 1.2 | mJy beam-1 |
| Peak sensitivity around NGC 4747: | ||
| 45 arcsec angular resolution | 1.8 | mJy beam-1 |
| 30 arcsec angular resolution | 1.4 | mJy beam-1 |
| 15 arcsec angular resolution | 1.2 | mJy beam-1 |
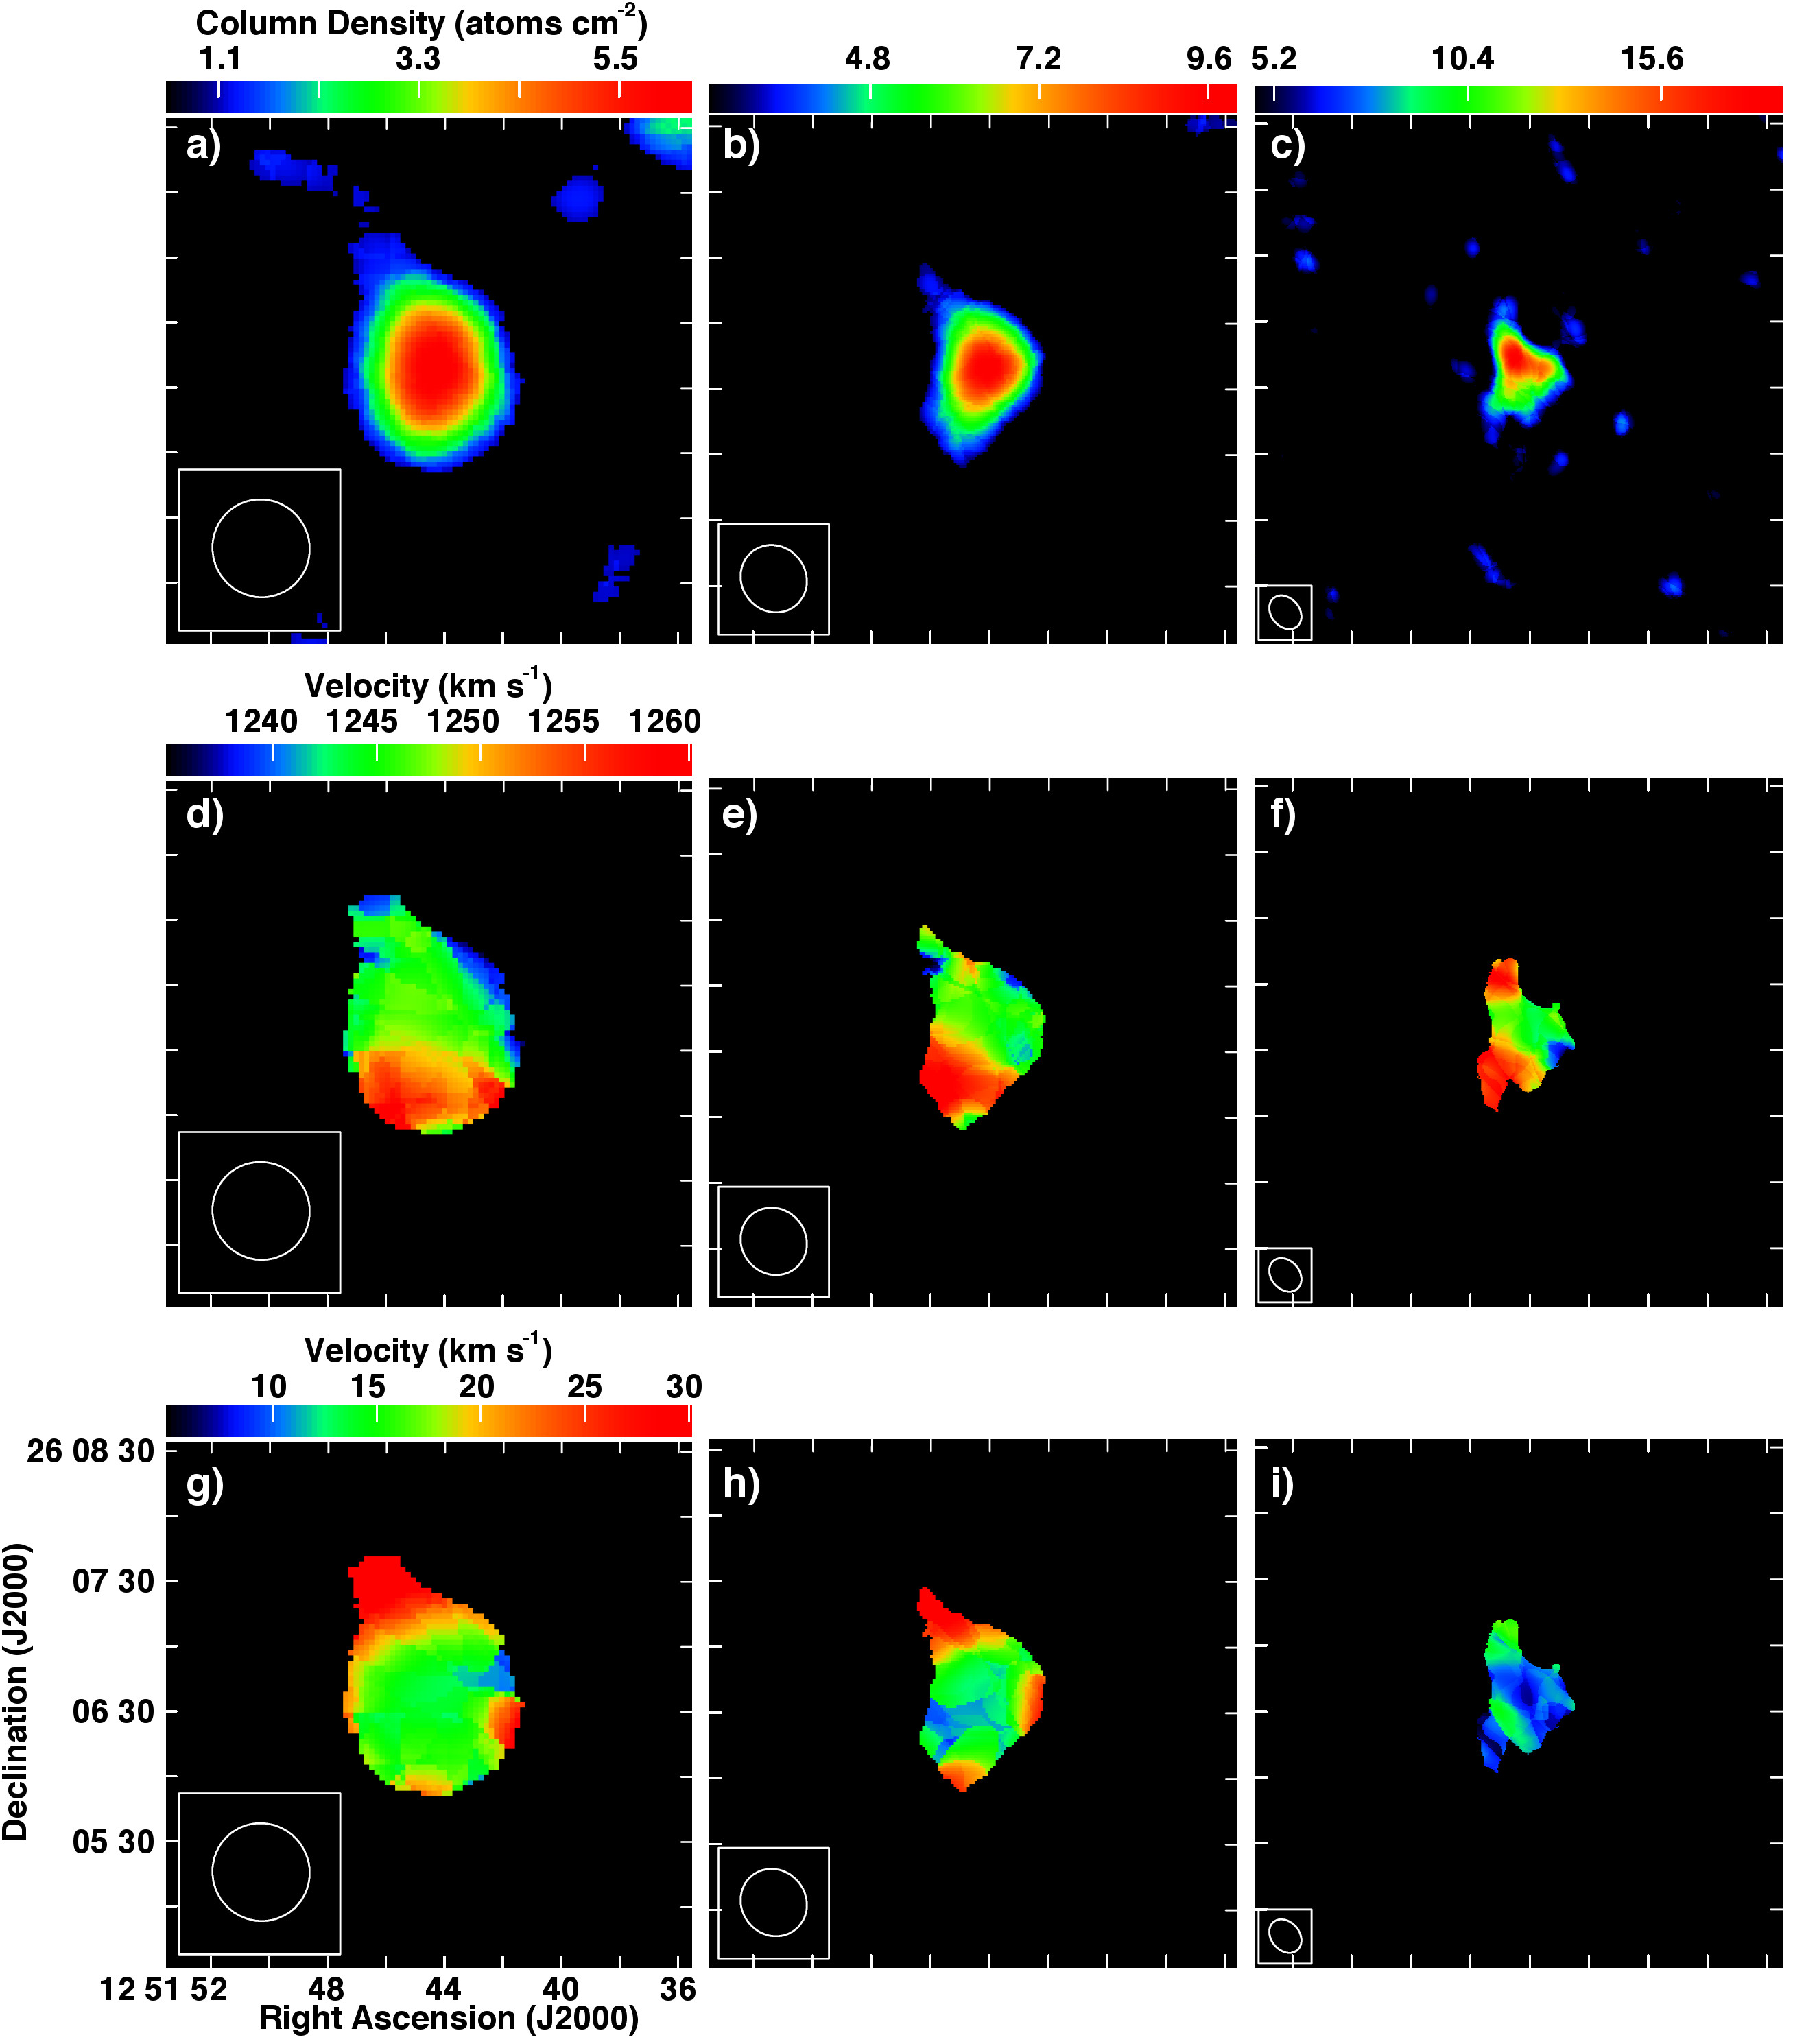
Data editing and reduction were completed using the Astronomical Image Processing System (AIPS) version 31Dec14 (Greisen, 2003) in the same manner as presented in Paper 1. The calibrated data cubes were mosaicked and imaged with tapering to produce 45 arcsec (= 3 kpc at the distance of NGC 4725/47; see Fig. 2) and 30 arcsec (2 kpc) synthesized beam sizes for the group maps. Higher resolution (and lower sensitivity) 15 arcsec (1 kpc) maps were also produced for the regions around KK 167 as well as NGC 4747 and its gas-rich tail (Figs 3 and 4). A three-channel average, resulting in a spectral resolution of 5.3 km s-1 (complementary to ALFALFA’s 5.2 km s-1 cubes) was used to produce the final maps. The pointing centred on KK 167 is significantly noisier ( mJy beam-1) than the others in the mosaic. Accordingly, Fig. 2 omits this pointing and shows only the central region of the group. The multiple moment maps at various resolutions in Figs 3 and 4 provide a detailed view of the Hi in KK 167 and the gas-rich tidal tail of NGC 4747.
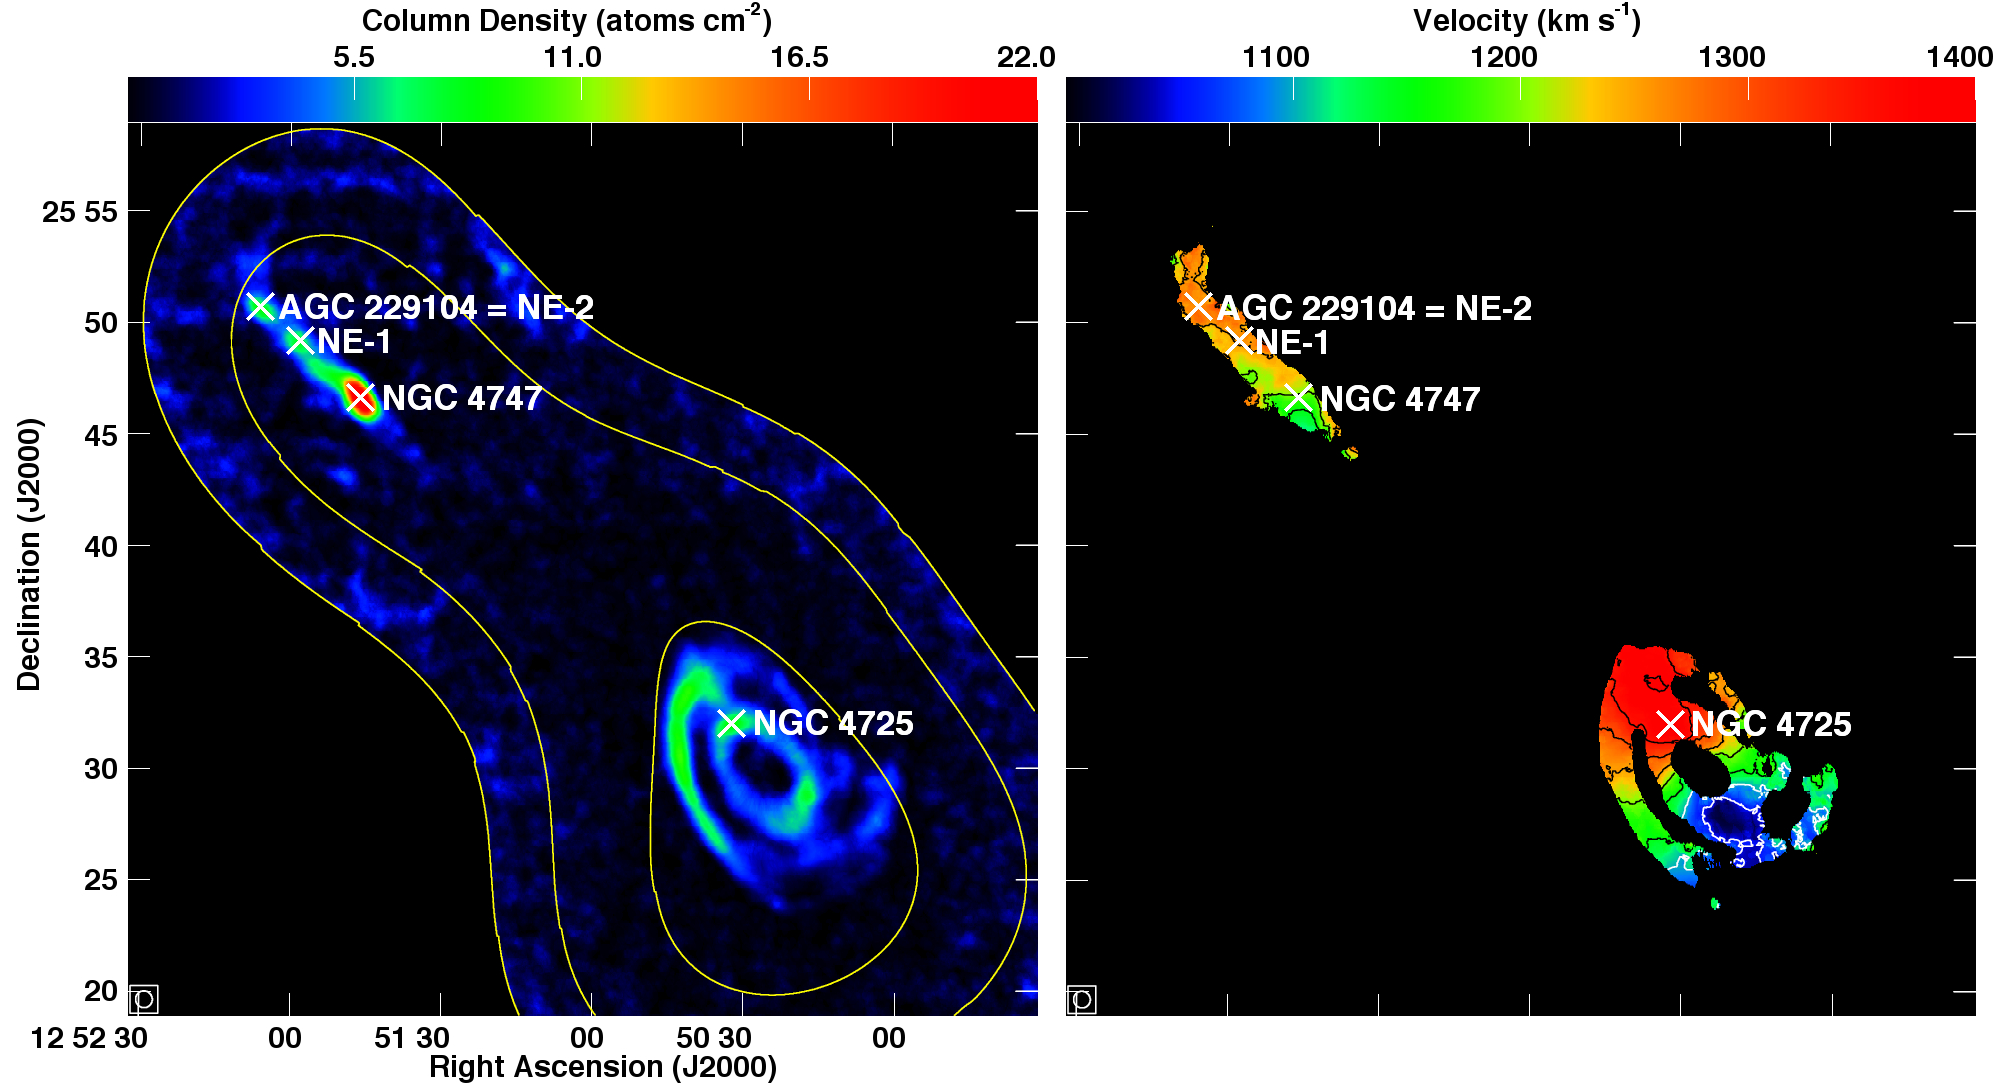

The GMRT observations are able to resolve the Hi in NGC 4725, KK 167, NGC 4747 and AGC 229104, which were previously detected by ALFALFA. In addition, the interferometric maps distinguish an Hi knot, NE-1, between NGC 4747 and AGC 229104 (see Fig. 4). Both NE-1 and AGC 229104 (hereafter NE-2) appear to be second-generation features formed from the gaseous material pulled out from NGC 4747 during an interaction event.
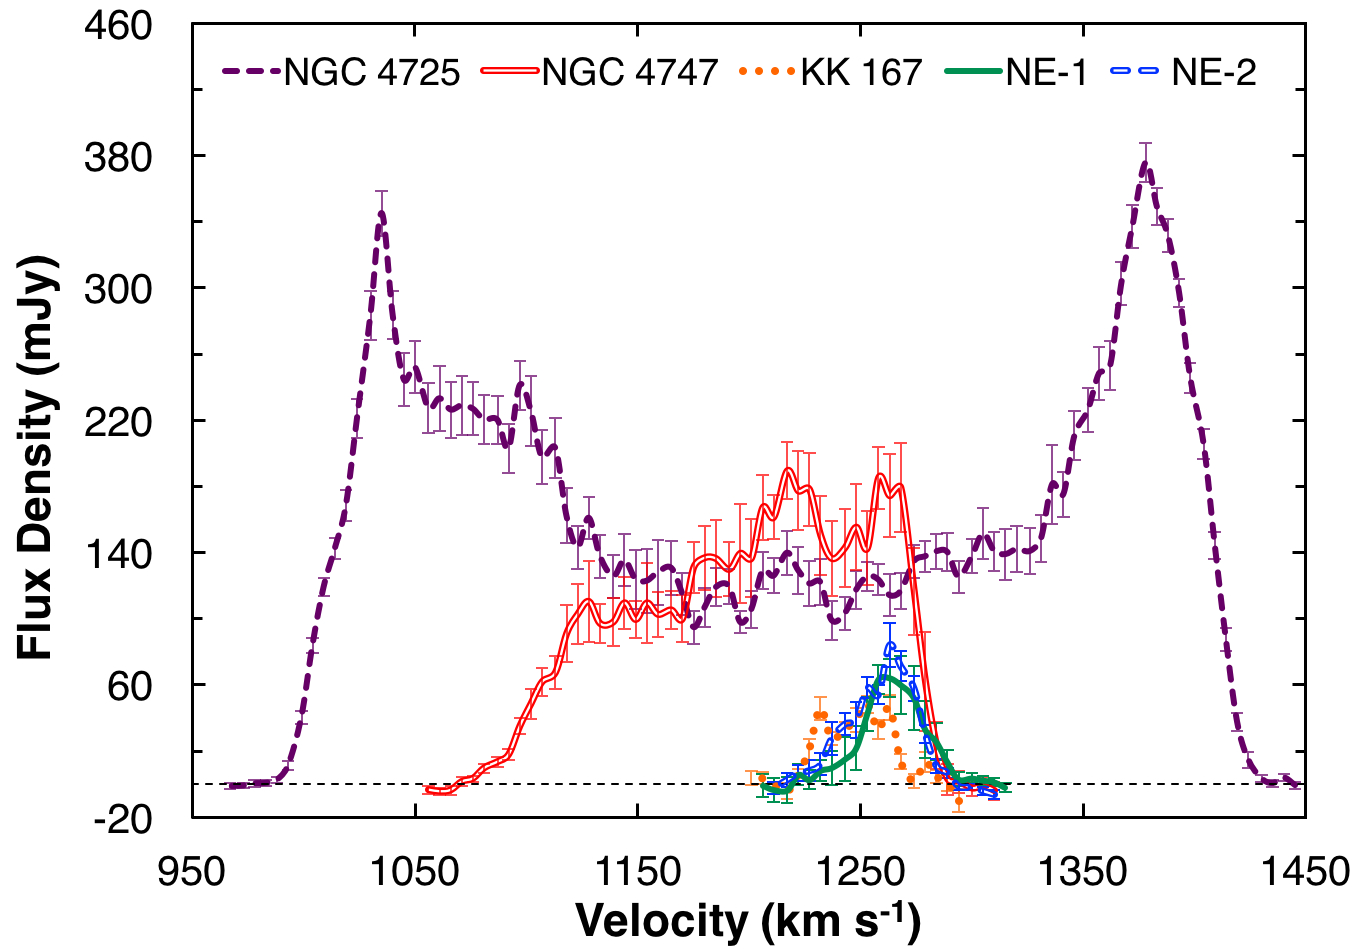
The flux density of each detection was measured from the higher sensitivity 45 arcsec angular resolution GMRT maps and used to produce the global profiles shown in Fig. 5. The Hi mass can be calculated using:
| (1) |
where is the distance to the source in Mpc and is the flux density of the global profiles integrated over velocity in Jy km s-1 (Giovanelli & Haynes, 1988). The Hi properties of each detection are presented in Table 2. The GMRT observations recover 80% of the Hi mass measured by ALFALFA for the relatively isolated dIrr and two spiral galaxies; however, the GMRT recovers only 20% of the ALFALFA-measured flux for NE-2; in fact, ALFALFA detects more than twice the Hi mass of the GMRT NE-1 and NE-2 detections combined. It is apparent that much of the gas in the region surrounding the tidal knot is diffusely distributed on scales greater than 5 arcmin (20 kpc) and is resolved out by the GMRT.
| Name | GMRT Coordinates | Optical Coordinates | (GMRT) | |||
|---|---|---|---|---|---|---|
| (J2000) | (J2000) | (mJy beam-1) | (Jy km s-1) | () | () | |
| (1) | (2) | (3) | (4) | (5) | (6) | (7) |
| NGC 4725 | 12 50 32.2, +25 32 00 | 12 50 26.6, +25 30 03 | 1.6 | 70 20 | 30 6 | 46.20 0.08 |
| KK 167 | 12 51 44.2, +26 06 36 | 12 51 44.3, +26 06 38 | 4.1 | 2 1 | 0.7 0.4 | 0.96 0.02 |
| NGC 4747 | 12 51 46.2, +25 46 38 | 12 51 45.7, +25 46 28 | 1.8 | 24 5 | 9 2 | 11.37 0.04 |
| NE-1 | 12 51 57.9, +25 49 14 | – | 1.9 | 2.2 0.7 | 0.9 0.3 | – |
| NE-2 (= AGC 229104) | 12 52 06.1, +25 50 42 | – | 2.0 | 2.7 0.7 | 1.1 0.3 | 4.94 0.02 |
Assuming that each gas-rich group member is self-gravitating and in dynamical equilibrium, the total dynamical mass of each object can be computed using:
| (2) |
where is the Hi major axis diameter of the object in arcmin, is the distance to the source in Mpc, is the velocity width — at 20% of the peak flux density — of each object in km s-1 and is the reported inclination. is measured from the atom cm-2 contour of the 30 arcsec angular resolution GMRT maps (the lowest statistically significant contour for all measured sources) and corrected for beam smearing effects.
The dynamical information for each detection is in Table 3. The uncertainty in is computed as the average half-difference between the masses computed using the more conservative value and other velocity width estimates (i.e. using the conventional — velocity width at 50% of the peak flux density — or the velocity difference across of each source). Note that NE-1 and NE-2 do not have velocity gradients that are consistent with rotation (see Fig. 4). It is possible that either of these objects might be face-on Hi disks, where an inclination correction would have significant affect on , but it is more likely that they are dominated by non-circular motions (i.e. pressure supported). The computed values of for these features adopt and have meaning only if they are in dynamical equilibrium.
| Source | |||||
|---|---|---|---|---|---|
| (km s-1) | (deg) | (arcmin) | (km s-1) | () | |
| (1) | (2) | (3) | (4) | (5) | (6) |
| NGC 4725 | 412 5 | 45a | 13.4 0.5 | 1209 3 | 5100 500 |
| KK 167 | 46 5 | 45b | 1.6 0.4 | 1246 3 | 7 1 |
| NGC 4747 | 184 5 | 64a | 3 1 | 1190 3 | 150 20 |
| NE-1 | 49 5 | – | 1.6 0.4 | 1265 3 | 4 1 |
| NE-2 | 48 5 | – | 1.9 0.6 | 1258 3 | 5 1 |
3 CFHT Observations
The CFHT MegaCam, with a 1 deg2 field of view, was used to obtained deep -band imaging of the groups in this study. Similar to the set-up described in Paper 2, a seven-point large dithering pattern (LDP-CCD-7), with exposures sequenced within a 1 hour time-frame to ensure minimal sky variations, was used for each filter. There was sufficient background in each image to allow for sky modelling and subtraction using the Elixir/Elixir-LSB processing pipeline (Magnier & Cuillandre 2004, Cuillandre & Ferrarese 2011), negating the requirement for off-target frames. The photometric images were stacked using Elixir to characterize and subtract the background and then processed through Elixir-LSB to remove the scattered light components (see Duc et al. 2011, Ferrarese et al. 2012). The final image pixels were binned ( arcsec2) to boost the signal-to-noise of the optical features. The zeropoint for each band is ZP = 29.61 mag and physical structures observed in the images can be detected down to 1 ADU above the sky background, which is equivalent to a detection limit of 28.4 mag arcsec-2 across the three bands.
Observations in -band for NGC 4725/47 (centred on NGC 4747, see below) and in all three bands for NGC 3166/9 were completed in semester 2013A. The remaining - and -band imaging of NGC 4725/47 were completed in semester 2014A. Since NGC 4725/47 spatially spans 1 deg (230 kpc) two sets of LDP-CCD-7 exposures — one centred on NGC 4725 and the other on NGC 4747 — were conducted in each of the two observing bands. The images were processed and stacked for each field separately and then stitched together for each band, which introduced faint artifacts in the final images. Since the stitched image does not significantly improve the sensitivity in the regions where the images overlap, the individual images centred on NGC 4747 were used for the measurements in this paper. The set-up parameters and resulting image properties for the utilized fields are summarized in Table 4.
| Parameter | -band | -band | -band |
| NGC 4725/47: | |||
| Exposure time (sec) | 345 | 345 | 270 |
| Number of exposures | 7 | 7 | 7 |
| Mean image quality (arcsec) | 1.16 | 1.16 | 1.19 |
| Sky background, bin (ADU) | 387.2 | 768.6 | 1187.2 |
| Sky brightness (mag arcsec-2) | 22.0 | 21.8 | 20.7 |
| Detection limit (mag arcsec-2) | 28.4 | 28.4 | 28.4 |
| NGC 3166/9: | |||
| Exposure time (sec) | 345 | 345 | 270 |
| Number of exposures | 7 | 7 | 7 |
| Mean image quality (arcsec) | 0.88 | 0.74 | 0.97 |
| Sky background, bin (ADU) | 463.9 | 778.6 | 1284.0 |
| Sky brightness (mag arcsec-2) | 21.8 | 21.8 | 20.6 |
| Detection limit (mag arcsec-2) | 28.4 | 28.4 | 28.4 |
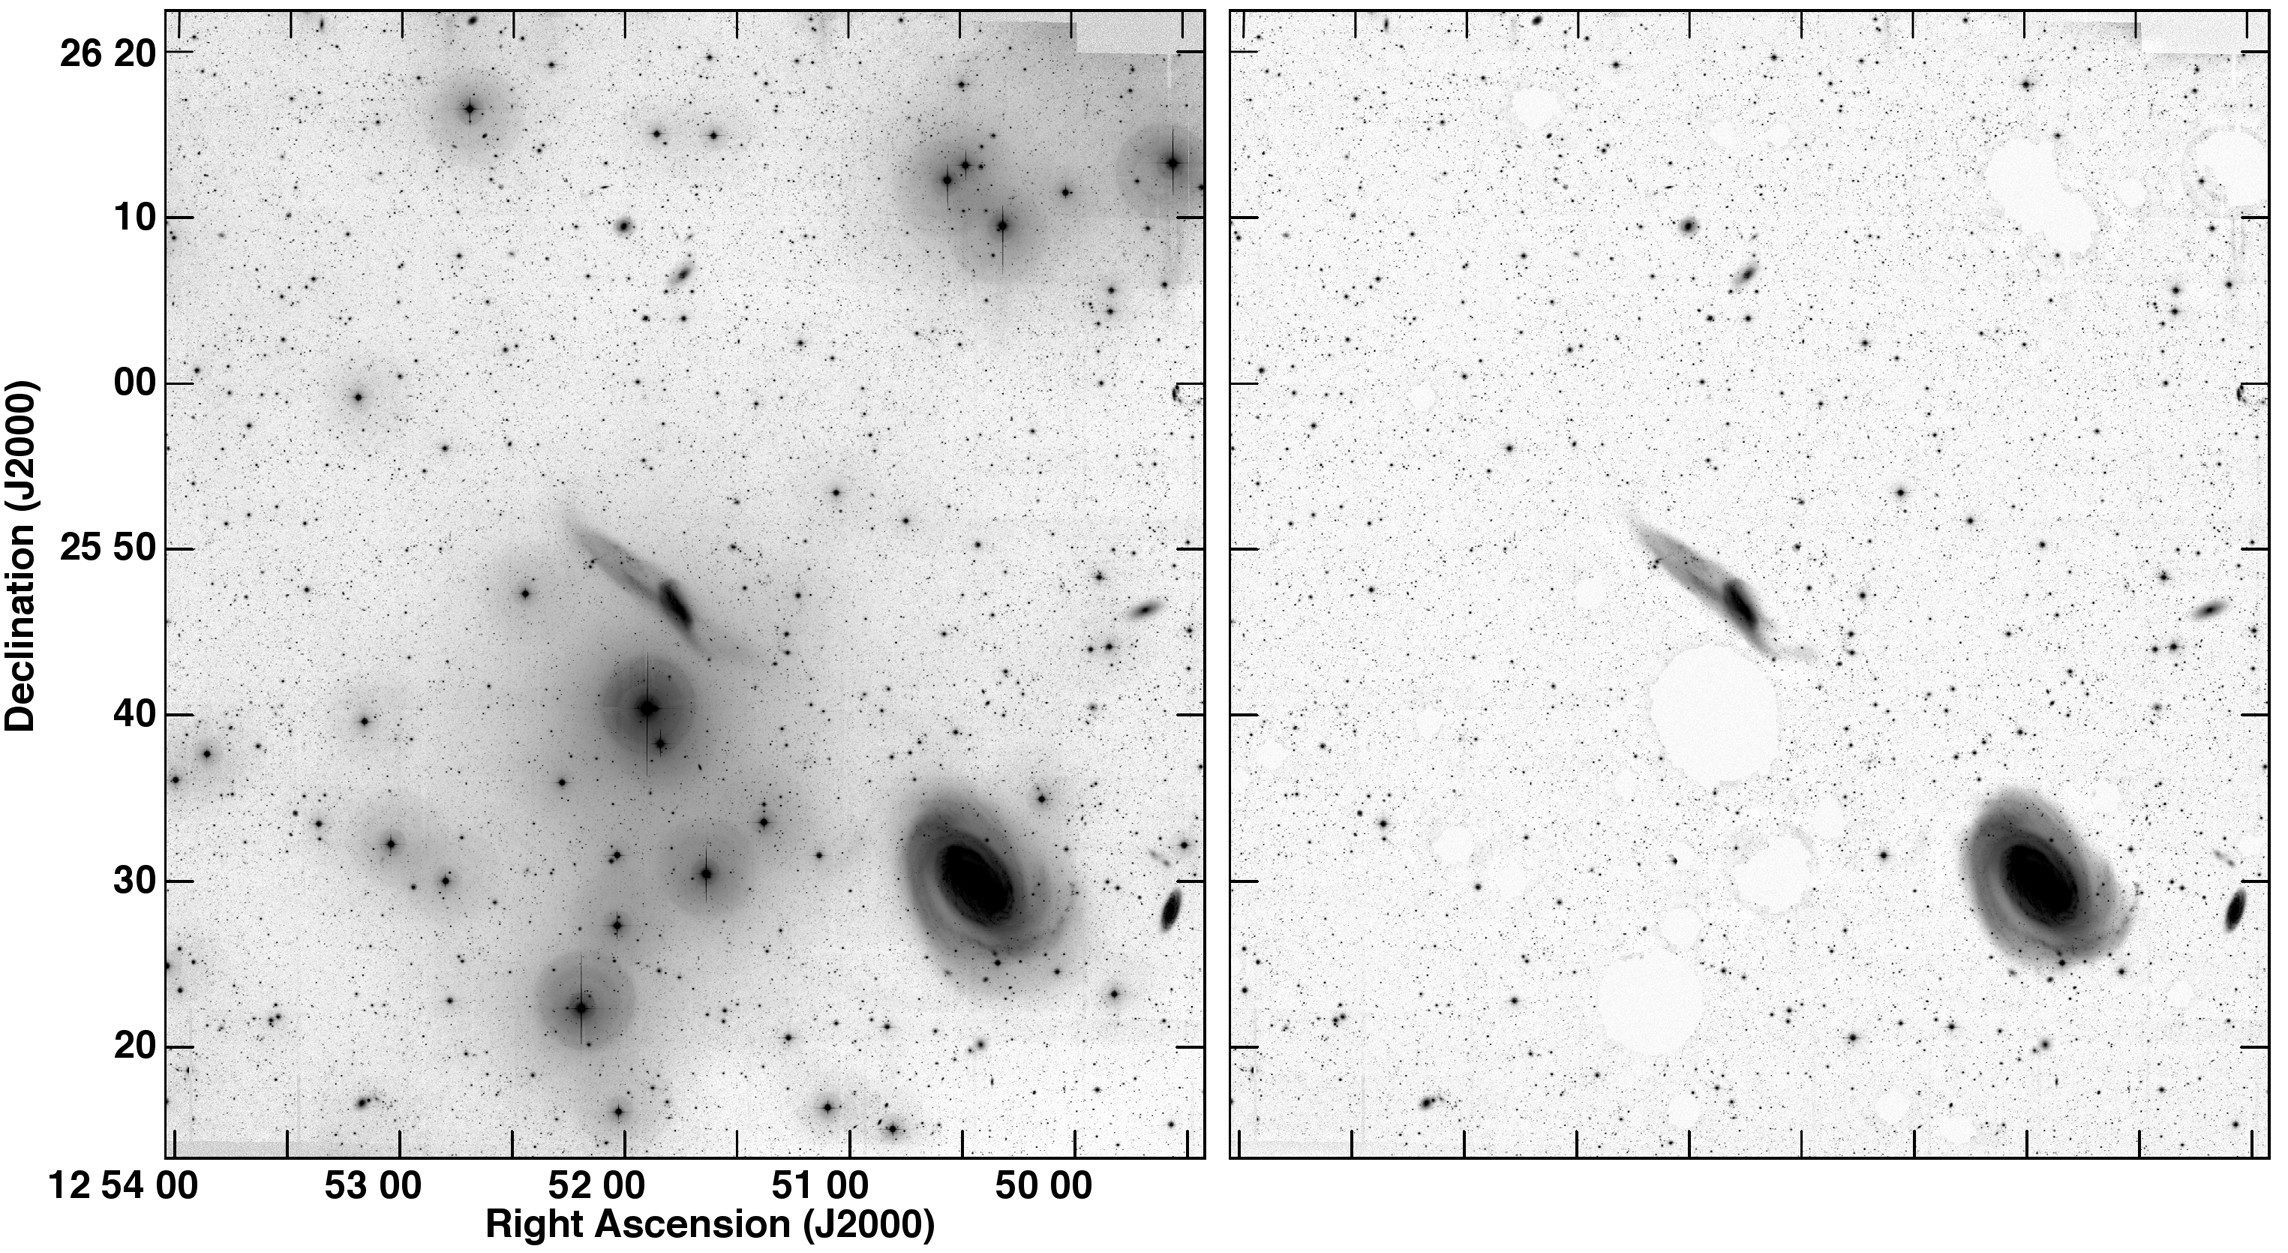
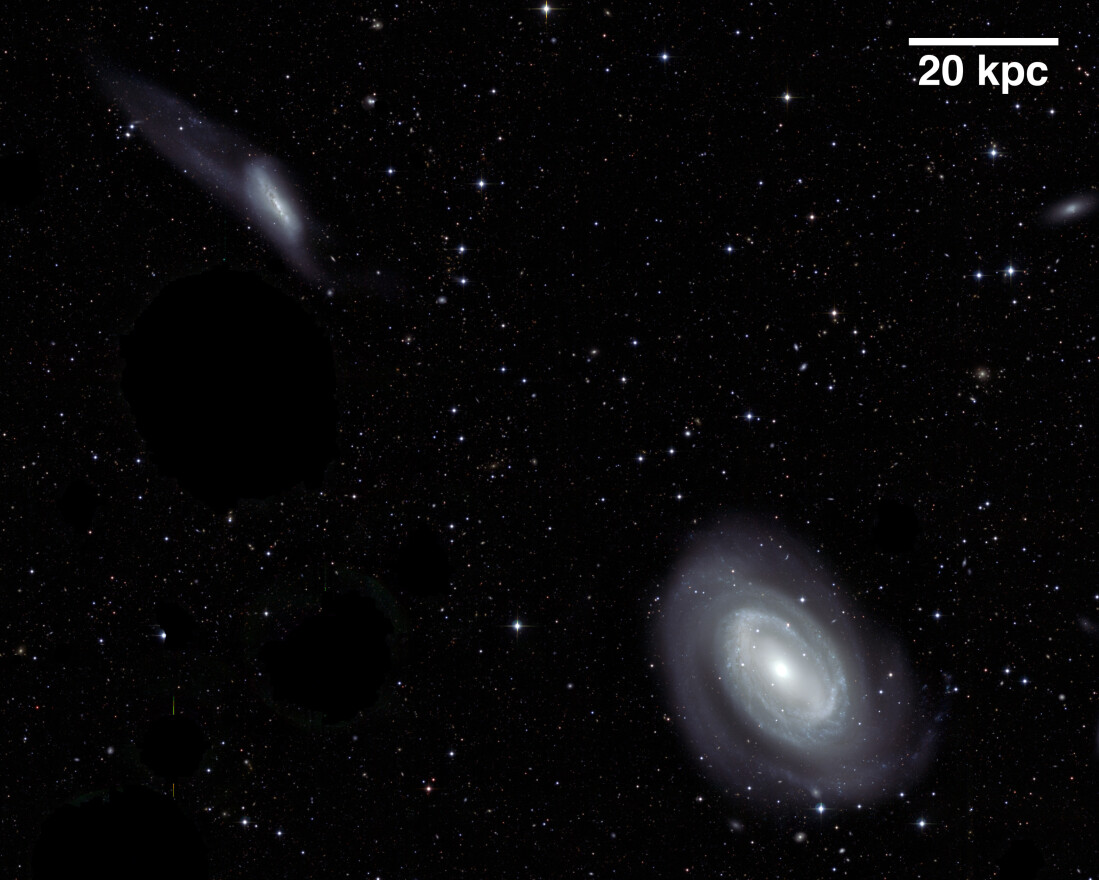
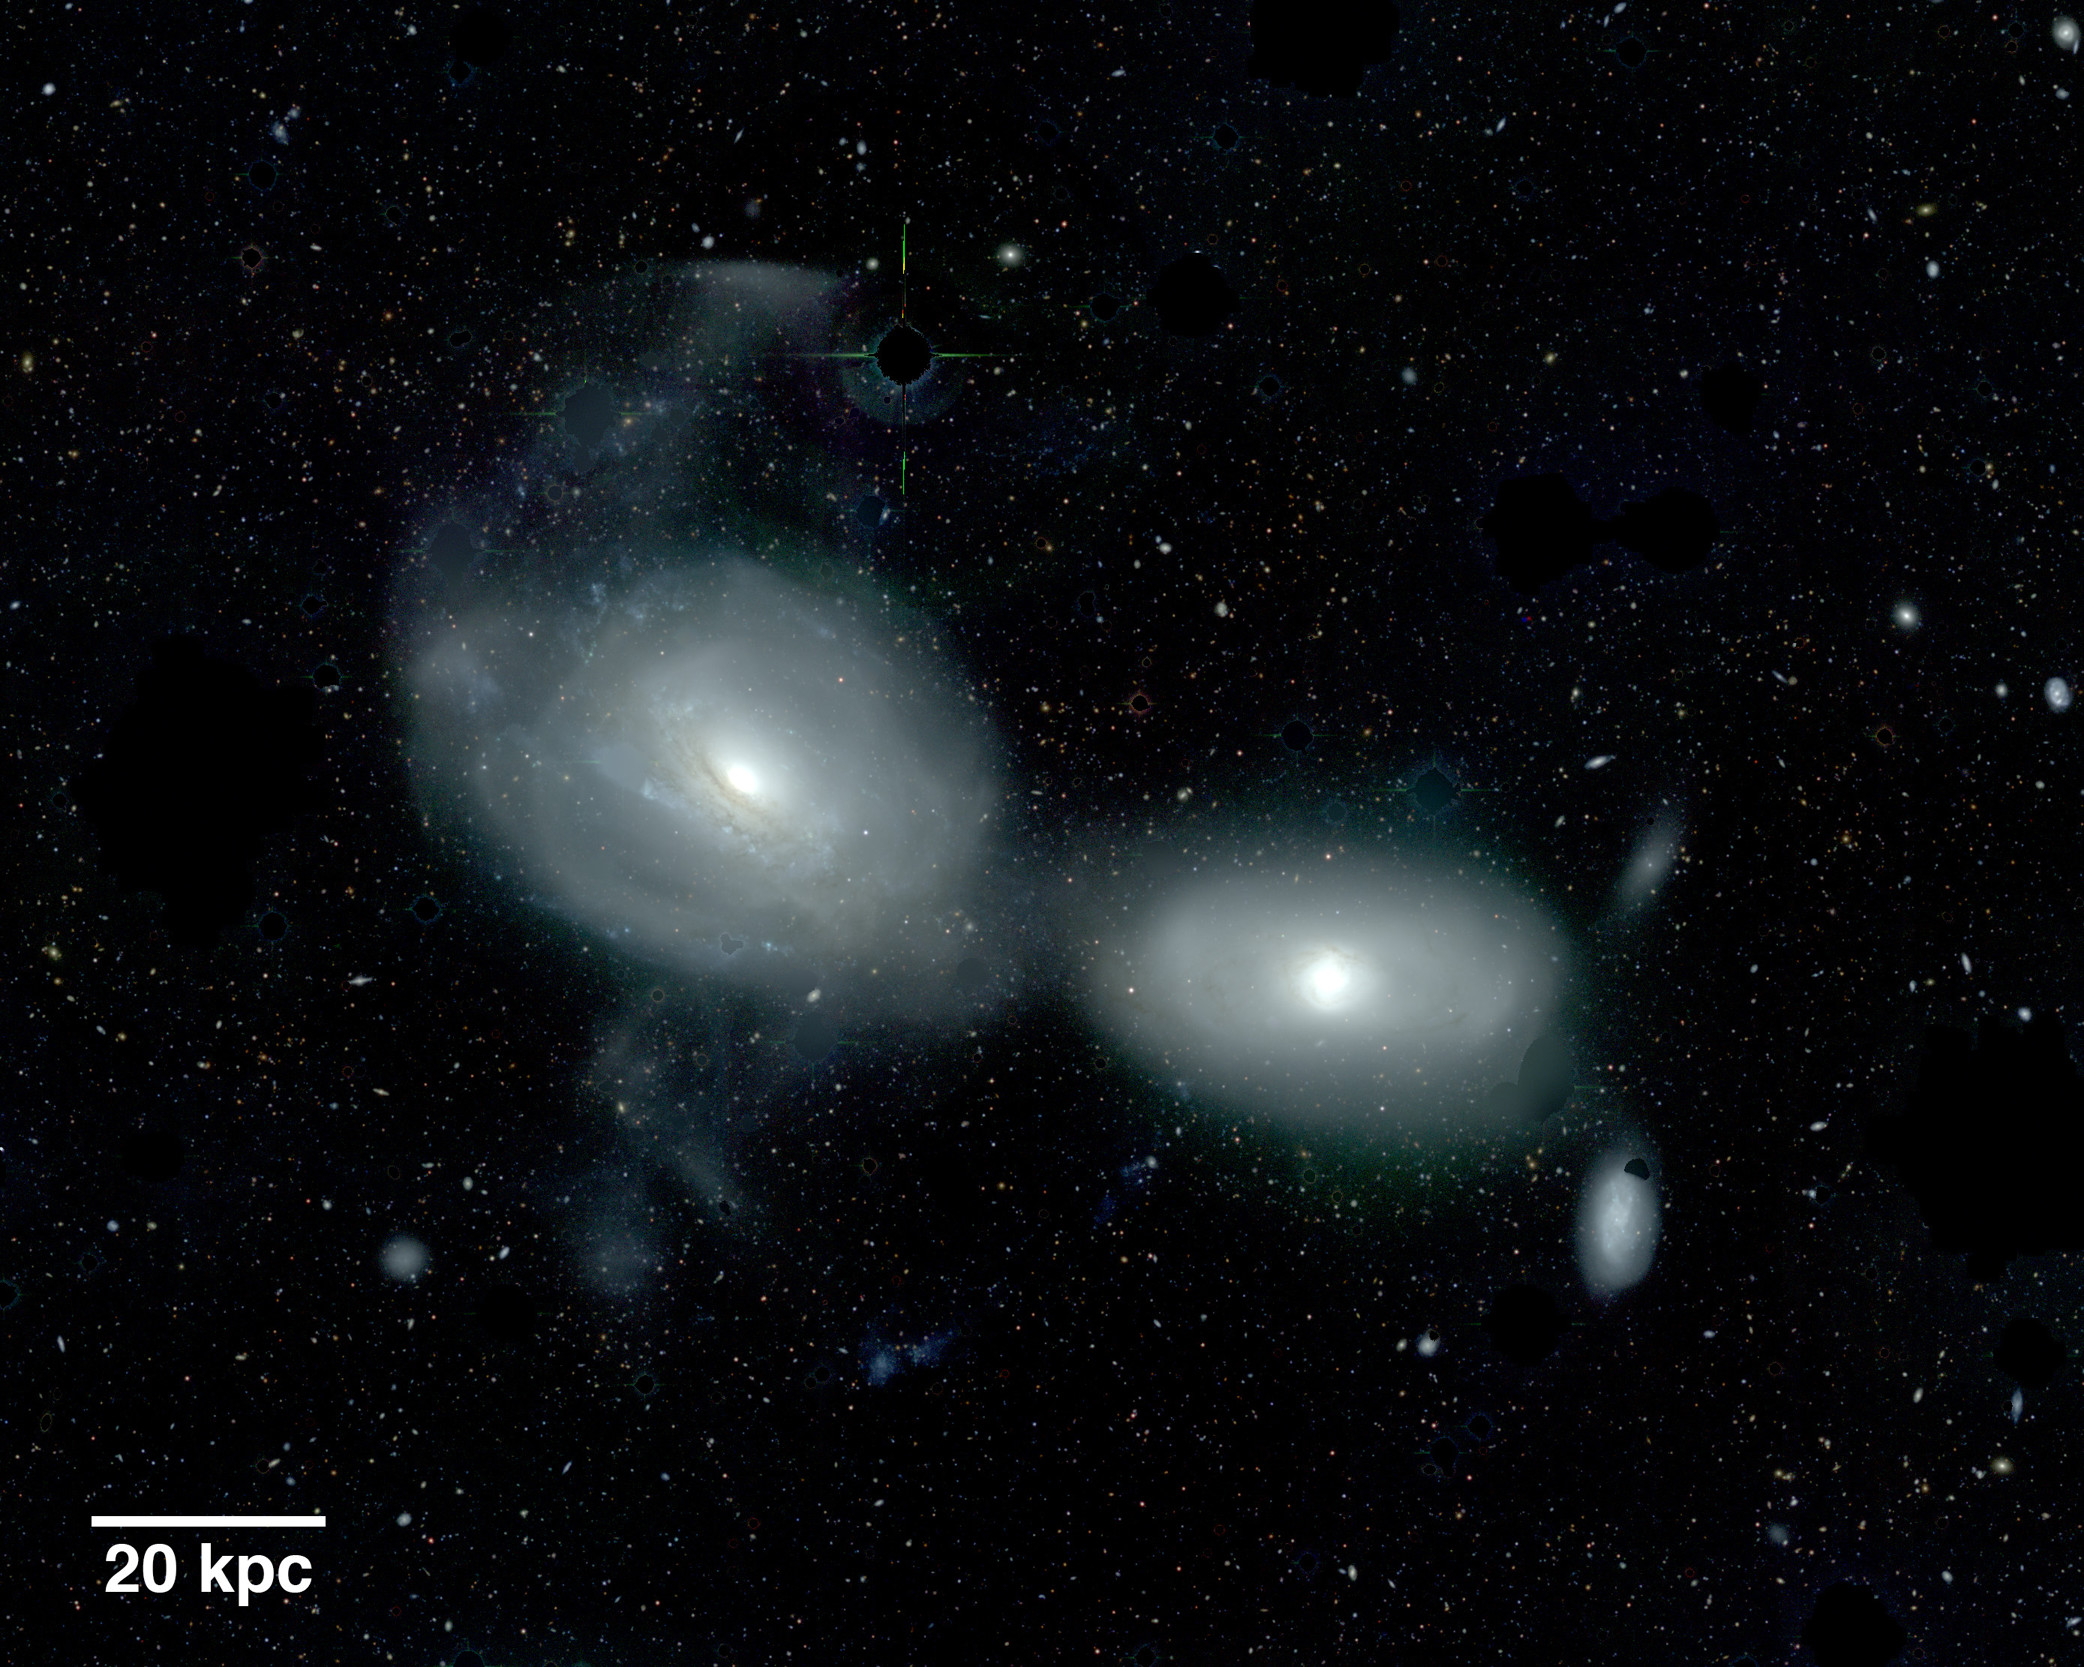
For both sets of photometric maps, bright foreground stars and their resultant reflection halos could not be excised by Elixir/Elixir-LSB and left artifacts in the optical images (see the left panel of Fig. 6). After additional background subtraction (using grid sampling measurements and interpolations to compute the background behind galaxies and key features) in each band, these bright stars and associated halos were modelled using a variable centre ring technique (see Wang et al. 2010) and then subtracted from the images. This grid sampling method produced a lattice of 7.5 7.5 arcmin regions that was utilized for local background estimates. After visual inspection, stellar spikes, saturated parts of stars and other noticeable artifacts were manually removed (see the right panel of Fig. 6). Any subtracted regions spatially coinciding with key features were filled-in using interpolations of the surrounding areas. Fig. 7 shows the fully processed -band composite images for the central regions of NGC 4725/47 and NGC 3166/9.
3.1 Optical and Ancillary Data Analysis: NGC 4725/47
GMRT mom0 contours superimposed on CFHT -band images, to show the spatial coincidence of gaseous and stellar components of the gas-rich group members, are presented in Fig. 8. There are two stellar knots — Stellar knot - 1 is located at 12 51 58.8, +25 49 33 (originally identified by Wevers et al. 1984) and the other fainter feature, Stellar knot - 2 is at 12 52 02.5, +25 50 13 — which appear to be within the NE stellar tail; however, these knots are offset from the Hi peaks, which could indicate a different evolutionary history for the stellar and gaseous tidal tails. It is also possible that the stellar knots are not physically associated with the tail (cf. Mirabel, Lutz & Maza 1991).
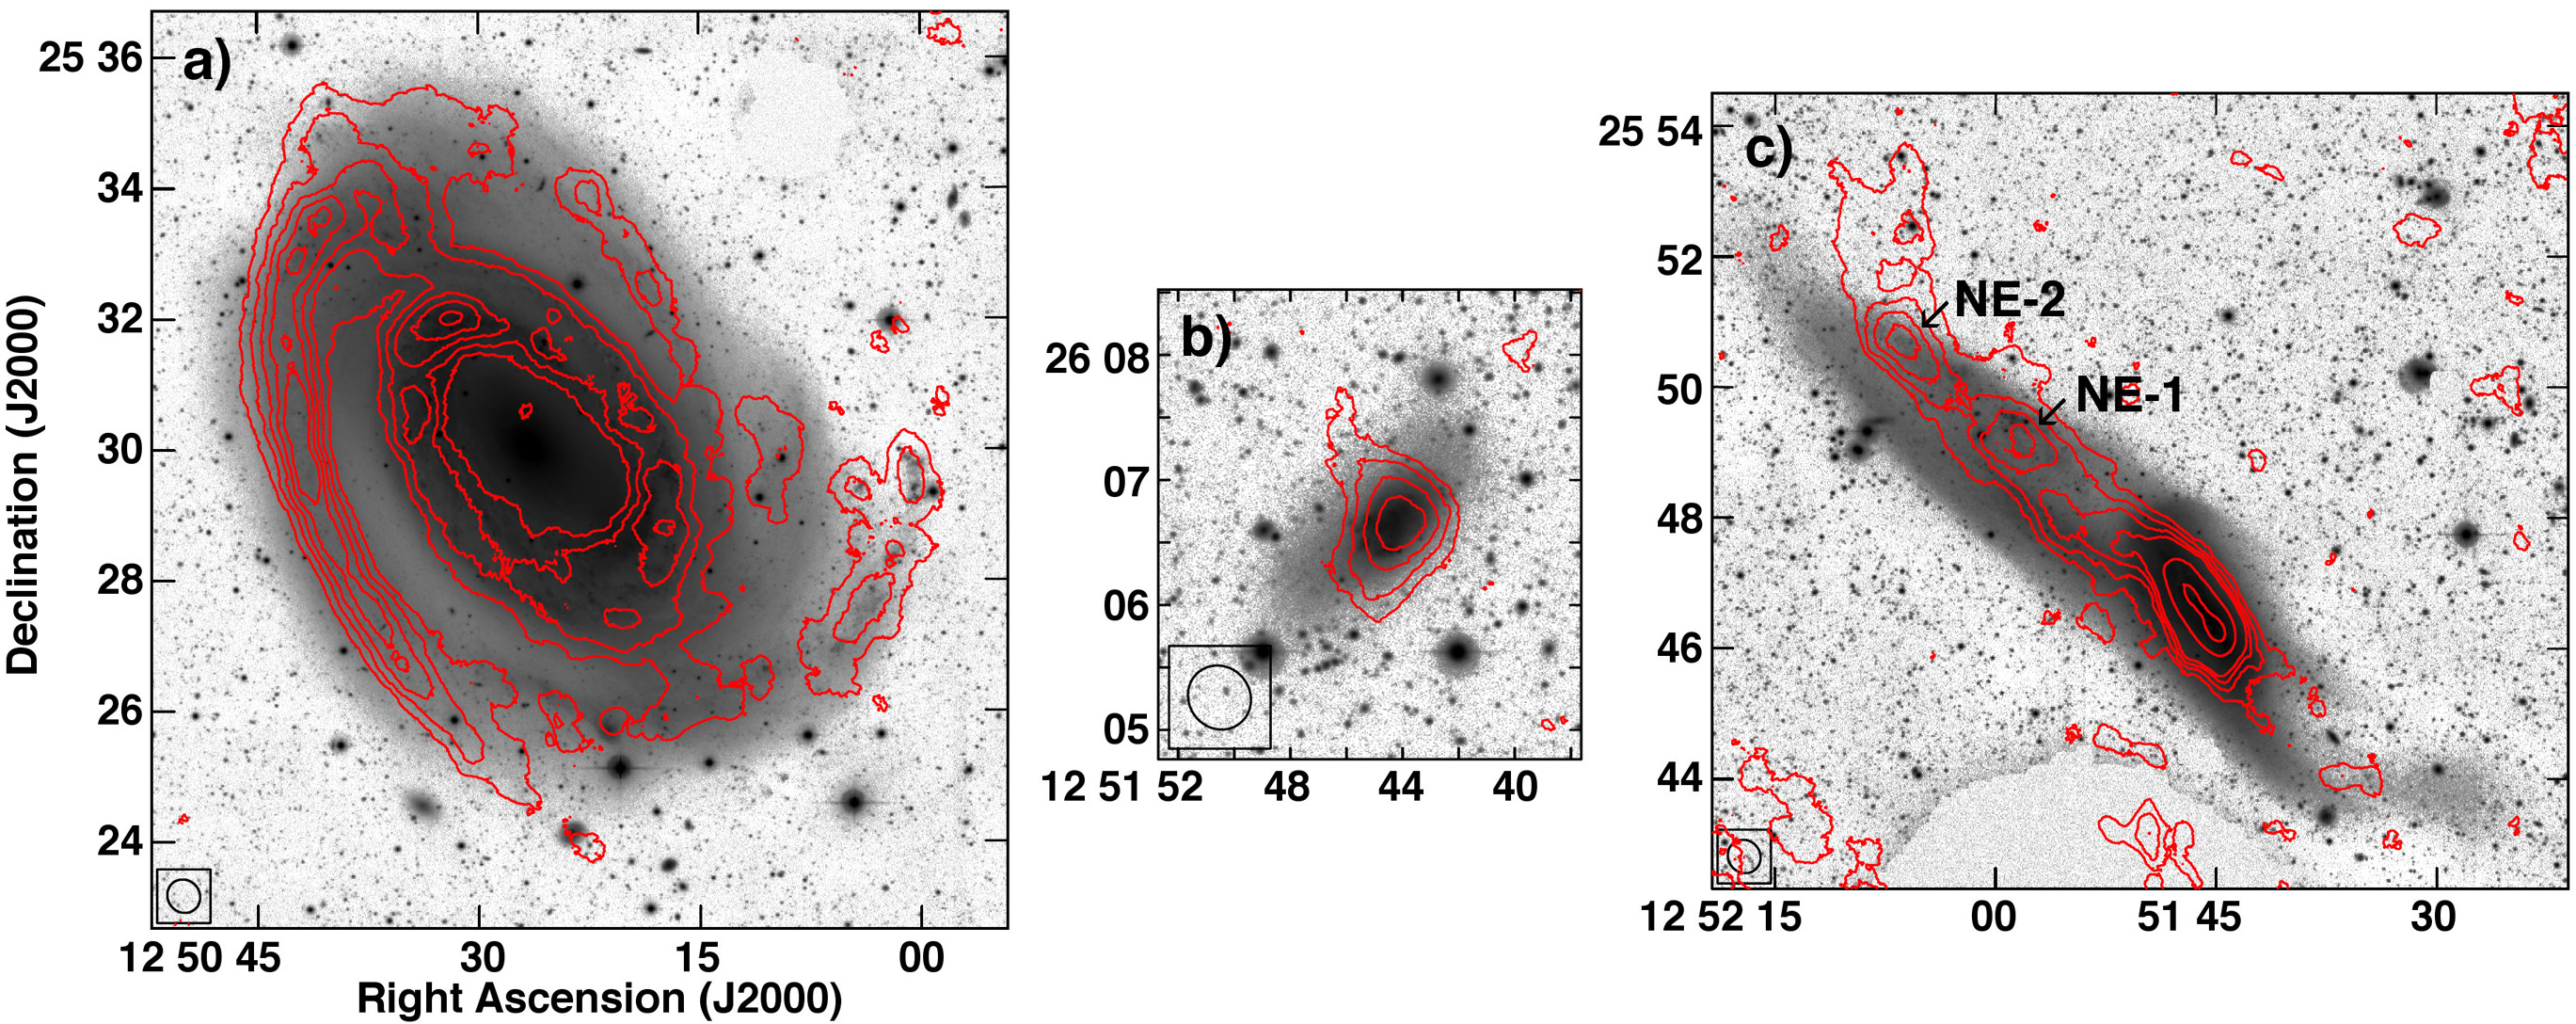
The optical magnitudes of NGC 4725 and KK 167 were measured using straight-forward aperture photometry. Detailed deblending was required to separate NGC 4747 from its stellar tails. The left panel of Fig. 9 shows the boundary of the individually measured features. For NE-1 and NE-2, their values were measured as the optical regions within the atoms cm-2 contour from the GMRT 30 arcsec angular resolution mom0 maps. The CFHT MegaCam magnitudes were then converted to more conventional SDSS AB magnitudes using standard equations provided by the CFHT.
The right panel of Fig. 9 shows the GMRT contours superimposed on a far-ultraviolet (FUV) image from the Galaxy Evolution Explorer (GALEX), obtained from the GR6/GR7 data release. It appears that the FUV tail aligns with the outer edge of the NE Hi tail, which is evidence for recent star formation activity (see Section 3.3). Stellar knot - 1 is quite bright in the FUV and its location (near an Hi peak and situated along the FUV tail) suggests that it is probably a star-forming region within the tail, which warrants future follow-up optical spectroscopy to confirm its distance. The optical and FUV images also indicate that what was once believed to be two stellar tails extending NE are likely a single bent tail (see Brinks, Duc & Walter 2004). This projection effect could imply an overestimate in the Hi masses presented in Table 2 for NE-1 and NE-2, which will be further discussed in Section 4.1.
In the same manner as presented in Paper 2, stellar masses, , were computed using:
| (3) |
where Mi is the absolute magnitude of each object in the -band (Taylor et al., 2011). This relation has been calibrated using an extensive census of galaxies with . The optical properties of the group members and features in NGC 4725/47 are listed in Table 5. Since NE-1 and NE-2 do not appear to have bound stellar counterparts, their masses are estimated as upper limits.
| Source | r50 | r90 | - | - | Mi | |||
|---|---|---|---|---|---|---|---|---|
| (arcsec) | (arcsec) | (arcsec) | (mag) | (mag) | (mag) | (mag) | () | |
| (1) | (2) | (3) | (4) | (5) | (6) | (7) | (8) | (9) |
| NGC 4725 | 376.4 | 201.5 | 473.0 | 9.6809 0.0001 | 0.697 0.009 | 1.001 0.009 | -21.9 0.8 | |
| KK 167 | 31.1 | 33.1 | 108.1 | 15.543 0.003 | 0.388 0.006 | 0.546 0.006 | -15.6 0.6 | |
| NGC 4747 | – | 78.0 | 145.8 | 12.6389 0.0004 | 0.519 0.008 | 0.769 0.005 | -18.7 0.7 | |
| NE-1 | – | – | – | 16.223 0.003 | 0.35 0.03 | 0.49 0.03 | -14.8 0.6 | |
| NE-2 | – | – | – | 17.155 0.005 | 0.35 0.01 | 0.50 0.01 | -13.9 0.5 | |
| SW tail | – | – | – | 15.986 0.003 | 0.53 0.03 | 0.84 0.03 | -15.4 0.6 | |
| NE tail | – | – | – | 13.994 0.001 | 0.443 0.004 | 0.634 0.004 | -17.2 0.7 | |
| Stellar knot - 1 | – | – | – | 17.232 0.004 | 0.305 0.005 | 0.423 0.007 | -13.8 0.5 | |
| Stellar knot - 2 | – | – | – | 17.752 0.006 | 0.308 0.008 | 0.46 0.01 | -13.3 0.5 |
3.2 Optical Analysis: NGC 3166/9
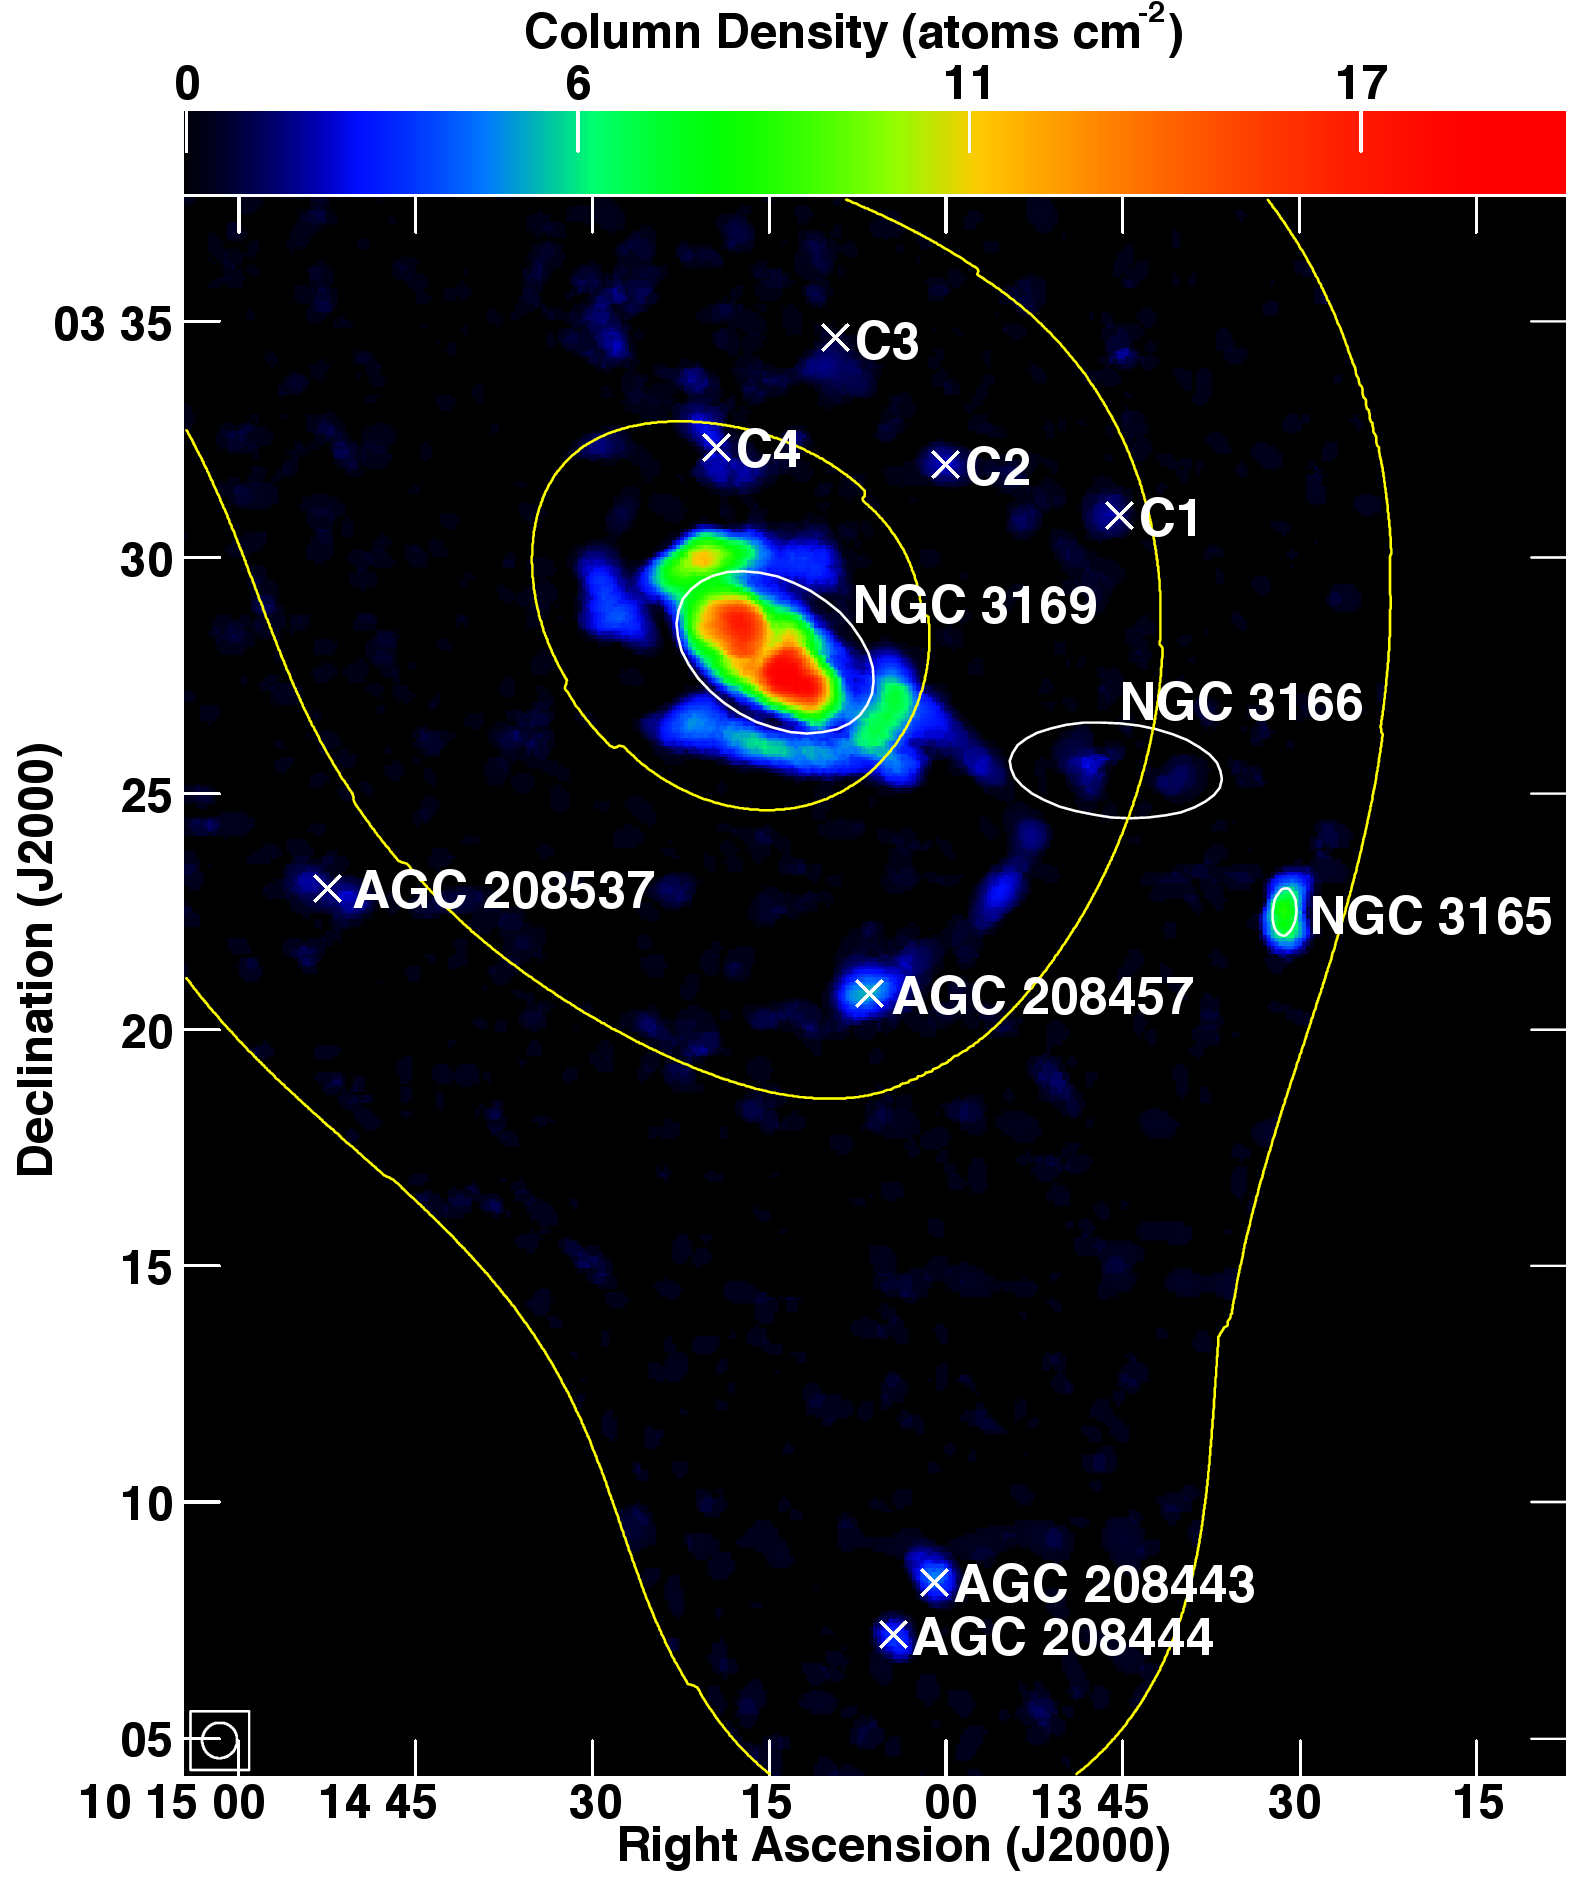
As originally discussed in Paper 1, eight low-mass Hi objects were detected in the GMRT observations of NGC 3166/9. An Hi map of this group is shown in Fig. 10 and preliminary properties of the group members are presented in Table 6. Based on our measurements in that paper, AGC 208537, AGC 208443 and AGC 208444 are likely classical dIrrs; the latter two galaxies appear to be interacting with each other while falling in towards the central region of the group. AGC 208457 is a putative TDG that has the hallmarks of a self-gravitating, dark matter poor, second-generation galaxy. The initial analysis of the properties of Hi knots C1 to C4 could not conclusively distinguish these object as either dIrrs or tidal knots, although their masses and locations imply the latter interpretation (see Paper 1 for further details).
GMRT mom0 contours superimposed on CFHT -band images, which are scaled to highlight any optical counterparts of the low-mass Hi detections, are shown in Fig. 11 (dIrrs and TDG candidate) and Fig. 12 (Hi knots C1 to C4). The reflection halo from a nearby bright star, HD 88725 (at 10 14 08, +03 09 04), could not be fully subtracted while preserving the optical counterparts of AGC 208443 and AGC 208444 and has left artifacts in the images (see Fig. 11a-b). Aperture photometry was utilized to measure the group members with spatially coincident stellar features. In order to minimize the flux contribution of the residual reflection halo around AGC 208443 and AGC 208444, apertures were manually fit for these two objects.
| Source | GMRT Coordinates | Classification | ||
|---|---|---|---|---|
| (J2000) | (km s-1) | () | Notes | |
| (1) | (2) | (3) | (4) | (5) |
| NGC 3165 | 10 13 31.0, +03 22 30 | 1324 3 | 1.8 0.3 | spiral: SAdm |
| NGC 3166 | 10 13 41.4, +03 24 44 | 1326 4 | – | spiral: SAB0 |
| C1 | 10 13 45.3, +03 30 53 | 1302 3 | 0.31 0.08 | Hi knot |
| C2 | 10 14 00.0, +03 31 58 | 1307 3 | 0.5 0.1 | Hi knot |
| AGC 208443 | 10 14 01.0, +03 08 18 | 1482 3 | 1.0 0.2 | in-falling dIrr |
| AGC 208444 | 10 14 04.5, +03 07 13 | 1488 3 | 0.7 0.1 | in-falling dIrr |
| AGC 208457 | 10 14 06.5, +03 20 47 | 1343 3 | 2.3 0.3 | TDG candidate |
| C3 | 10 14 10.0, +03 34 10 | 1110 3 | 0.5 0.1 | Hi knot |
| NGC 3169 | 10 14 15.0, +03 28 00 | 1248 3 | 42 5 | spiral: SAa |
| C4 | 10 14 20.4, +03 32 40 | 1028 3 | 0.35 0.08 | Hi knot |
| AGC 208537 | 10 14 52.5, +03 23 00 | 1182 3 | 0.6 0.1 | dIrr |
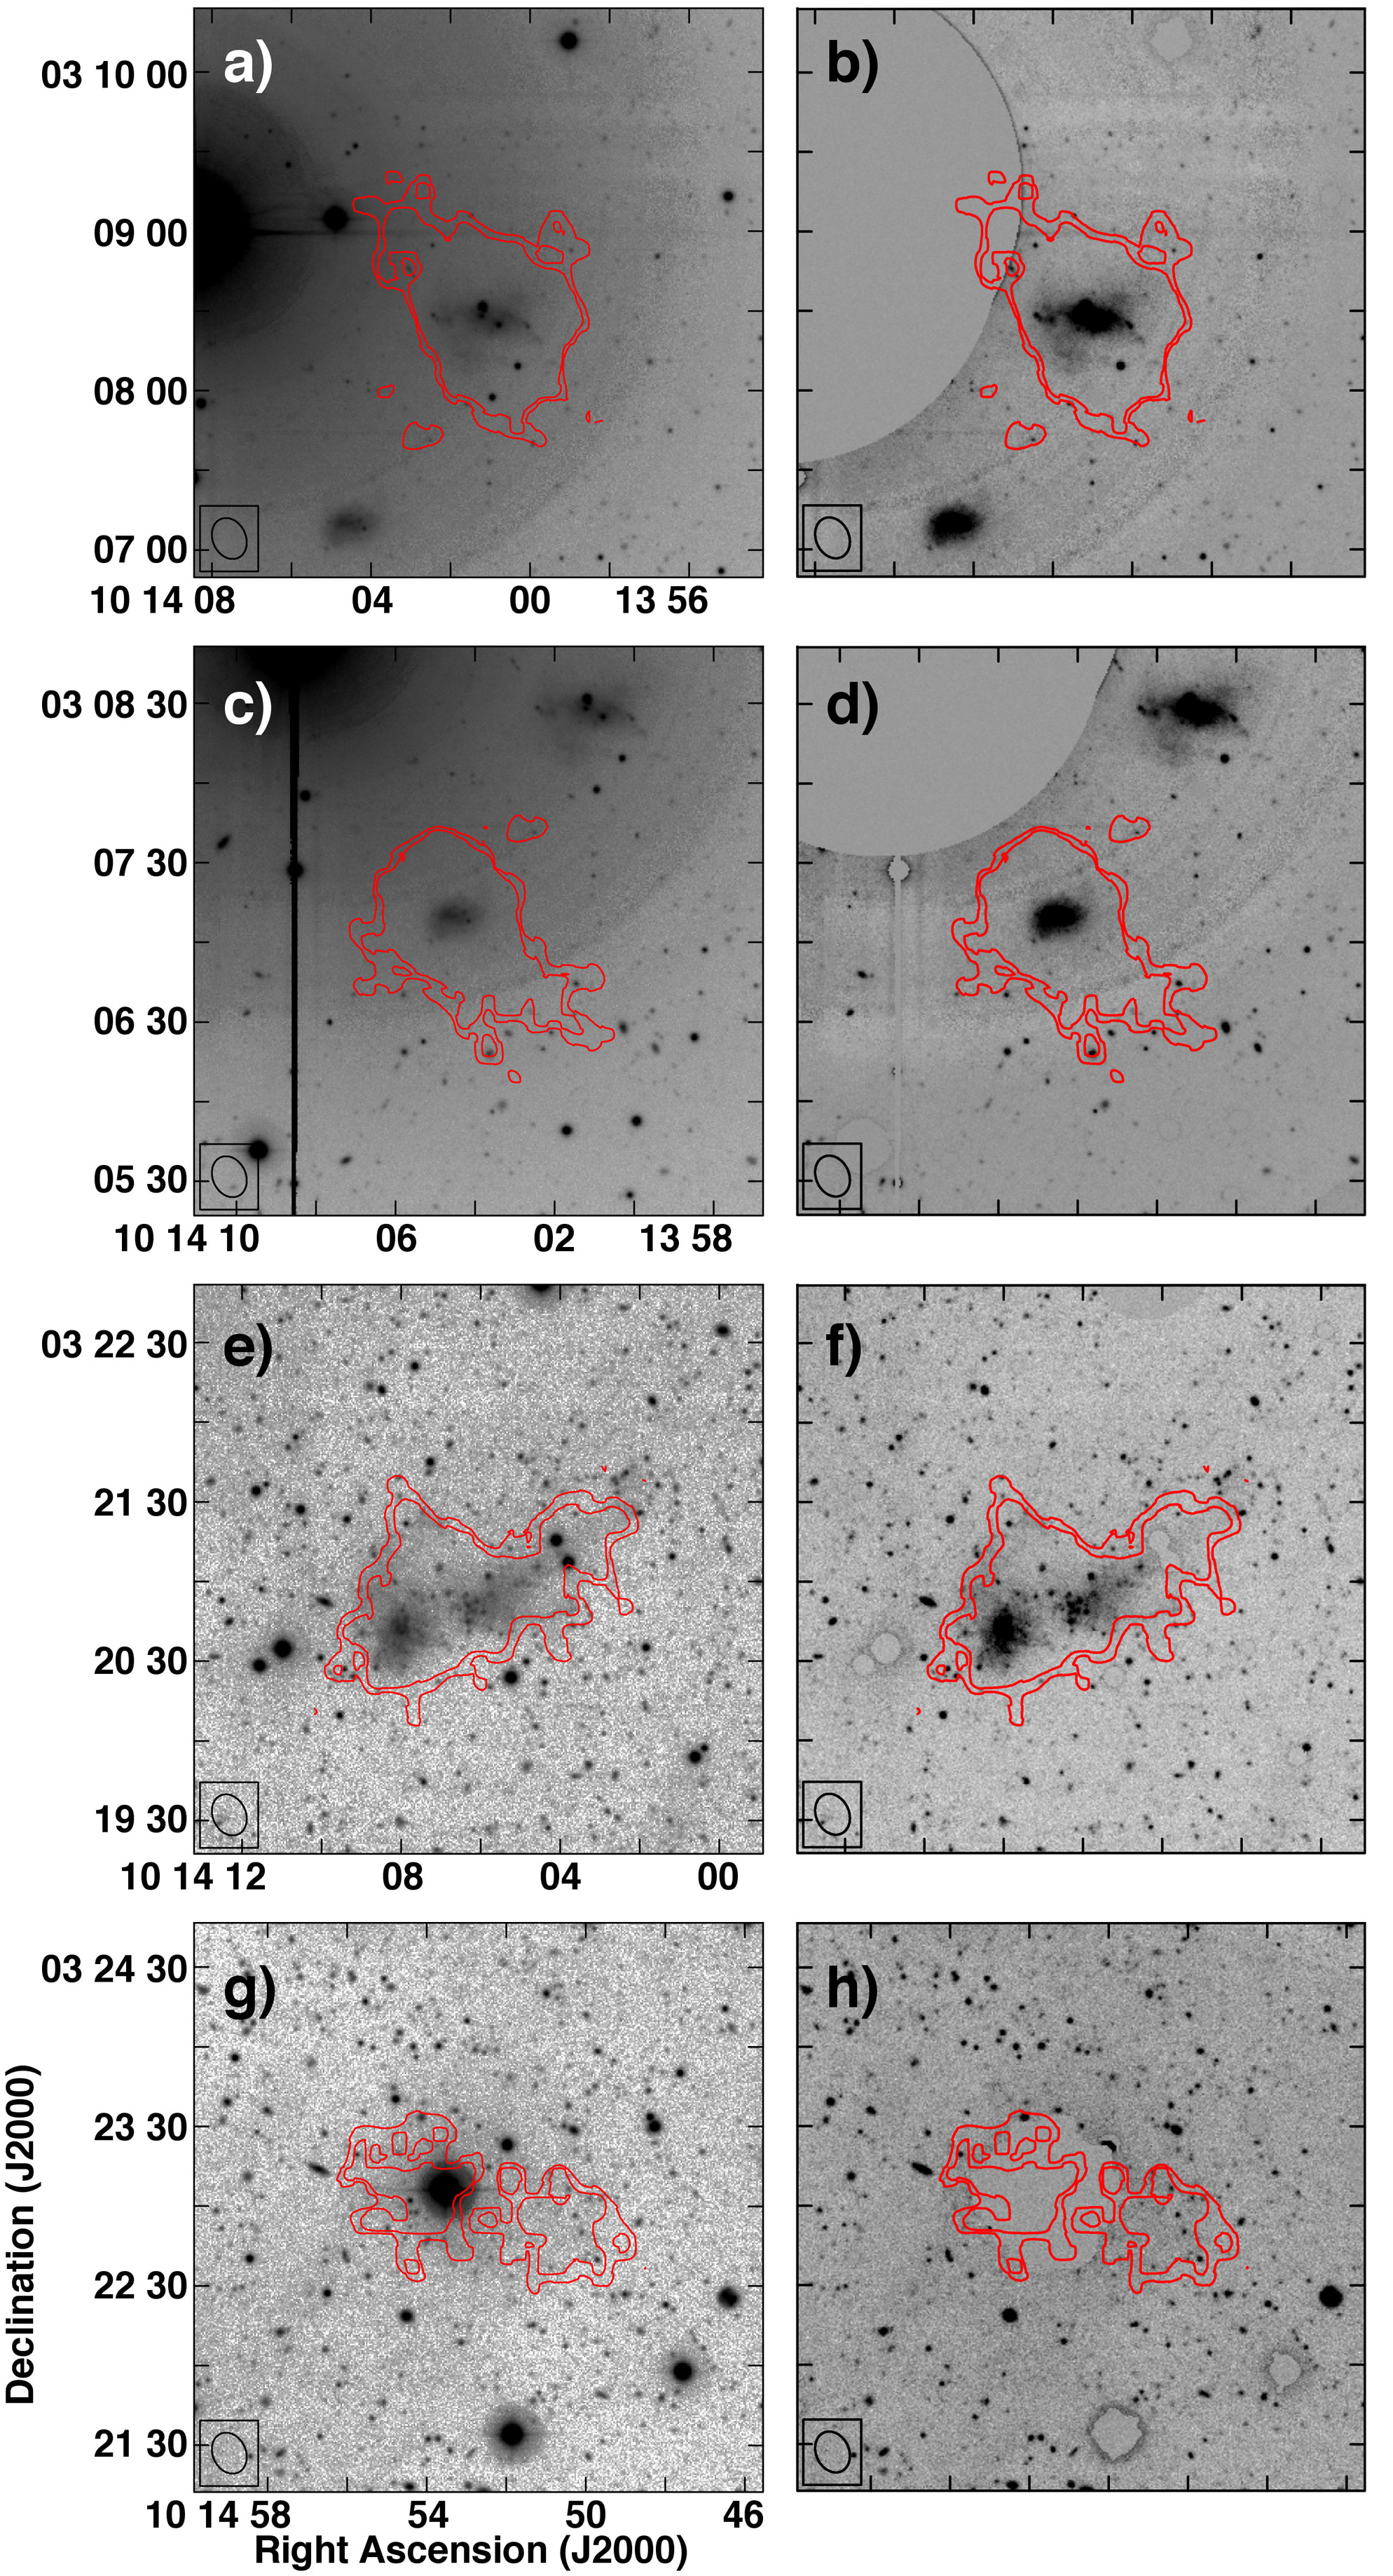
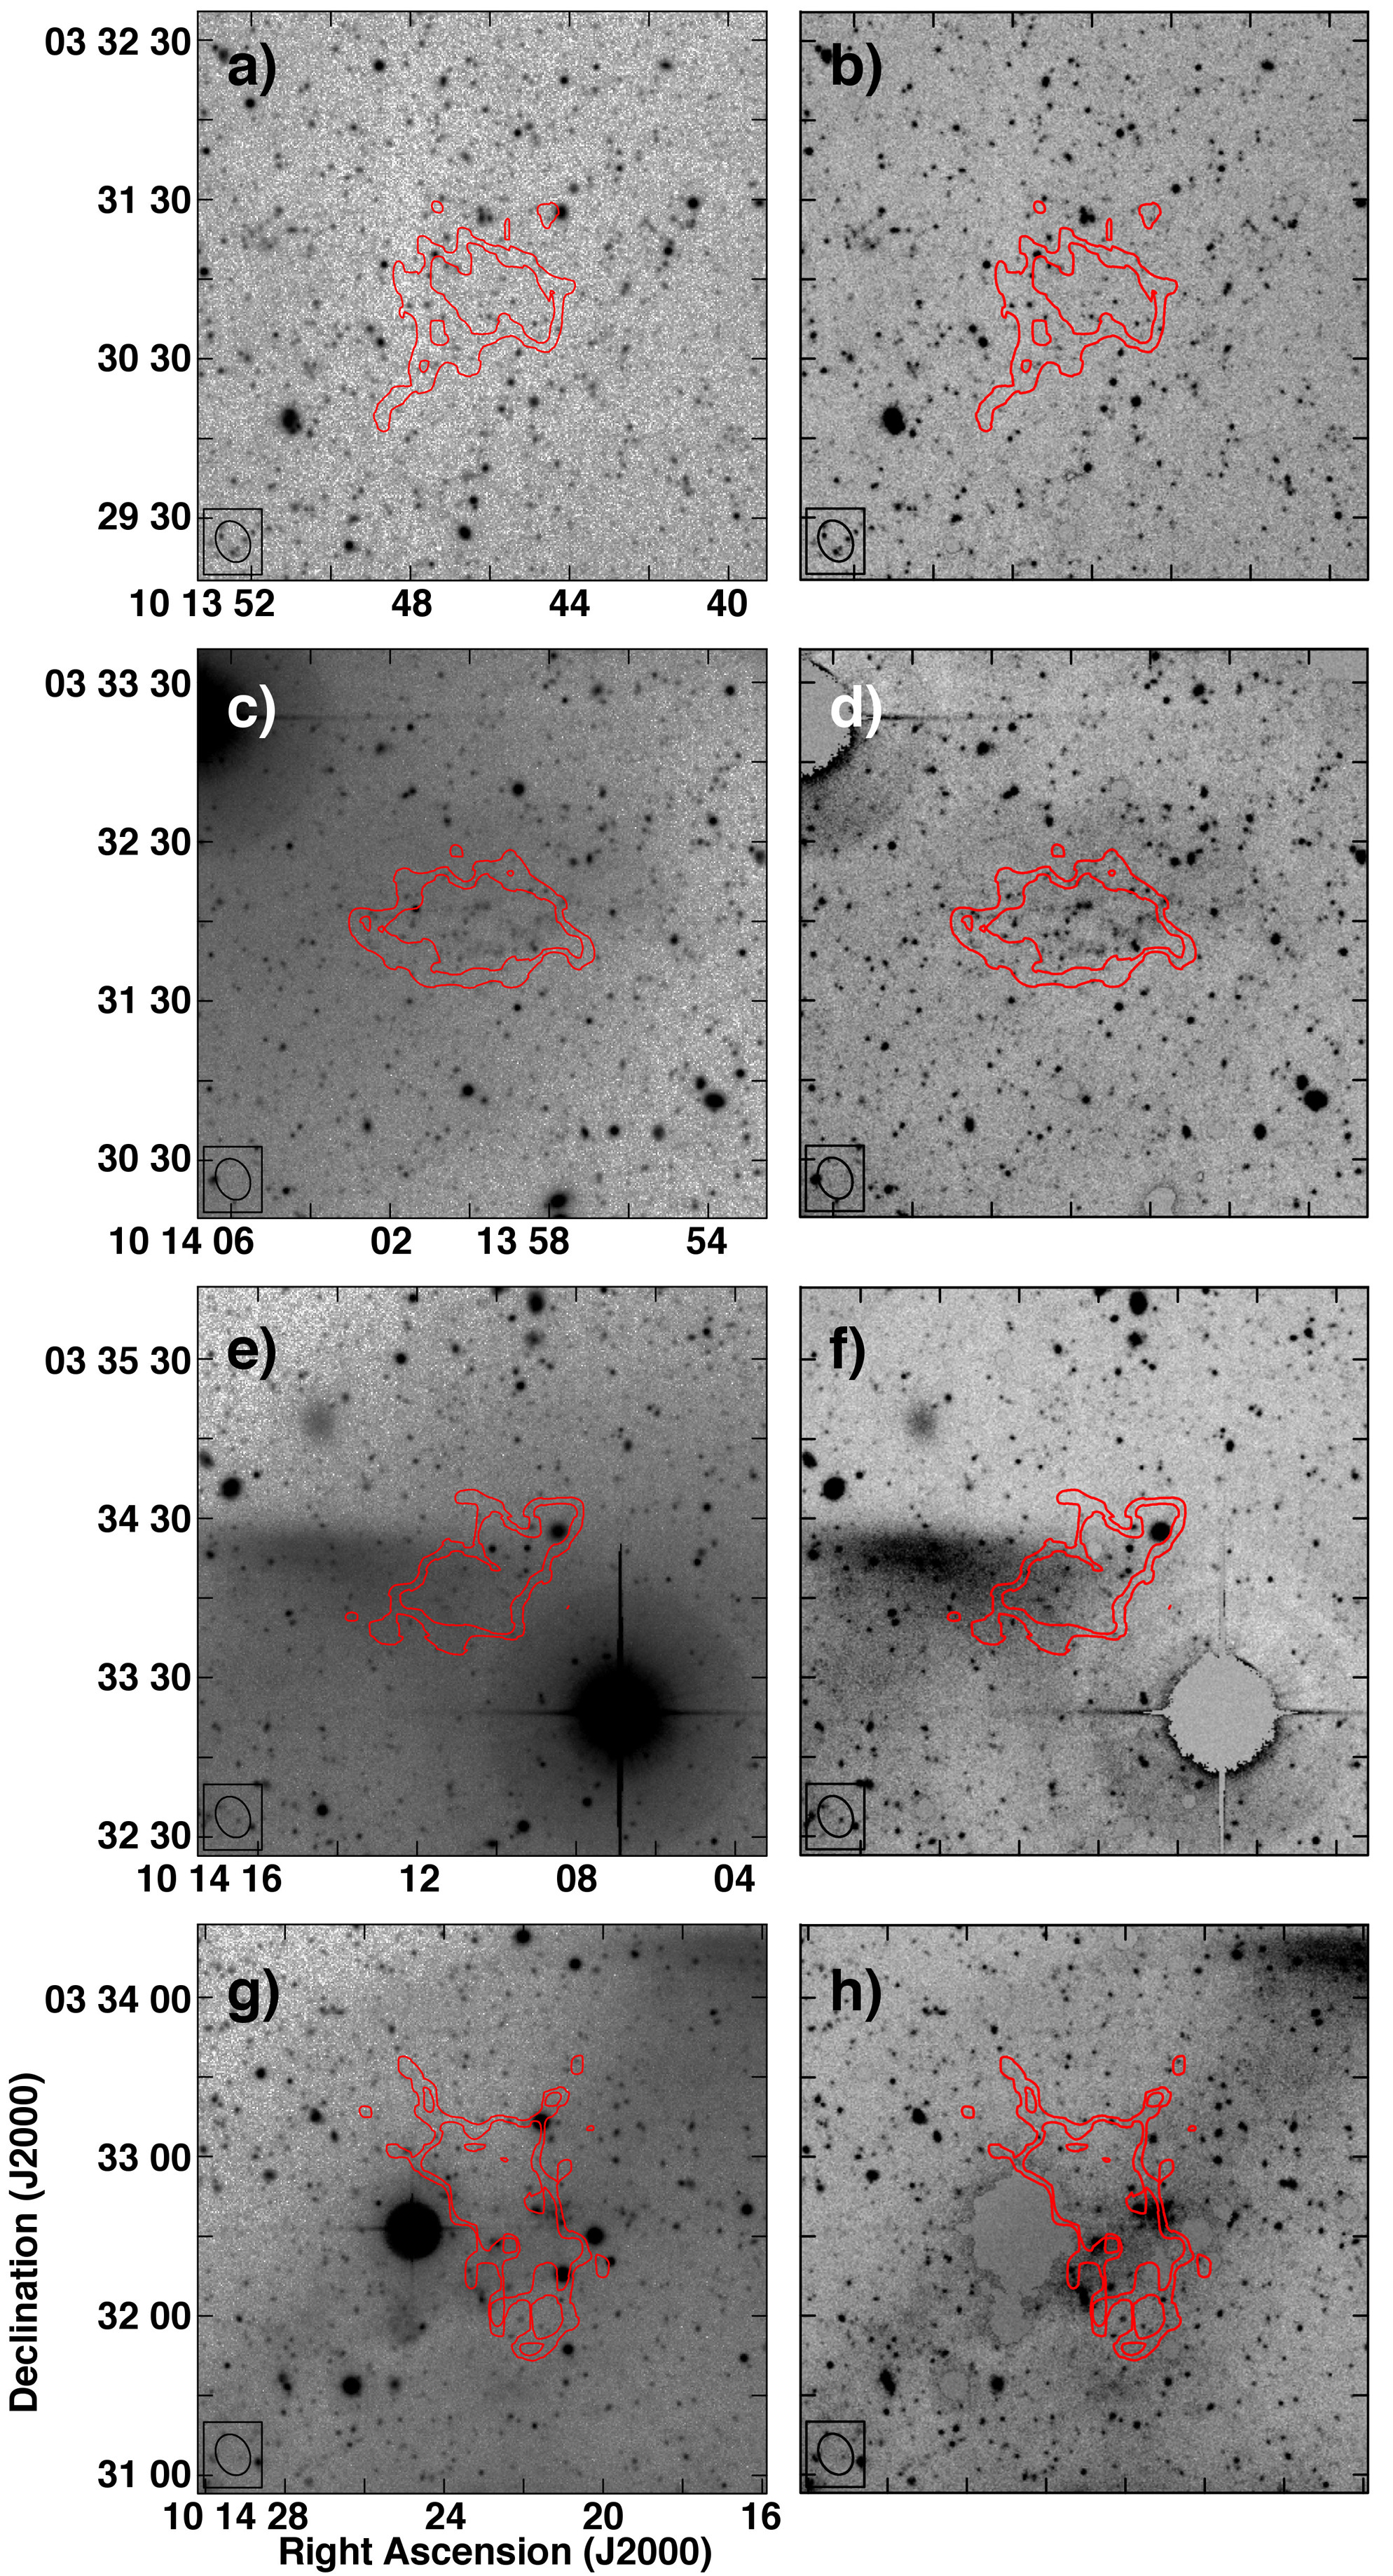
Even in the deep CFHT optical images, the low-mass Hi knots in NGC 3166/9 — i.e. C1 to C4 — do not have obvious bound optical counterparts (Fig. 12). There does seem to be an extremely faint stellar over-density that spatially coincides with C2 (see Fig. 12b) and C3 and C4 appear to lie on this stellar tail around NGC 3169, which likely has tidal origins; however, the magnitudes for the Hi knots were measured as the optical region within the atoms cm-2 contour of the GMRT 15 arcsec mom0 maps. The stellar masses for these knots are given as upper limits in Table 7, which presents the optical properties (with CFHT MegaCam magnitudes converted into SDSS AB magnitudes) of the group members. Note: AGC 208537 has been omitted from Table 7 as its Hi spatially coincides with a subtracted star, SDSS J101453.53+032305.9, which prohibits accurate measurements of an optical component (see Fig. 11h).
| Source | r50 | r90 | - | - | Mi | |||
|---|---|---|---|---|---|---|---|---|
| (arcsec) | (arcsec) | (arcsec) | (mag) | (mag) | (mag) | (mag) | () | |
| (1) | (2) | (3) | (4) | (5) | (6) | (7) | (8) | (9) |
| NGC 3165 | 42.7 | 16.6 | 34.1 | 14.2514 0.0009 | 0.472 0.003 | 0.705 0.008 | -18.2 0.2 | 8.6 0.1 |
| NGC 3166 | 162.7 | 26.4 | 107.2 | 10.8653 0.0002 | 0.744 0.009 | 1.143 0.009 | -22.1 0.3 | 590 10 |
| C1 | – | – | – | 20.1 0.3 | 1.4 0.5 | 1.3 0.5 | -13.0 0.3 | |
| C2 | – | – | – | 18.08 0.06 | 0.4 0.2 | 0.3 0.1 | -14.0 0.2 | |
| AGC 208443* | 16.4 | 11.2 | 22.8 | 16.69 0.03 | -0.22 0.03 | 0.10 0.03 | -15.2 0.2 | 0.20 0.06 |
| AGC 208444* | 11.4 | 8.9 | 17.0 | 17.57 0.02 | 0.47 0.03 | 0.39 0.04 | -14.6 0.2 | 0.18 0.02 |
| AGC 208457 | – | 23.9 | 47.8 | 17.95 0.04 | 0.28 0.06 | 0.49 0.05 | -14.3 0.2 | 0.16 0.02 |
| C3 | – | – | – | 17.9 0.1 | 1.4 0.2 | 1.4 0.2 | -15.2 0.2 | |
| NGC 3169 | 208.1 | 50.7 | 149.0 | 10.7038 0.0002 | 0.758 0.002 | 1.126 0.002 | -22.2 0.3 | 650 10 |
| C4 | – | – | – | 17.292 0.007 | 0.613 0.009 | 0.93 0.02 | -15.4 0.2 |
3.3 Stellar Population Analysis
Following a similar method to that utilized in Paper 2 to estimate the age of the optical counterpart to each group member, - and - colours were compared to the Bruzual & Charlot (2003) stellar population models. These models assume two separate initial mass functions (IMFs; i.e. Chabrier 2003 and Salpeter 1955) and use various spectral libraries covering a range of ages ( to yr) and metallicities (0.0001 0.05). Ideally, the pair of colours for each detection would correspond to a single population of stars; however, without detailed metallicity information to constrain the stellar models, significant degeneracies exist. The range of ages reported for each feature encompasses all the models that are consistent with the - and - colours in the metallicity range given above.
Table 8 summarizes the dynamical and stellar properties of the group members and features in NGC 4725/47 and NGC 3166/9. We note the large range of ages possible for NGC 4747 given its colours. This range reflects the strong dependence of age on metallicity for this object. For example, if this galaxy has a metallicity of = 0.0001, its age would be 11.8 - 12.0 Gyr for a Salpeter IMF; however, if its metallicity is closer to solar ( = 0.02), then its age would be between Gyr. The constraints on the other group members are somewhat better, allowing us to gain some insight by comparing their relative ages (see Section 4).
Several low-mass object in NGC 3166/9 did not fit the stellar models due to contamination issues from foreground stars (i.e. ACG 208443, AGC 208444 and AGC 208537) or because we are working with upper limits from undetected optical counterparts (i.e. C1 and C3). The total gas mass, , for each detection was computed by multiplying by a factor of 1.33 to account for helium and other elements. This value was added to to find the total baryonic mass, , for each group member.
We note that, although for classical dIrrs is generally dominated by atomic gas, TDGs have been shown to contain an average molecular gas mass of (Braine et al., 2001). More evolved TDGs appear to have higher ratios than those embedded within tidal tails (Braine et al., 2001). Since the Hi knots in NGC 3166/9 and NGC 4725/47 appear to be associated with tidal tails, the molecular gas in these objects is likely low, , which is comparable to the uncertainties for . We therefore do not include a contribution from molecular gas in the estimates.
All dynamical masses have been computed under the assumption that each detection is self-gravitating in dynamical equilibrium, which is probably inaccurate for some of the objects as indicated by the values in brackets (see Section 4 for further details). For the gas-rich objects with no clearly visible bound optical component, upper limits were estimated by measuring the background surface brightness level and/or diffuse stellar region within the atoms cm-2 Hi contours.
Similar to Papers 1 and 2, the luminosity — in erg s-1 Hz-1 — for each group member was measured from archival GALEX FUV data to estimate SFRs using:
| (4) |
(Kennicutt 1998, Hunter, Elmegreen & Ludka 2010). No additional corrections have been made to account for dust. Gas-rich objects with no discernible FUV counterpart have upper limit SFR estimates based on the background noise.
| Source | Age - IMFC | Age - IMFS | SFRFUV | |||||
| () | () | () | ( yr) | ( yr) | ( yr-1) | |||
| (1) | (2) | (3) | (4) | (5) | (6) | (7) | (8) | (9) |
| NGC 4725/47: | ||||||||
| NGC 4725 | 39 8 | 440 20 | 130 30 | 11 1 | 26 3 | 13.3 - 13.8 | 9.5 - 9.8 | 0.58 0.02 |
| KK 167 | 0.9 0.5 | 1.5 0.6 | 8 4 | 5 2 | 8 1 | 0.9 - 3.5 | 0.64 - 1.4 | 0.010 0.001 |
| NGC 4747 | 13 3 | 27 3 | 12 3 | 6 1 | 12 2 | 1.1 - 7.3 | 1.1 - 12.0 | 0.052 0.002 |
| NE-1 | 1.2 0.4 | [4 1] | [] | [] | 0.57 - 2.3 | 0.57 - 1.8 | 0.0014 0.0007 | |
| NE-2 | 1.4 0.4 | [4 2] | [] | [] | 0.57 - 2.2 | 0.8 - 1.8 | 0.0007 0.0001 | |
| SW tail | – | – | – | – | – | 1.3 - 1.6 | 1.3 - 1.6 | 0.003 0.001 |
| NE tail | – | – | – | – | – | 1.0 - 2.5 | 1.1 - 3.0 | 0.014 0.002 |
| Stellar knot - 1 | – | – | – | – | – | 0.51 - 1.3 | 0.004 - 0.51 | 0.0023 0.0004 |
| Stellar knot - 2 | – | – | – | – | – | 0.006 - 1.9 | 0.51 - 1.8 | 0.0005 0.0002 |
| NGC 3166/9: | ||||||||
| NGC 3165 | 2.3 4 | 11 1 | 33 6 | 7 1 | 8.8 0.6 | 11.3 - 11.5 | 7.5 - 8.0 | 0.060 0.001 |
| NGC 3166 | – | 590 10 | – | – | – | 4.0 | 5.0 | 0.06 0.01 |
| C1 | 0.4 0.1 | [6 3] | [] | [] | – | – | ||
| C2 | 0.6 0.1 | [5 2] | [] | [] | 0.004 - 1.9 | 0.004 - 1.8 | ||
| AGC 208443 | 1.4 0.2 | 1.6 0.3 | 10 3 | 9 2 | 15 3 | – | – | 0.015 0.001 |
| AGC 208444 | 0.9 0.2 | 1.1 0.2 | 10 3 | 8 3 | 21 5 | – | – | 0.004 0.001 |
| AGC 208457 | 3.1 0.4 | 3.2 0.4 | 1.5 0.4 | 1.4 0.4 | 15 4 | 0.006 - 2.6 | 0.006 - 2.2 | 0.008 0.001 |
| C3 | 0.7 0.2 | [4 2] | [] | [] | – | – | ||
| NGC 3169 | 56 7 | 710 20 | 54 8 | 4.3 0.3 | 13 1 | 7.0 - 11.8 | 10.0 - 11.5 | 0.56 0.03 |
| C4 | 0.5 0.1 | [19 8] | [] | [] | 2.1 - 2.4 | 2.1 - 2.3 | ||
| AGC 208537 | 0.9 0.1 | 5 1 | – | – | – | – | – | |
4 Results: Low-mass galaxy populations in NGC 4725/47 and NGC 3166/9
We have presented high-resolution Hi observations from the GMRT and deep optical imaging from the CFHT MegaCam of two nearby gas-rich groups in our small survey. Including NGC 871/6/7, which was analyzed in depth in Paper 2, each group in this study contains two interacting spiral galaxies and at least one probable tidal object. Individually, the low-mass objects in these galaxy groups offer information about the evolutionary history of their respective groups. This section focusses on the nature of the low-mass galaxies in the NGC 4725/47 and NGC 3166/9 groups.
4.1 NGC 4725/47
The GMRT observations reveal that NGC 4725/47 is host to two probable tidal knots (NE-1 and NE-2) and one gas-rich dwarf galaxy (KK 167). Both knots, which are fully contained within a gaseous tail presumed to have been produced as a result of a recent tidal interaction event, appear to have sufficient mass ( 108 ) to evolve into long-lived TDGs according to numerical simulations (e.g. Bournaud & Duc 2006). Nevertheless, NE-1 is located closer to NGC 4747 than NE-2 — with separation distances of 4 arcmin (15 kpc) and 7 arcmin (25 kpc), respectively, from the centre of the host spiral — causing the former to have a higher likelihood of succumbing to the gravity of its parent galaxy. We note that NE-1 and NE-2 are unlikely to be self-gravitating and therefore their values of (and ) may have little meaning.
Fig. 8c shows that neither NE-1 nor NE-2 has a clearly bound stellar counterpart, despite the fact that the gas-rich tail is situated along a prominent stellar tail. This lack of stars could indicate that the Hi tail is fairly young, since significant star formation in a tidal feature typically begins 20 Myr after being triggered by an interaction event (Kaviraj et al., 2012). Nevertheless, the age ranges estimated for the NE and SW tails do indicate that an interaction likely occurred Gyr ago, which is sufficient time for Hi knots to begin forming stars. Additionally, the FUV component of the NE tail traces the lowest contour of the Hi distribution, as illustrated in right panel of Fig. 9, and indicates active star formation along the edges of the Hi feature, which introduces further complexity. It is likely that the NE tail is one physical feature and its bifurcated appearance on the sky (in previous optical and UV imaging) is the result of projection effects, similar to the tidal tail presented in Brinks et al. (2004); however, our observations are unable to disentangle the exact geometry of this feature.
If there is an overlap of the tidal tails along the line of sight, then the sizes and Hi masses for NE-1 and NE-2 could be overestimated, since they could be composed of distinct smaller clouds in the superimposed tails. These two tidal knots would then be less likely to have bound stellar components and evolve into long-lived TDGs. We note that while this scenario is a possibility, we find no spectral evidence for distinct clumps along the same line-of-sight (Fig. 5). Moreover, the Hi mass of the tail measured by ALFALFA well exceeds the mass of NE-1 and NE-2 recovered by the GMRT. Ignoring possible projection effects, this excess suggests that these knots could continue to accrete significant amounts gas from the tail. If NE-1 and NE-2 continue to accumulate mass and move a sufficient distance away from NGC 4747 to avoid falling back into the latter, then optimistically, both of these objects could evolve into long-lived TDGs.
KK 167 is not in the immediate vicinity of another galaxy and appears to be a dark matter dominated dIrr with SFR yr-1. Nevertheless, the Hi distribution in KK 167 appears truncated within a faint stellar disk, which is unusual for undisturbed dIrrs (e.g. Broeils & Rhee 1997, Hunter et al. 2012). The optical appearance of KK 167 is similar to other low-mass galaxies such as blue compact dwarfs (e.g. Pustilnik, Kniazev & Pramskij 2005) but its SFR also precludes it from this classification (see Cairós et al. 2001). Although there are clear signs of tidal interactions occurring within the NGC 4725/47 group, it is unclear whether these same interactions are responsible for the stellar properties and truncated Hi distribution of KK 167. As previously mentioned, the GMRT pointing centred on this source was slightly noisier and required additional flagging of short baselines. It appears that of the Hi in KK 167 (that was detected by ALFALFA) is resolved out by the GMRT and is assumed to be diffusely distributed around the galaxy. Therefore, with additional consideration of the limitations of the Bruzual & Charlot (2003) stellar age estimates, we conservatively identify KK 167 to be a classical dIrr rather than a tidal feature in the discussion below.
4.2 NGC 3166/9
NGC 3166/9 contains a TDG candidate, AGC 208457, linked to NGC 3166 by a very faint tidal tail, at least three dIrrs and four Hi knots. AGC 208457, as shown in Paper 1, has a low dynamical to baryonic mass ratio indicating that little to no dark matter is associated with this feature. Measurements from the deep optical photometry presented here for this group show that AGC 208457 is bluer, with a 0.28 mag - colour, and at least a few Gyr younger — for either a Chabrier or Salpeter IMF and allowing for metallicities in the range of 0.0001 0.05 — than its purported parents, NGC 3166 and NGC 3169 (both with - mag). These results are comparable to those from Kaviraj et al. (2012), who find that tidal knots have a median colour offset of 0.3 mag in - from their parents and the average age of interacting spirals is 7 Gyr.
Gas-phase metallicity measurements, which would ultimately verify tidal origins for AGC 208457 (e.g. Duc et al. 2007, Sweet et al. 2014) — using optical spectroscopy in a similar manner as presented in Duc et al. (2014) — are currently being explored for this feature. If AGC 208457 has a low metallicity of = 0.0001, then it would be 1.6 - 2.6 Gyr in age; whereas, a higher metal content (i.e. 0.004) would indicate that the stars in this object formed within the last Gyr.
As detailed in Paper 1, AGC 208443 and AGC 208444 are likely in-falling dIrr galaxies that are interacting with each other. The residual reflection halo from a nearby bright star hindered the ability to obtain additional details about the stellar components of these two dwarfs; however, since they are located in the peripheral region of the group, it is unlikely that they have influence on the central group members. Our Hi and optical observations reveal that AGC 208537 is relatively isolated (i.e. not located near any tidal features) and has a velocity gradient across its major axis that suggests rotation. Unfortunately, another foreground star prohibits the detection and measurement of an optical counterpart. The measured dynamical to gas mass ratio is 5 for AGC 208537 and since typical dIrrs have (Bradford, Geha & Blanton, 2015), any likely associated optical feature would not change the fact that this galaxy is dark matter dominated.
The Hi knots C1 to C4 appear to lie along a gaseous arc that is consistent with a tidal tail stemming from NGC 3169. The lack of significant stellar counterparts for all four GMRT detections, their location in the tidal tail of NGC 3169 and the young age of the optical region coinciding with two of the Hi knots suggest that these objects are tidal in nature. Their gas masses ( ) are below the threshold required to become long-lived TDGs and would remain as such even if they accrete all of the gas detected by ALFALFA in this region (see Paper 1). These low masses indicate that C1 to C4 are unlikely to be self-gravitating and will eventually fall back into their parent galaxy within a few 100 Myr (see Bournaud & Duc 2006).
5 Discussion: the Frequency and Diversity of Long-lived Tidal Features
With high-resolution Hi observations and deep optical photometry now in-hand for all three galaxy groups in this study, it is now possible to consider the implications of the survey results as a whole. The consequences of the tidal features detected in the survey are discussed in this section.
Simulations within the standard cosmological framework predict that the properties of TDGs and large tidal knots differ from dIrrs. A key distinguishing characteristic is the dynamical to baryonic mass ratio (Hunter et al., 2000). Although dynamical mass estimates rely heavily on the assumption of self-gravitation and dynamic equilibrium within a source, TDGs and tidal knots appear to have significantly less total mass — and therefore little to no dark matter — compared to their classical counterparts. Discernment can also arise from age, metallicity and baryonic content; however, measurement of these properties have proven to be quite difficult for low surface brightness objects. Our main constraint on the origin of the low-mass Hi features detected in this survey relies on the dynamical to baryonic mass ratio for each object.
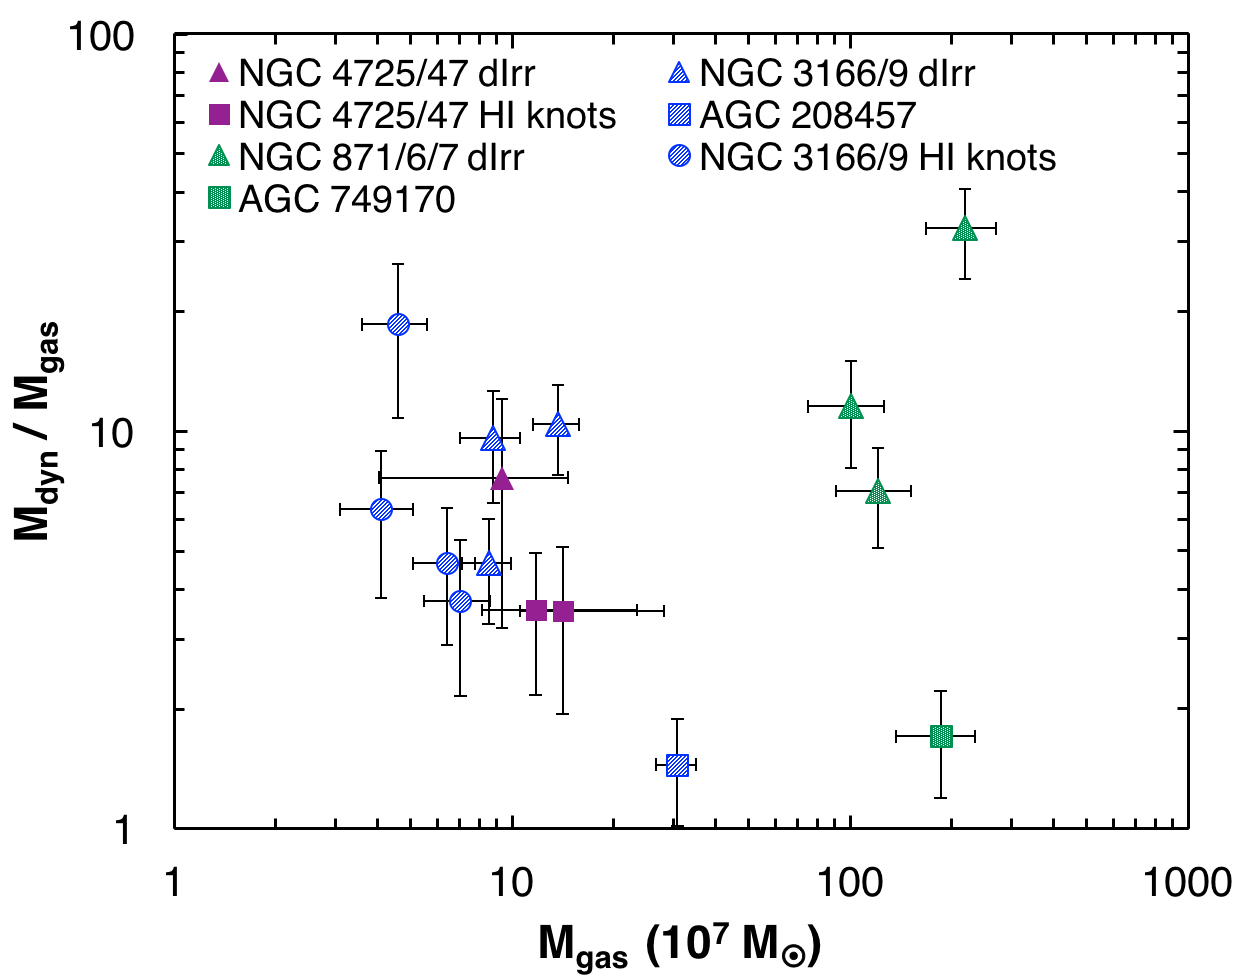
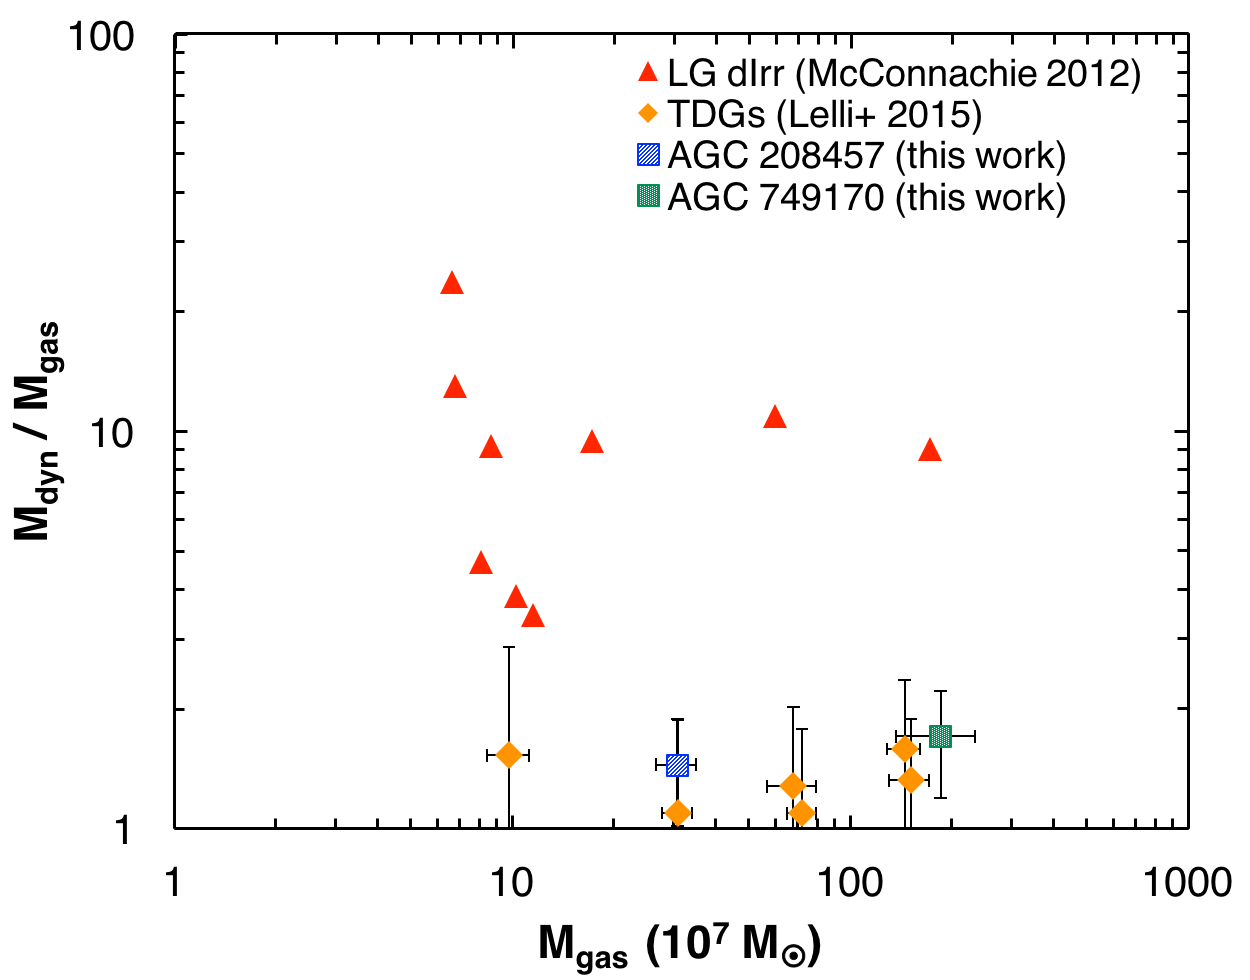
Overall, as summarized in Table 9, the three groups in our study contain a total of eight spiral galaxies, at least eight dIrrs, four tidal knots (with 107 ) that are likely short-lived, and four tidal knots containing sufficient gas to survive and evolve into long-lived TDGs. Fig. 13 compares of all 16 gas-rich low-mass objects detected in the three groups. AGC 208457 and AGC 749170 appear distinct (i.e. are found in the lower region of the plot) from the other dwarf galaxies and tidal knots that are currently not self-gravitating. The mass ratios of these two objects are compared to the properties of classical gas-rich dwarfs compiled by McConnachie (2012) and TDGs presented in Lelli et al. (2015) in Fig. 14. There is a clear separation between TDGs and other gas-rich galaxies in this parameter space, with the TDGs (including AGC 208457 and AGC 749170) occupying the lower portion of the plot and dIrrs occupying the upper portion.
| Name | Classification | Interpretation |
| NGC 3166/9: (Lee-Waddell et al. 2012, this work) | ||
| NGC 3165 | spiral | |
| NGC 3166 | spiral | interacting with NGC 3169 |
| C1 | tidal knot | short-lived |
| C2 | tidal knot | short-lived |
| AGC 208443 | dIrr | interacting with AGC 208444 |
| AGC 208444 | dIrr | interacting with AGC 208443 |
| AGC 208457 | tidal knot | TDG candidate, long-lived |
| C3 | tidal knot | short-lived |
| NGC 3169 | spiral | interacting with NGC 3166 |
| C4 | tidal knot | short-lived |
| AGC 208537 | dIrr | |
| NGC 871/6/7: (Lee-Waddell et al., 2014) | ||
| AGC 748849 | dIrr | |
| NGC 871 | spiral | |
| AGC 121467 | dIrr | |
| UGC 1761 | dIrr/Irr | |
| AGC 749170 | tidal knot | optically dim, long-lived |
| AGC 748853 | dIrr | |
| NGC 876 | spiral | interacting with NGC 877 |
| NGC 877 | spiral | interacting with NGC 876 |
| NGC 4725/47: (this work) | ||
| NGC 4725 | spiral | interacting with NGC 4747 |
| KK 167 | dIrr | |
| NGC 4747 | spiral | interacting with NGC 4725 |
| NE-1 | tidal knot | potentially long-lived |
| NE-2 | tidal knot | potentially long-lived |
AGC 208457, found in NGC 3166/9, meets most of the criteria for a TDG and is quite similar to another candidate, MDL92, found in NGC 4038/9 (see Mirabel, Dottori & Lutz 1992). Both are located at the tip of a tidal tail, contain sufficient Hi mass to become self-gravitating and have an optical counterpart consisting of young stars (see Hibbard et al. 2001 for a detailed analysis of MDL92). Nevertheless, neither AGC 208457 nor MDL92 appear to show clear signs of rotation, contrasting the TDGs observed and modelled by Lelli et al. (2015). This discrepancy could be attributed to limited resolution of the observations (considering that two of the six TDGs in Lelli et al. (2015) have velocity gradients spanning 20 km s-1) or could indicate that some TDGs are more supported by pressure rather than by rotation.
AGC 749170, in NGC 871/6/7, is a fairly massive Hi knot ( ) with a possible stellar component ( ) comprising fairly young stars (Paper 2). This extremely optically dim feature appears to be tidal and is located 90 kpc away from its likely parent galaxies; however, the lack of a readily detectable star forming optical counterpart precludes its classification as a ‘typical’ TDG or tidal knot. As described in Paper 2, the column density of the Hi in AGC 749170 falls below the star formation threshold (defined by Saviane, Hibbard & Rich 2004) and its gas volume density is similar to that of other tidal debris with minimal signs of star formation (see Maybhate et al. 2007).
AGC 749170 also has comparable properties to a few other Hi-rich galaxy-like objects (e.g. Chengalur, Giovanelli & Haynes 1995, English et al. 2010, Cannon et al. 2015), which possibly lie on the extreme end of a class of optically dark/dim tidal features. Simulations predict that a tidal object this massive and this far from its parent galaxies should be long-lived (Bournaud & Duc, 2006); however, the stellar counterpart to AGC 749170 is much fainter than any simulated object (e.g. Duc, Bournaud & Masset 2004). Optimistically assuming that the longevity predictions for simulated TDGs hold for AGC 749170 as well, then the interaction event in NGC 871/6/7 produced one long-lived TDG.
In NGC 4725/47, the discussion in Section 4.1 suggests that NE-1 and NE-2 are likely young tidal knots that have yet to enter into their interaction induced star-bursting phases. Possible projection effects of the tidal tails would indicate over-estimates in the Hi masses for these features. Nevertheless, these knots could accrete more gas from the tail in which they are embedded and eventually move a sufficient distance from NGC 4747, which would enable them to become self-gravitating TDGs. If this scenario corresponds to the future of NE-1 and NE-2, then the interaction in NGC 4725/47 will have produced two long-lived TDGs.
To summarize the survey results, our observations of the NGC 3166/9 group reveal one TDG candidate, while optimistic assumptions regarding the future evolution of the Hi features detected in NGC 871/6/7 and NGC 4725/47 suggest that these groups could respectively harbour one and two long-lived TDGs. The incidence of long-lived TDGs with (and a variety of stellar counterparts) across the three groups studied could therefore be as high as 1.3 TDGs per interacting galaxy pair.
5.1 Comparison to Simulations
Assuming that the two largest spirals in each group produced the tidal objects discussed above, then the incidence and the properties of the latter can readily be compared to TDGs produced in simulations of interacting galaxy pairs. Numerical simulations by Bournaud & Duc (2006) show an average production rate of 6.2 tidal substructures (with ) per galaxy interaction event. The majority (65%) of these features quickly dissipate (i.e. fall back into their parent galaxies or fade below the detection limit of ) within 500 Myr and after 2 Gyr, only 20% of the tidal knots — i.e. 1.2 tidal knots per interaction event — remain intact (many of which had original masses ). Alternatively, simulations used by Yang et al. (2014) find that a few tens of large tidal knots, with , are produced during each galaxy interaction event and most of the knots are assumed to be long-lived (surviving over 9 Gyr).
The unbiased survey of low-mass features presented here is sensitive to Hi masses as low as and would therefore detect the tidal objects produced in the various models and simulations discussed above. We find similar formation and longevity statistics of observable galaxy-like tidal objects to those produced in the simulations by Bournaud & Duc (2006). Our observations show a total of four potentially long-lived TDGs formed in the three groups studied and that even short-lived tidal knots are not overly abundant in these systems.
These results do not corroborate the hypothesis that interaction events can produce several tens of viable long-lived TDGs (e.g. Yang et al. 2014). Nevertheless, our sample size is small and was specifically chosen to study the constituents within recently interacting groups, which may not be directly comparable to the longer range simulations. It is also evident that the simulations of Yang et al. (2014) require a much more favourable interaction geometry for producing large tidal knots than those probed in this study in order to reconcile their TDGs formation rates with the incidence of TDGs found here.
Additionally, the stellar properties of the tidal objects in the three groups do not necessarily resemble the TDGs produced by simulations. Numerical simulations by Duc et al. (2004) show that TDGs, with masses on the order of , should contain at least 25% of their masses in the form of stars, the majority of which were formed in situ. AGC 208457, in the NGC 3166/9 group, does appear to have a significant stellar component consisting of young stars; however, its stellar mass is still relatively low.
The critical Hi column density required for star formation to occur is atoms cm-2 (Schaye, 2004). NE-1 and NE-2, in the NGC 4725/47 group, are possibly too young to be star-bursting but do have a sufficient average column density — atoms cm-2 for both features as measured from the 30 arcsec resolution GMRT mom0 maps — to begin forming stars. It is possible that these two knots will eventually resemble the TDGs produced in simulations.
AGC 749170, in the NGC 871/6/7 group, has an abundant amount of Hi and the absence of a detectable tail indicates that it has had sufficient time to detach from NGC 876 and/or NGC 877 and evolve independently. This probable tidal object is neither actively star forming nor does it possess an obvious stellar component and therefore it does not resemble the TDGs formed in simulations. Overall, the TDGs in the groups studied here exhibit a wide range of properties, only some of which can be explained using timing arguments.
The diversity in initial properties and interaction parameters of the parent galaxies in an interaction event can cause significant variations in tidal features that are produced; however, current simulations tend to model pairs of galaxies and do not take into account broader effects of the group environment. It is possible that the mechanisms that form TDGs are complicated by the gravitational effects of neighbouring galaxies and the intra-group medium, even in the relatively loose groups in this study. In addition, numerical work by Smith et al. (2013) show that due to their lack of dark matter, TDGs should be highly susceptible to ram pressure, which can truncate star formation and strip gas and stellar content. Determining whether the lack of stars in the tidal objects studied in this survey is the result of initial environmental parameters or post-formation external mechanisms warrants detailed follow-up.
6 Conclusions
We have conducted a detailed multi-wavelength investigation of the gas-rich dwarf galaxy populations of three nearby interacting groups. The galaxy groups were selected from the blind ALFALFA survey, which allowed detailed follow up on every detection in each group to produce an unbiased census of their dwarf galaxy populations. High-resolution GMRT observations were used to resolve the Hi belonging to the low-mass group members and measure their dynamical masses (under the strong assumption that each detection is self-gravitating in dynamical equilibrium). Deep optical imaging from the CFHT provided estimates of the stellar masses and ages of putative optical counterparts to the Hi detections. The combination of Hi data and optical photometry enabled the distinction between and classification of dIrrs, short-lived tidal knots, and TDG candidates in our unbiased census.
Taking into account all the features detected in the three groups in this survey, majority of the detectable low-mass objects appear to be either classical dIrr galaxies or short-lived tidal knots. AGC 208457 — located in NGC 3166/9 — has the hallmarks of a standard TDG, albeit without clear signs of rotation. AGC 749170 — located in NGC 871/6/7 — is a gas-rich tidal cloud that has clearly detached from its parent galaxies; however, the lack of a significant stellar component designates AGC 749170 into a possibly rare class of optically dark/dim tidal features that are not currently found in simulations. In NGC 4725/47, tidal knots NE-1 and NE-2 appear to be in the very early stages of formation and both objects have the potential to evolve into long-lived TDGs.
Overall, four tidal objects with have been identified in the three groups. These objects will possibly become long-lived tidal galaxies, implying a TDG production rate in agreement to that found by the simulations in Bournaud & Duc (2006), which is considerably lower than the rate implied in the work by Yang et al. (2014). Nevertheless, the diversity in the properties of tidal features are not reflected in current simulations, even at the high-mass end (i.e. AGC 749170). With the advancement of modern telescopes that are beginning to detect even fainter objects, simulations with higher sensitivity and resolution are required to model lower mass features and take into account the broader environmental effects within galaxy groups.
Acknowledgements
We thank the staff of the GMRT that made our interferometric observations possible. Thank-you to the reviewer, P.-A. Duc, for his thoroughly detailed suggestions and comments to improve the clarity of this paper. We also thank J.A. Irwin for her input on the overall research project. K.S. acknowledges funding from the National Sciences and Engineering Research Council of Canada. The ALFALFA team at Cornell is supported by U.S. NSF grants AST-0607007 and AST-1107390 to R.G. and M.P.H. and by grants from the Brinson Foundation. The GMRT is run by the National Centre for Radio Astrophysics of the Tata Institute of Fundamental Research. This research used optical observations obtained with MegaPrime/MegaCam, a joint project of CFHT and CEA/DAPNIA, at the Canada-France-Hawaii Telescope (CFHT) which is operated by the National Research Council (NRC) of Canada, the Institute National des Science de l’Univers of the Centre National de la Recherche Scientifique of France, and the University of Hawaii.
References
- Bertin & Arnouts (1996) Bertin, E., Arnouts, S., 1996, A&AS, 117, 393
- Bournaud & Duc (2006) Bournaud F., Duc P.-A., 2006, A&A, 456, 481
- Bournaud et al. (2007) Bournaud F., et al., 2007, Science, 316, 1166
- Bradford, Geha & Blanton (2015) Bradford J., Geha M., Blanton M., 2015, ApJ, 809, 146
- Braine et al. (2001) Braine J., Duc P.-A., Lisenfeld U., Charmandaris V., Vallejo O., Leon S., Brinks E., 2001, A&A, 378, 51
- Brinks, Duc & Walter (2004) Brinks E., Duc P.-A., Walter F., 2004, IAUS, 217, 532
- Broeils & Rhee (1997) Broeils A.H., Rhee M.-H., 1997, A&A, 324, 877
- Bruzual & Charlot (2003) Bruzual G. and Charlot S., 2003, MNRAS, 344, 1000
- Cairós et al. (2001) Cairós L.M., Vílchez J.M., González Pérez J.N., Iglesias-Páramo J., Caon N., 2001, ApJS, 133, 321
- Cannon et al. (2015) Cannon J.M., et al., 2015, AJ, 149, 72
- Chabrier (2003) Chabrier G., 2003, PASP, 115, 763
- Chengalur, Giovanelli & Haynes (1995) Chengalur J.N., Giovanelli R., Haynes M.P., 1995, AJ, 109, 2415
- Cuillandre & Ferrarese (2011) Cuillandre J.-C., Ferrarese L., 2011, CFHT Annual Report, 6
- Dabringhausen & Kroupa (2013) Dabringhausen J., Kroupa P., 2013, MNRAS, 429, 1858
- Duc, Bournaud & Masset (2004) Duc P.-A., Bournaud F., Masset F., 2004, A&A, 427, 803
- Duc et al. (2007) Duc P.-A., Braine J., Lisenfeld U., Brinks E., Boquien M., 2007, A&A, 475, 187
- Duc et al. (2000) Duc P.-A., Brinks E., Springel V., Pichardo B., Weilbacher P., Mirabel I. F., 2000, AJ, 120, 1238
- Duc et al. (2014) Duc P.-A., Paudel S., McDermid R. M., Cuillandre J.-C., Serra P., Bournaud F., Cappellari M., Emsellem, E., 2014, MNRAS, 440, 1458
- Duc et al. (2011) Duc P.-A., et al., 2011, MNRAS, 417, 863
- Eke et al. (2004) Eke V., et al. 2004, MNRAS, 348, 866
- English et al. (2010) English J., Koribalski B., Bland-Hawthorn J., Freeman K. C., McCain C. F., 2010, AJ, 139, 102
- Ferrarese et al. (2012) Ferrarese L., et al., 2012, ApJS, 200, 4
- Fouquet et al. (2012) Fouquet S., Hammer F., Yang Y., Puech M., Flores H., 2012, MNRAS, 427, 1769
- Gibson et al. (1999) Gibson B.K., et al., 1999, ApJ, 512, 48
- Giovanelli & Haynes (1988) Giovanelli R., Haynes M. P., 1988, Extragalactic Neutral Hydrogen, Springer-Verlag, Berlin
- Giovanelli et al. (2005) Giovanelli R., et al., 2005, AJ, 130, 2598
- Greisen (2003) Greisen E.W., 2003, ASSL, 285, 109
- Haynes (1979) Haynes M.P., 1979, AJ, 84, 1830
- Haynes et al. (2011) Haynes M.P., et al., 2011, AJ, 142, 170
- Hibbard et al. (2001) Hibbard J.E., van der Hulst J.M., Barnes J. E., Rich R. M., 2001, AJ, 122, 2969
- Huang et al. (2011) Huang S., Haynes M. P., Giovanelli R., Brinchmann J., Stierwalt S., Neff S.G., 2011, AJ, 143, 133
- Hunter, Elmegreen & Ludka (2010) Hunter D.A., Elmegreen B.G., Ludka B. C., 2010, AJ, 139, 447
- Hunter, Hunsberger & Roye (2000) Hunter D.A., Hunsberger S.D., Roye E.W., 2000, ApJ, 542, 137
- Hunter et al. (2012) Hunter D.A., et al., 2012, AJ, 144, 134
- Ibata et al. (2013) Ibata R.A., et al., 2013, Nature, 493, 62
- Karachentseva & Karachentsev (1998) Karachentseva V.E., Karachentsev I.D., 1998, A&AS, 127, 409
- Kaviraj et al. (2012) Kaviraj S., Darg D., Lintott C., Schawinski K., Silk J., 2012, MNRAS, 419, 70
- Kennicutt (1998) Kennicutt Jr., R. C., 1998, ARA&A, 36, 189
- Kroupa (2012) Kroupa P., 2012, PASA, 29, 395
- Lee-Waddell et al. (2012) Lee-Waddell K., Spekkens K., Haynes M.P., Stierwalt S., Chengalur J., Chandra P., Giovanelli R., 2012, MNRAS, 427, 2314
- Lee-Waddell et al. (2014) Lee-Waddell K., et al., 2014, MNRAS, 443, 3601
- Lelli et al. (2015) Lelli F., et al., 2015, A&A, 584, 113
- Magnier & Cuillandre (2004) Magnier E. A., Cuillandre J.-C., 2004, PASP, 116, 449
- Mateo (1998) Mateo M. L., 1998, ARA&A, 36, 435
- Maybhate et al. (2007) Maybhate A., Masiero J., Hibbard J., Charlton J., Palma C., Knierman K., English J., 2007, MNRAS, 381, 59
- McConnachie (2012) McConnachie A.W., 2012, AJ, 144, 4
- Mirabel, Dottori & Lutz (1992) Mirabel I. F., Dottori H., Lutz D., 1992, A&A, 256, L19
- Mirabel, Lutz & Maza (1991) Mirabel I.F., Lutz D., Maza J, 1991, A&A, 243, 367
- Paturel et al. (2003) Paturel G., Petit C., Prugniel P., Theureau G., Rousseau J., Brouty M., Dubois P., Cambrésy L., 2003, A&A, 412, 45
- Pawlowski, Pflamm-Altenburg & Kroupa (2012) Pawlowski M.S., Pflamm-Altenburg J., Kroupa P., 2012, MNRAS, 423, 1109
- Pustilnik, Kniazev & Pramskij (2005) Pustilnik S.A., Kniazev A.Y., Pramskij A.G., 2005, A&A, 443, 91
- Salpeter (1955) Salpeter E.E., 1955, ApJ, 121, 161
- Saviane, Hibbard & Rich (2004) Saviane I, Hibbard J.E., Rich R.M., 2004, AJ, 127, 660
- Schaye (2004) Schaye J. 2004, ApJ, 609, 667
- Sheen et al. (2009) Sheen Y., et al., 2009, AJ, 138, 1911
- Skibba et al. (2011) Skibba R.A., et al., 2011, ApJ, 738, 89
- Smith et al. (2013) Smith R., Duc P.-A., Candlish G.N., Fellhauer M., Sheen Y.-K., Gibson B.K., 2013, MNRAS, 436, 839
- Sweet et al. (2014) Sweet S.M., Drinkwater M.J., Meurer G., Bekki K., Dopita M.A., Kilborn V., Nicholls D.C., 2014, ApJ, 782, 35
- Tago et al. (2008) Tago E., Einasto J., Saar E., Tempel E., Einasto M., Vennik J., Müller V., 2008, A&A, 479, 927
- Taylor et al. (2011) Taylor E., et al., 2011, MNRAS, 418, 1587
- Wang et al. (2010) Wang J., Overzier R., Kauffmann G., von der Linden A., Kong X., 2010, MNRAS, 401, 433
- Weilbacher et al. (2003) Weilbacher P. M., Duc P.-A., Fritze-v. Alvensleben U., 2003, A&A, 397, 545
- Wevers et al. (1984) Wevers B.M.H.R., Appleton P.N., Davies R.D., Hart L., 1984, A&A, 140, 125
- Yang et al. (2014) Yang Y., Hammer F., Fouquet S., Flores H., Puech M., Pawlowski M.S., Kroupa P., 2014, MNRAS, 442, 2419
- Brinks et al. (2004)
- Duc et al. (2004)
- Hunter et al. (2000)