acmlicensed \isbn978-1-4503-4526-2/16/11\acmPrice$15.00 http://dx.doi.org/10.1145/2987443.2987472
A First Look at Quality of Mobile Live Streaming Experience: the Case of Periscope
Abstract
Live multimedia streaming from mobile devices is rapidly gaining popularity but little is known about the QoE they provide. In this paper, we examine the Periscope service. We first crawl the service in order to understand its usage patterns. Then, we study the protocols used, the typical quality of experience indicators, such as playback smoothness and latency, video quality, and the energy consumption of the Android application.
keywords:
Mobile live streaming; QoE; RTMP; HLS; Periscope1 Introduction
Periscope and Meerkat are services that enable users to broadcast live video to a large number of viewers using their mobile device. They both emerged in 2015 and have since gained popularity fast. Periscope, which was acquired by Twitter before the service was even launched, announced in March 2016 on their one year birthday that over 110 years of live video was watched every day with the application [13]. Also Facebook has recently launched a rival service called Facebook Live.
Very little details have been released about how these streaming systems work and what kind of quality of experience (QoE) they deliver. One particular challenge they face is to provide low latency stream to clients because of the features that allow feedback from viewers to the broadcaster in form of a chat, for example. Such interaction does not exist with “traditional” live video streaming systems and it has implications on the system design (e.g., protocols to use).
We have measures the Periscope service in two ways. We first created a crawler that queries the Periscope API for ongoing live streams and used the gathered data of about 220K distinct broadcasts to analyze the usage patterns. Second, we automated the process of viewing Periscope broadcasts with an Android smartphone and generated a few thousand viewing sessions while logging various kinds of data. Using this data we examined the resulting QoE. In addition, we analyzed the video quality by post processing the video data extracted from the traffic captures. Finally, we studied the application induced energy consumption on a smartphone.
Our key findings are the following: 1) 2 Mbps appears to be the key boundary for access network bandwidth below which startup latency and video stalling clearly increase. 2) Periscope appears to use the HLS protocol when a live broadcast attracts many participants and RTMP otherwise. 3) HLS users experience a longer playback latency for the live streams but typically fewer stall events. 4) The video bitrate and quality are very similar for both protocols and may exhibit significant short-term variations that can be attributed to extreme time variability of the captured content. 5) Like most video apps, Periscope is power hungry but, surprisingly, the power consumption grows dramatically when the chat feature is turned on while watching a broadcast. The causes are significantly increased traffic and elevated CPU and GPU load.
2 Methods and Data Collection
The Periscope app communicates with the servers using an API that is private in that the access is protected by SSL. To get access to it, we set up a so called SSL-capable man-in-the-middle proxy, i.e. mitmproxy [12], in between the mobile device and the Periscope service as a transparent proxy. The proxy intercepts the HTTPS requests sent by the mobile device and pretends to be the server to the client and to be the client to the server. The proxy enables us to examine and log the exchange of requests and responses between the Periscope client and servers. The Periscope iOS app uses the so called certificate pinning in which the certificate known to be used by the server is hard-coded into the client. Therefore, we only use the Android app in this study.
We used both Android emulators (Genymotion [3]) and smartphones in the study. We generated two data sets. For the first one, we used an Android emulator and developed an inline script for the mitmproxy that crawls through the service by continuously querying about the ongoing live broadcasts. The obtained data was used to analyze the usage patterns (Sec. 4).
The second dataset was generated for QoE analysis (Sec. 5) by automating the broadcast viewing process on a smartphone. The app has a “Teleport” button which takes the user directly to a randomly selected live broadcast. Automation was achieved with a script that sends tap events through Android debug bridge (adb) to push the Teleport button, wait for 60s, push the close button, push the “home” button and repeat all over again. The script also captures all the video and audio traffic using tcpdump. Meanwhile, we ran another inline script with mitmproxy that dumped for each broadcast viewed a description and playback statistics, such as delay and stall events, which the application reports to a server at the end of a viewing session. It is mainly useful for those streaming sessions that use the RTMP protocol because after an HTTP Live Streaming (HLS) session, the app reports only the number of stall events. We also reconstruct the video data of each session and analyze it using a variety of scripts and tools. After finding and reconstructing the multimedia TCP stream using wireshark [19], single segments are isolated by saving the response of HTTP GET request which contains an MPEG-TS file [5] ready to be played. For RTMP, we exploit the wireshark dissector which can extract the audio and video segments. The libav [10] tools have been used to inspect the multimedia content and decode the video in full for the analysis of Sec. 5.2.
In the automated viewing experiments, we used two different phones: Samsung Galaxy S3 and S4. The phones were located in Finland and connected to the Internet by means of reverse tethering through a USB connection to a Linux desktop machine providing them with over 100Mbps of available bandwidth both up and down stream. In some experiments, we imposed artificial bandwidth limits with the tc command on the Linux host. For latency measurement purposes (Section 5.1), NTP was enabled on the desktop machine and used the same server pool as the Periscope app.
3 Periscope Overview
Periscope enables users to broadcast live video for other users to view it. Both public and private broadcasting is available. Private streams are only viewable by chosen users. Viewers can use text chat and emoticons to give feedback to the broadcaster. The chat becomes full when certain number of viewers have joined after which new joining users cannot send messages. Broadcasts can also be made available for replay.
A user can discover public broadcasts in three ways: 1) The app shows a list of about 80 ranked broadcasts in addition to a couple of featured ones. 2) The user can explore the map of the world in order to find a broadcast in a specific geographical region. The map shows only a fraction of the broadcasts available in a large region and more broadcasts become visible as the user zooms in. 3) The user can click on the “Teleport” button to start watching a randomly selected broadcast.
| API request | request contents | response contents |
|---|---|---|
| mapGeoBroadcastFeed | Coordinates of a rectangle shaped geographical area | List of broadcasts located inside the area |
| getBroadcasts | List of 13-character broadcast IDs | Descriptions of broadcast IDs (incl. nb of viewers) |
| playbackMeta | Playback statistics | nothing |
Since the API is not public, we examined the HTTP requests and responses while using the app through the mitmproxy in order to understand how the API works. The application communicates with the servers by sending POST requests containing JSON encoded attributes to the following address: https://api.periscope.tv/api/v2/apiRequest. The apiRequest and its contents vary according to what the application wants to do. Requests relevant to this study are listed in Table 1.
Periscope uses two kinds of protocols for the video stream delivery: Real Time Messaging Protocol (RTMP) using port 80 and HTTP Live Streaming (HLS) because RTMP enables low latency (Section 5), while HLS is employed to meet scalability demands. Also Facebook Live uses the same set of protocols[8]. Further investigation reveals that the RTMP streams are always delivered by servers running on Amazon EC2 instances. For example, the IP address that the application got when resolving vidman-eu-central-1.periscope.tv gets mapped to ec2-54-67-9-120.us-west-1.compute.amazonaws.com when performing a DNS reverse lookup. In contrast, HLS video segments are delivered by Fastly CDN. RTMP streams use only one connection, whereas HLS may sometimes use multiple connections to different servers in parallel to fetch the segments, possibly for load balancing and/or resilience reasons. We study the logic of selecting the protocol and its impact on user experience in Section 5. Public streams are delivered using plaintext RTMP and HTTP, whereas the private broadcast streams are encrypted using RTMPS and HTTPS for HLS. The chat uses Websockets to deliver messages.
4 Analysis of Usage Patterns
We first wanted to learn about the usage patterns of Periscope. The application does not provide a complete list of broadcasts and the user needs to explore the service in ways described in the previous section. In late March of 2016, over 110 years of live video were watched every day through Periscope [13], which roughly translates into 40K live broadcasts ongoing all the time.
We developed a crawler by writing a mitmproxy inline script that exploits the /mapGeoBroadcastFeed request of the Periscope API. The script intercepts the request made by the application after being launched and replays it repeatedly in a loop with modified coordinates and writes the response contents to a file. It also sets the include_replay attribute value to false in order to only discover live broadcasts. In addition, the script intercepts /getBroadcasts requests and replaces the contents with the broadcast IDs found by the crawler since previous request and extracts the viewer information from the response to a file.
We faced two challenges: First, we noticed that when specifying a smaller area, i.e. when user zooms in the map, new broadcasts are discovered for the same area. Therefore, to find a large fraction of the broadcasts, the crawler must explore the world using small enough areas. Second, Periscope servers use rate limiting so that too frequent requests will be answered with HTTP 429 (“Too many requests”), which forces us to pace the requests in the script and increases the completion time of a crawl. If the crawl takes a long time, it will miss broadcast information.
Our approach is to first perform a deep crawl and then to select only the most active areas from that crawl and query only them, i.e., perform a targeted crawl. The reason is that deep crawl alone would produce too coarse grained data about duration and popularity of broadcasts because it takes over 10 minutes to finish. In deep crawl, the crawler zooms into each area by dividing it into four smaller areas and recursively continues doing that until it no longer discovers substantially more broadcasts. Such a crawl finds 1K-4K broadcasts111This number is much smaller than the assumed 40K total broadcasts but we miss private broadcasts and those with location undisclosed.. Figure 1 shows the cumulative number of broadcasts found as a result of crawls performed at different times of day. Figure 1(b) reveals that for all the different crawls, half of the areas contain at least 80% of all the broadcasts discovered in the crawl. We select those areas from each crawl, 64 areas in total, for a targeted crawl. We divide them into four sets assigned to four different simultaneously running crawlers, i.e., four emulators running Periscope with different user logged in (avoids rate limiting) that repeatedly query the assigned areas. Such targeted crawl completes in about 50s.
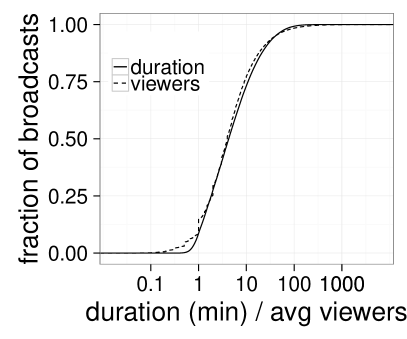
Figure 2 plots duration and viewing statistics about four different 4h-10h long targeted crawls started at different times of the day (note: both variables use the same scale). Broadcast duration was calculated by subtracting its start time (included in the description) from the timestamp of the last moment the crawler discovered the broadcast. Only broadcasts that ended during the crawl were included (must not have been discovered during the last 60s of a crawl) totalling to about 220K distinct broadcasts. Most of the broadcasts last between 1 and 10 minutes and roughly half are shorter than 4 minutes. The distribution has a long tail with some broadcasts lasting for over a day.
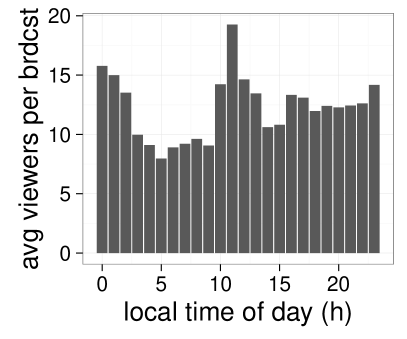
The crawler gathered viewer information about 134K broadcasts. Over 90% of broadcasts have less than 20 viewers on average but some attract thousands of viewers. It would be nice to know the contents of the most popular broadcasts but the text descriptions are typically not very informative. Over 10% of broadcasts have no viewers at all and over 80% of them are unavailable for replay afterwards (replay information is contained in the descriptions we collect about each broadcast), which means that no one ever saw them. They are typically much shorter than those that have viewers (avg durations 2min vs. 13 min) although some last for hours. They represent about 2% of the total tracked broadcast time. The local time of day shown in Figure 2(b) is determined based on the broadcaster’s time zone. Some viewing patterns are visible, namely a notable slump in the early hours of the day, a peak in the morning, and an increasing trend towards midnight, which suggest that broadcasts typically have local viewers. This makes sense especially from the language preferences point of view. Besides the difference between broadcasts with and without any viewers, the popularity is only very weakly correlated with its duration.
5 Quality of Experience
In this section, we study the data set generated through automated viewing with the Android smartphones. It consisted of streaming sessions with and without bandwidth limit to the Galaxy S3 and S4 devices. We have data of 4615 sessions in total: 1796 RTMP and 1586 HLS sessions without a bandwidth limit and 18-91 sessions for each specific bandwidth limit. Since the number of recorded sessions is limited, the results should be taken as indicative. The fact that our phone had a high-speed non-mobile Internet access means that typical users may experience worse QoE because of a slower and more variable Internet access with longer latency.
HLS seems to be used only when a broadcast is very popular. A comparison of the average number of viewers seen in an RTMP and HLS session suggests that the boundary number of viewers beyond which HLS is used is somewhere around 100 viewers. By examining the IP addresses from which the video was received, we noticed that 87 different Amazon servers were employed to deliver the RTMP streams. We could locate only nine of them using maxmind.com, but among those nine there were at least one in each continent, except for Africa, which indicates that the server is chosen based on the location of the broadcaster. All the HLS streams were delivered from only two distinct IP addresses, which maxmind.com says are located somewhere in Europe and in San Francisco. We do not currently know how the video gets embedded into an HLS stream for popular broadcasts but we assume that the RTMP stream gets possibly transcoded, repackaged, and delivered to Fastly CDN by Periscope servers. The fact that we used a single measurement location explains the difference in server locations observed between the protocols. As confirmed by analysis in [18], the RTMP server nearest to the broadcasting device is chosen when the broadcast is initialized, while the Fastly CDN server is chosen based on the location of the viewing device.
Since we had data from two different devices, we performed a number of Welch’s t-tests in order to understand whether the data sets differ significantly. Only the frame rate differs statistically significantly between the two datasets. Hence, we combine the data in the following analysis of video stalling and latency.
5.1 Playback Smoothness and Latency
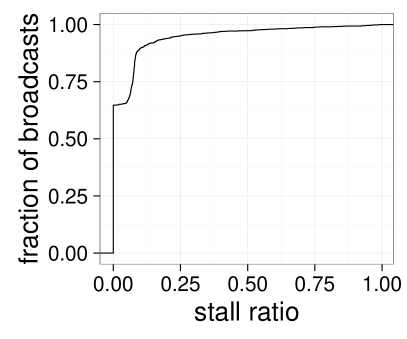
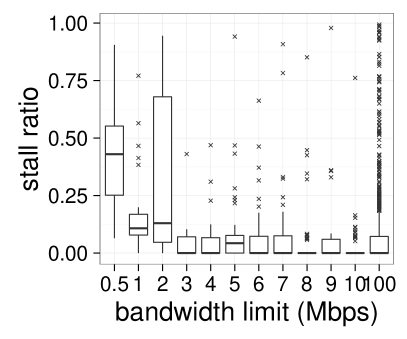
We first look at playback stalling. For RTMP streams, the app reports the number of stall events and the average stall time of an event, while for HLS it only reports the number of stall events. The stall ratio plotted for the RTMP streams in Figure 3(a) is calculated as summed up stall time divided by the total stream duration including stall and playback time. The bandwidth limit 100 in the figure refers to the unlimited case. Most streams do not stall but there is a notable number of sessions with stall ratio of 0.05-0.09, which corresponds usually to a single stall event that lasts roughly 3-5s. The boxplots in Figure 3(b) suggest that a vast majority of the broadcasts are streamed with a bitrate inferior to 2 Mbps because with access bandwidth greater than that, the broadcasts exhibited very little stalling. As for the broadcasts streamed using HLS, comparing their stall count to that of the RTMP streams indicates that stalling is rarer with HLS than with RTMP, which may be caused by HLS being an adaptive streaming protocol capable for quality switching on the fly.
The average video bitrate is usually between 200 and 400 kbps (see Section 5.2), which is much less than the 2 Mbps limit we found. The most likely explanation to this discrepancy is the chat feature. We measured the phone traffic with and without chat and observed a substantial increase in traffic when the chat was on. A closer look revealed that the JSON encoded chat messages are received even when chat is off, but when the chat is on, image downloads from Amazon S3 servers appear in the traffic. The reason is that the app downloads profile pictures of chatting users and displays them next to their messages, which may cause a dramatic increase in the traffic. For instance, we saw an increase of the aggregate data rate from roughly 500kbps to 3.5Mbps in one experiment. The precise effect on traffic depends on the number of chatting users, their messaging rate, the fraction of them having a profile picture, and the format and resolution of profile pictures. We also noticed that some pictures were downloaded multiple times, which indicates that the app does not cache them.
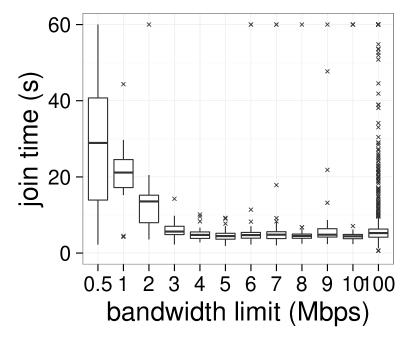
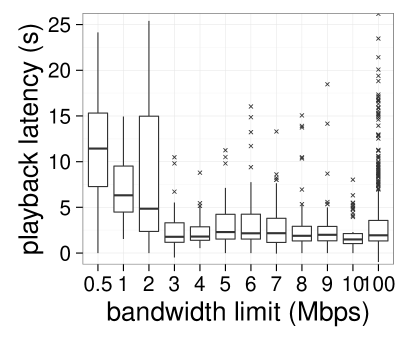
Each broadcast was watched for exactly 60s from the moment the Teleport button was pushed. We calculate the join time, often also called startup latency, by subtracting the summed up playback and stall time from 60s and plot it in Figure 4(a) for the RTMP streams. In addition, we plot in Figure 4(b) the playback latency, which is equivalent to the end-to-end latency. The y-axis scale was cut leaving out some outliers that ranged up to 4min in the case of playback latency. Both increase when bandwidth is limited. In particular, join time grows dramatically when bandwidth drops to 2Mbps and below. The average playback latency was roughly a few seconds when the bandwidth was not limited.
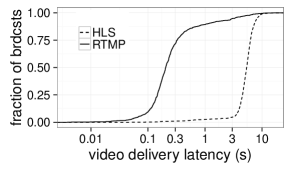
Through experiments where we controlled both the broadcasting and receiving client and captured both devices traffic, we noticed that the broadcasting client application regularly embeds an NTP timestamp into the video data, which is subsequently received by each viewing client. The experiments indicated that the NTP timestamps transmitted by the broadcasting device is very close to the tcpdump timestamps in a trace captured by a tethering machine. Hence, the timestamps enable calculating the delivery latency by subtracting the NTP timestamp value from the time of receiving the packet containing it, also for the HLS sessions for which the playback metadata does not include it. We calculate the average over all the latency samples for each broadcast. Figure 5 shows the distribution of the video delivery latency for the sessions that were not bandwidth limited. Even if our packet capturing machine was NTP synchronized, we sometimes observed small negative time differences indicating that the synchronization was imperfect. Nevertheless, the results clearly demonstrate the impact of using HLS on the delivery latency. RTMP stream delivery is very fast happening in less than 300ms for 75% of broadcasts on average, which means that the majority of the few seconds of playback latency with those streams comes from buffering. In contrast, the delivery latency with HLS streams is over 5s on average. As expected, the delivery latency grows when bandwidth is limited similarly to the playback latency. A more detailed analysis of the latency can be found in [18]. The delivery latency we observed matches quite well with their delay breakdown results (end-to-end delay excluding buffering).
In summary, HLS appears to be a fallback solution to the RTMP stream. The RTMP servers can push the video data directly to viewers right after receiving it from the broadcasting client. HLS delivery requires the data to be packaged in complete segments, possibly while transcoding it to multiple qualities, and the client application needs to separately request for each video segment, which all adds up to the latency. HLS does produce fewer stall events but we have seen no evidence of the video bitrate being adapted to the available bandwidth (Section 5.2). It is possible that the buffer sizing strategy causes the difference in the number of stall events between the two protocols but we cannot confirm this at the moment.
5.2 Audio and Video Quality
Both RTMP and HLS communications employ standard codecs for audio and video, that is, AAC (Advanced Audio Coding) for audio [7] and AVC (Advanced Video Coding) for video [6]. In more details, audio is sampled at 44,100 Hz, 16 bit, encoded in Variable Bit Rate (VBR) mode at about either 32 or 64 kbps, which seems enough to transmit almost any type of audio content (e.g., voice, music, etc.) with the quality expected from capturing through a mobile device.
Video resolution is always 320568 (or vice versa depending on orientation). The video frame rate is variable, up to 30 fps. Occasionally, some frames are missing hence concealment must be applied to the decoded video. This is probably due to the fact that the uploading device had some issues, e.g., glitches in the real-time encoding or during upload.


Fig. 6 shows the video bitrate, typically ranging between 200 and 400 kbps. Moreover, there is almost no difference between HLS and RTMP except for the maximum bitrate which is higher for RTMP. Analysis of such cases reveals that poor efficiency coding schemes have been used (e.g., I-type frames only). The most common segment duration with HLS is 3.6 s (60% of the cases), and it ranges between 3 and 6 s. However, the corresponding bitrate can vary significantly. In fact, in real applications rate control algorithms try to keep its average close to a given target, but this is often challenging as changes in the video content directly influences how difficult is to achieve such bitrate. To this aim, the so called quantization parameter (QP) is dynamically adjusted [2]. In short, the QP value determines how many details are discarded during video compression, hence it can be used as a very rough indication of the quality of a given video segment. Note that the higher the QP, the lower the quality and vice versa.
To investigate quality, we extracted the QP and computed its average value for all the videos. Fig. 6 shows the QP vs bitrate for each captured video (the whole video for RTMP and each segment for HLS). When the quality (i.e., QP value) is roughly the same, the bitrate varies in a large range. On one hand, this is an indication that the type of content strongly differ among the streams. For instance, some of them feature very static content such as one person talking on a static background while others show, e.g., soccer matches captured from a TV screen. On the other hand, observing how the bitrate and average QP values vary over time may provide interesting indications on the evolution of the communication, e.g., hints about whether representation changes are used. Unfortunately, we are currently unable to draw definitive conclusions since the variation could also be due to significant changes in the video content which should be analyzed in more depth.
Finally, we investigated the frame type pattern used for encoding. Most use a repeated IBP scheme. Few encodings (20.0 % for RTMP and 18.4% for HLS) only employ I and P frames only (or just I in 2 cases). After about 36 frames, a new I frame is inserted. Although one B frame inserts a delay equal to the duration of the frame itself, in this case we speculate that the reason they are not present in some streams could be that some old hardware might not support them for encoding.
5.3 Power Consumption
We connected a Samsung Galaxy S4 4G+ smartphone to a Monsoon Power Monitor [1] in order to measure its power consumption as instructed in [17]. We used the PowerTool software to record the data measured by the power monitor and to export it for further analysis.
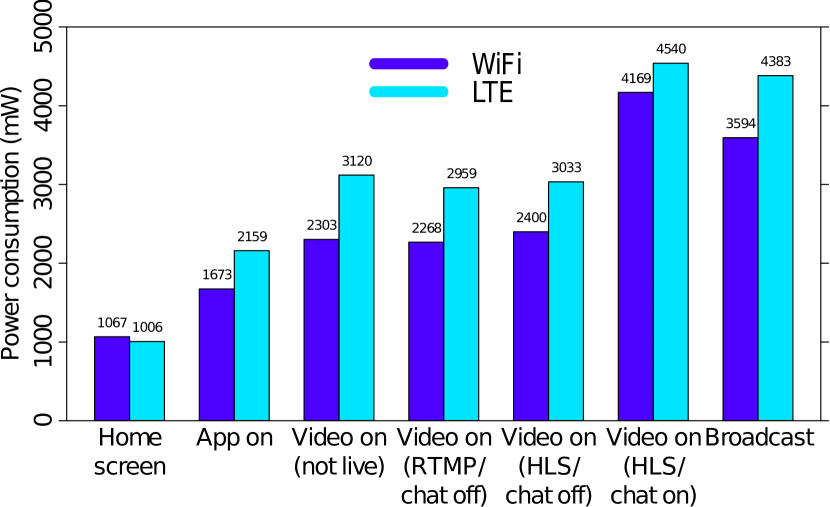
The screen brightness was full in all test cases and the sound was off. The phone was connected to the Internet through non-commercial WiFi and LTE networks222It is a full-fledged LTE network operated by Nokia. DRX was enabled with typical timer configuration.. Figure 7 shows the results. We measured the idle power draw in the Android application menu to be around 900 to 1000 mW both with WiFi and LTE connections. With the Periscope app on without video playback, the power draw grows already to 1537 mW with WiFi and to 2102 mW with LTE because the application refreshes the available videos every 5 seconds.
Playing back old recorded videos with the application consume an equal amount of power as playing back live videos. The power consumption difference of RTMP vs HLS is also very small. Interestingly, enabling the chat feature of the Periscope videos raises the power consumption to 2742 mW with WiFi and up to 3599 mW with LTE. This is only slightly less than when broadcasting from the application. However, the test broadcasts had no chat displayed on the screen.
We further investigated the impact of the chat feature by monitoring CPU and GPU activity and network traffic. Both processors use DVFS to scale power draw to dynamic workload [17]. We noticed an increase by roughly one third in the average CPU and GPU clock rates when the chat is enabled, which implies higher power draw by both processors. Recall from Section 5.1 that the chat feature may increase the amount of traffic, especially with streams having an active chat, which inevitably increases the energy consumed by wireless communication. The energy overhead of chat could be mitigated by caching profile pictures and allowing users to disable their display in the chat.
6 Related work
Live mobile streaming is subject to increasing attention, including from the sociological point of view [14]. In the technical domain, research about live streaming focused on issues such as distribution optimization [11], including scenarios with direct communication among devices [22]. The crowdsourcing of the streaming activity itself also received particular attention [4, 21].
Stohr et al. have analyzed the YouNow service [15] and Tang et al. investigated the role of human factors in Meerkat and Periscope [16]. Little is known, however, about how such mobile applications perform. Most of the research has focused on systems where the mobile device is only the receiver of the live streaming, like Twitch.Tv [20], or other mobile VoD systems [9].
We believe that this work together with the work of Wang et al. [18] are the first to provide measurement-based analyses on the anatomy and performance of a popular mobile live streaming application. Wang et al. thoroughly study the delay and its origins but, similar to us, also show results on usage patterns and video stalling, particularly the impact of buffer size. They also reveal a particular vulnerability in the service.
7 Conclusions
We explored the Periscope service providing insight on some key performance indicators. Both usage patterns and technical characteristics of the service (e.g., delay and bandwidth) were addressed. In addition, the impact of using such a service on the mobile devices was studied through the characterization of the energy consumption. We expect that our findings will contribute to a better understanding of how the challenges of mobile live streaming are being tackled in practice.
8 Acknowledgments
This work has been financially supported by the Academy of Finland, grant numbers 278207 and 297892, and the Nokia Center for Advanced Research.
References
- [1] Monsoon: www.msoon.com.
- [2] Z. Chen and K. N. Ngan. Recent advances in rate control for video coding. Signal Processing: Image Communication, 22(1):19–38, 2007.
- [3] Genymotion: https://www.genymotion.com/.
- [4] Q. He, J. Liu, C. Wang, and B. Li. Coping with heterogeneous video contributors and viewers in crowdsourced live streaming: A cloud-based approach. IEEE Transactions on Multimedia, 18(5):916–928, May 2016.
- [5] ISO/IEC 13818-1. MPEG-2 Part 1 - Systems, Oct. 2007.
- [6] ISO/IEC 14496-10 & ITU-T H.264. Advanced Video Coding (AVC), May 2003.
- [7] ISO/IEC 14496-3. MPEG-4 Part 3 - Audio, Dec. 2005.
- [8] F. Larumbe and A. Mathur. Under the hood: Broadcasting live video to millions. https://code.facebook.com/posts/1653074404941839/under-the-hood-broadcasting-live-video-to-millions/, Dec. 2015.
- [9] Z. Li, J. Lin, M.-I. Akodjenou, G. Xie, M. A. Kaafar, Y. Jin, and G. Peng. Watching videos from everywhere: a study of the PPTV mobile VoD system. In Proc. of the 2012 ACM conf. on Internet Measurement Conference, pages 185–198. ACM, 2012.
- [10] LibAV Project: https://libav.org/.
- [11] T. Lohmar, T. Einarsson, P. Fröjdh, F. Gabin, and M. Kampmann. Dynamic adaptive HTTP streaming of live content. In World of Wireless, Mobile and Multimedia Networks (WoWMoM), 2011 IEEE International Symposium on a, pages 1–8, June 2011.
- [12] Mitmproxy Project: https://mitmproxy.org/.
- [13] Periscope. Year one. https://medium.com/@periscope/year-one-81c4c625f5bc\#.mzobrfpig, Mar. 2016.
- [14] D. Stewart and J. Littau. Up, periscope: Mobile streaming video technologies, privacy in public, and the right to record. Journalism and Mass Communication Quarterly, Special Issue: Information Access and Control in an Age of Big Data, 2016.
- [15] D. Stohr, T. Li, S. Wilk, S. Santini, and W. Effelsberg. An analysis of the younow live streaming platform. In Local Computer Networks Conference Workshops (LCN Workshops), 2015 IEEE 40th, pages 673–679, Oct 2015.
- [16] J. C. Tang, G. Venolia, and K. M. Inkpen. Meerkat and periscope: I stream, you stream, apps stream for live streams. In Proceedings of the 2016 CHI Conference on Human Factors in Computing Systems, CHI ’16, pages 4770–4780, New York, NY, USA, 2016. ACM.
- [17] S. Tarkoma, M. Siekkinen, E. Lagerspetz, and Y. Xiao. Smartphone Energy Consumption: Modeling and Optimization. Cambridge University Press, 2014.
- [18] B. Wang, X. Zhang, G. Wang, H. Zheng, and B. Y. Zhao. Anatomy of a personalized livestreaming system. In Proc. of the 2016 ACM Conference on Internet Measurement Conference (IMC), 2016.
- [19] Wireshark Project: https://www.wireshark.org/.
- [20] C. Zhang and J. Liu. On crowdsourced interactive live streaming: A twitch.tv-based measurement study. In Proceedings of the 25th ACM Workshop on Network and Operating Systems Support for Digital Audio and Video, NOSSDAV ’15, pages 55–60, New York, NY, USA, 2015. ACM.
- [21] Y. Zheng, D. Wu, Y. Ke, C. Yang, M. Chen, and G. Zhang. Online cloud transcoding and distribution for crowdsourced live game video streaming. IEEE Transactions on Circuits and Systems for Video Technology, PP(99):1–1, 2016.
- [22] L. Zhou. Mobile device-to-device video distribution: Theory and application. ACM Trans. Multimedia Comput. Commun. Appl., 12(3):38:1–38:23, Mar. 2016.