Fluids with competing interactions: I. Decoding the structure factor to detect and characterize self-limited clustering
Abstract
We use liquid state theory and computer simulations to gain insights into the shape of the structure factor for fluids of particles interacting via a combination of short-range attractions and long-range repulsions. Such systems can reversibly morph between homogeneous phases and states comprising compact self-limiting clusters. We first highlight trends with respect to the presence and location of the intermediate-range order (IRO) pre-peak in the structure factor, which is commonly associated with clustering, for wide ranges of the tunable parameters that control interparticle interactions (e.g., Debye screening length). Next, for approximately 100 different cluster phases at various conditions (where aggregates range in size from six to sixty monomers), we quantitatively relate the shape of the structure factor to physical characteristics including intercluster distance and cluster size. We also test two previously postulated criteria for identifying the emergence of clustered phases that are based on IRO peak-height and -width, respectively. We find that the criterion based on peak-width, which encodes the IRO thermal correlation length, is more robust across a wide range of conditions and interaction strengths but nonetheless approximate. Ultimately, we recommend a hybrid heuristic drawing on both pre-peak height and width for positively identifying the emergence of clustered states.
pacs:
Valid PACS appear hereI Introduction
Competing interactions between particles or molecules that manifest at distinct lengthscales can generate hierarchical structure in soft matter systems Seul and Andelman (1995). For contexts as diverse as microemulsions Langevin (1988), block-copolymers Helfand (1975); Hamley (2004), graphene oxides Zhang, Sun, and Yang (2012), and confined fluid mixtures Cynthia Goh, Goldburg, and Knobler (1987); Schemmel et al. (2003); Jadrich and Schweizer (2014), this type of constituent frustration drives (often abrupt) transformations between homogeneous states and morphologies exhibiting micro- to mesoscopic density fluctuations. Such modulated density fluctuations are typically classified as “intermediate-range order” (IRO) because, for this class of morphologies, the structure factor displays a characteristic pre-peak at a low but nonzero wavenumber Sear and Gelbart (1999); Pini et al. (2000); Wu et al. (2004); Liu, Chen, and Chen (2005); Broccio et al. (2006); Bomont, Bretonnet, and Costa (2010); Kim et al. (2011); Liu et al. (2011); Godfrin et al. (2013, 2014); Cigala et al. (2015). In turn, the emergence of IRO can greatly impact the mechanical, optical, electronic, etc. properties of such systems, and the ability to detect, characterize, and ultimately engineer the emergence of IRO structure can facilitate new material processing methods Herr (2011); Bates et al. (2012); Johnston et al. (2012).
This publication concentrates on an IRO morphology of increasing fundamental and technological interest: the equilibrium cluster phase. Such a phase comprises self-terminating, finite-sized clusters composed of solute monomers (i.e., primary particles); the clusters themselves are ideally dense, amorphous, and relatively monodisperse in terms of their size 111Note that clusters are differentiated from aggregates such as micelles because the characteristic size of the former need not be set by the monomer size.. They coexist with a continuous (interstitial) low-density population of monomers; thus, reversible transformations between homogeneous phases (where monomers are well-dispersed) and cluster phases can be viewed as microscopic analogues of macroscopic liquid-gas separation.
Self-limiting cluster phases have been studied via theory, computer simulations, and experiments of various idealized Groenewold and Kegel (2001); Sciortino et al. (2004); Archer and Wilding (2007); Toledano, Sciortino, and Zaccarelli (2009); Jiang and Wu (2009); Bomont et al. (2012); Godfrin et al. (2013, 2014); Mani et al. (2014); Sweatman, Fartaria, and Lue (2014); Jadrich et al. (2015a); Nguyen et al. (2015); Zhuang and Charbonneau (2016) or archetypal colloidal suspensions (e.g., polystyrene spheres) Campbell et al. (2005); Klix, Royall, and Tanaka (2010); Zhang et al. (2012); Xia et al. (2012) and more complex constituent monomers like proteins Yethiraj and van Blaaderen (2003); Stradner et al. (2004); Porcar et al. (2010); Liu et al. (2011); Johnston et al. (2012, 2012); Yearley et al. (2014); Godfrin et al. (2016), organic-inorganic complexes Park et al. (2014), etc. The generic clustering behavior is attributed to a common physical paradigm: aggregates form due to a competition between short-range attractions that drive monomer association and long-range repulsions that collectively build up to attenuate growth. The former can be realized in colloidal suspensions via, e.g., the introduction of crowder molecules (e.g., non-interacting polymers) that induce depletion attractions, while the latter are attributable to (typically weakly-screened) electrostatic interactions between the ionic double-layers of nearby monomers due to their surface charges Sciortino et al. (2004); Klix, Royall, and Tanaka (2010); Israelachvili (2011).
Despite the attention directed at colloidal suspensions that form cluster phases, there remain basic knowledge gaps regarding their behavior and characterization, particularly in terms of how the shape of the structure factor relates to real-space morphology. To wit, while characteristic clusters must be reflected by the existence of an IRO pre-peak in , it has also been recognized that suspensions can exhibit IRO pre-peaks without having formed monodisperse multi-particle aggregates Liu et al. (2011); Godfrin et al. (2013, 2014). In other words, it is difficult even to positively detect cluster phases versus either effectively homogeneous phases (exhibiting some other form of IRO) or, alternatively, percolated gel phases. Meanwhile, it remains unclear which morphological lengthscale(s) (e.g., cluster size, intercluster spacing) the wavenumber (position) of the IRO pre-peak captures, or whether it is sensitive to conditions like bulk monomer density Sciortino et al. (2004); Stradner et al. (2004); Shukla et al. (2008); Stradner et al. (2008); Godfrin et al. (2013).
Being able to describe cluster morphologies by decoding would be conceptually powerful because it would allow one to obtain knowledge about multi-body structure based on pair correlations alone; it is also of practical interest because in situ measurements of pair correlations are feasible for a wide range of soft matter systems and lengthscales, including nanoscopic primary particles and aggregates. In this vein, our goal here is to use integral equation theory and computer simulations to unambiguously and simultaneously characterize profiles and corresponding suspension morphologies for a canonical pairwise interaction model that generates clusters, with a particular emphasis on surveying wide ranges of conditions that might be accessed through experimentally tunable parameters, including monomer packing fraction , monomer surface charge , suspension (Debye) screening length , and short-range attraction strength .
Based on our analysis of these model fluids, we first systematically expand upon previous findings Liu et al. (2011); Godfrin et al. (2013, 2014) to demonstrate the poor correlation between the emergence of the IRO pre-peak in and the onset (or even energetic favorability) of self-limited clustering. We next demonstrate that the pre-peak position is dependent upon both cluster size in terms of number of monomers and average monomer density, and that it directly quantifies the average real-space intercluster separation. We then test two criteria based on that have been postulated to pinpoint the onset of clustering (and thus positively detect cluster morphologies), which are based on the IRO pre-peak height Godfrin et al. (2013, 2014) and width Jadrich et al. (2015a), respectively. We find that the criterion based on the pre-peak width, which encodes the IRO thermal correlation length, is a more robust (albeit still only approximate) predictor of the onset of clustering. Finally, we note that beyond this work, our accompanying publication focuses on describing self-limited cluster phases with free energy models adapted from classical nucleation theory.
II Methods
II.1 Model interactions
We focus on one of the simplest colloidal models Sciortino et al. (2004) known to generate equilibrium cluster phases: a pair potential that combines a short-range attraction (SA) with a long-range repulsion (LR). The so-called SALR potential can be expressed
| (1) |
where ( is Boltzmann’s constant and is temperature); is the non-dimensionalized interparticle separation; is the characteristic particle diameter. Note that we generalize the pair potential to account for multicomponent (here, size-polydisperse) suspensions where two interacting particles are of types and , respectively.
When conducting simulations (see Section II.3), we follow previous work and simulate three-component mixtures that approximate suspensions with 10% size polydispersity; this favors the formation of amorphous fluid clusters, rather than the microcrystalline (often elongated) aggregates that result from monodisperse monomers Jadrich et al. (2015a, b). In this context, the generalized interparticle distance in Eqn. 1 is defined , where corresponds to small, medium, and large particles, respectively, and is a perturbation to particle diameter. Specifically, we study mixtures comprised of 20% small, 60% medium (characteristic size ), and 20% large particles with .
Short-range attractions can be realized in colloidal suspensions via the introduction of depletant molecules with exclusion volumes smaller than that of the primary particles. These depletion attractions are represented via a generalized (100-50) Lennard-Jones interaction
| (2) |
where the lengthscale of the attractive well is approximately . Here, is the baseline attraction strength between monomers and is an energetic perturbation that biases against demixing.
Long-ranged repulsions can be attributed to screened electrostatic interactions between the charge sites located on the surfaces of monomer particles. Ignoring long-range multi-body interactions Pandav, Pryamitsyn, and Ganesan (2015); Pandav et al. (2015) and microscopic mechanisms of ion dissociation Manning (1979); Alexander et al. (1984); Ramanathan (1988); Gillespie et al. (2014), one can approximate this effect via the electrostatic portion of the Derjaguin-Landau-Verwey-Overbeek (DLVO) potential Derjaguin and Landau (1941); Verwey and Overbeek (1948); Israelachvili (2011)
| (3) |
with
| (4) |
where is the maximum electrostatic barrier between particles at contact, is the Debye-Hückel screening length, is the total surface charge per monomer (assumed evenly distributed), and is the Bjerrum length of the solvent.
With respect to experimental realization, recall that not all of these quantities are independent, as and , where is the vacuum permittivity, is the relative permittivity, is Avogadro’s number, is the elementary charge, and is the ionic strength of the suspending solvent. Experimentally tunable parameters are essentially , , and (and, practically, even some of these may be interdependent). In our analysis, we choose to fix the relative Bjerrum length at (corresponding to, e.g., nm monomers suspended in room temperature water with nm), which means electrostatic effects are set via and . (Choosing a different reference renormalizes the values under consideration; see the companion paper.)
To examine model behavior at a given monomer packing fraction (where is number density), we set various combinations of and and then independently vary the depletion attraction strength . This treatment mimics how short- and long-range aspects of constituent interactions are approximately orthogonal for colloidal suspensions, and is worth noting as it is in contrast to some studies where attractions and repulsions are simultaneously scaled via changing Sciortino et al. (2004); Toledano, Sciortino, and Zaccarelli (2009); Godfrin et al. (2014). Finally, note that throughout the remainder of the publication, we notate as for aesthetic simplicity (unless otherwise indicated).
II.2 Integral equation theory
We execute integral equation theory (IET) calculations to efficiently predict across wide ranges of the parameter space (, , ) underlying the pair interactions . In brief, IET partitions the total correlation function (where is the radial distribution function) into pair and multibody contributions by introducing the direct correlation function in the context of the Ornstein-Zernike (OZ) relation:
| (5) |
In order to use Eqn. 5, we require an accompanying closure expression that relates , and . Because our systems have potentials resembling Coulombic interactions, we follow our previous work Jadrich et al. (2015a) and employ the optimized random phase approximation (ORPA) Andersen, Chandler, and Weeks (1972); Hansen and McDonald (2006). The ORPA formulation we use treats the direct correlation function as , where the first two terms constitute a large- perturbation to the of an underlying reference system. We use the Mayer function to capture effects outside the core because it provides improved results when deep and narrow attraction wells are included in the pair potential Hansen and McDonald (2006). Meanwhile, for , while at short-range it is optimized to enforce for (i.e., to exactly incorporate effects of a reference hard-sphere fluid). Note that in performing these calculations, we do not explicitly enforce thermodynamic self-consistency, which has been shown to provide very strong quantitative agreement between analytical and simulation results for complex fluids Bergenholtz, Wagner, and D’Aguanno (1996); Bomont, Bretonnet, and Costa (2010); Kim et al. (2011). As discussed in Section III, we are mainly interested in using IET to capture general trends in pair structural behavior over wide ranges in model parameter space; for these purposes, our approximate approach is practical and reasonably reflects simulation results Jadrich et al. (2015a).
In practice, we conduct our IET calculations using the single-component monodisperse pair potential (i.e., ), where we fix and and then systematically increase after beginning at vanishing attraction strength. Upon numerical solution at a given , is obtained via the relation , where and FT is a Fourier transform.
II.3 Molecular dynamics simulations
We perform three-dimensional (3D) MD simulations of the ternary SALR mixtures in the NVT ensemble with periodic boundary conditions using LAMMPS Plimpton (1995). We use an integration time-step of (taking the mass ), and fix temperature via a Nosé-Hoover thermostat with time-constant . The pair potential for a given and is cut-off such the that interaction strength at distance (note explicit use of the mixture notation) is and the force is simultaneously .
We examine bulk monomer packing fractions , 0.030, 0.060, and 0.120 using systems of , 2960, 6800, and 6800 particles, respectively. Starting from randomized initial configurations, we allow systems at , 0.030, 0.060, and 0.120 to equilibrate for , , , and steps, respectively. (Lower packing fractions require relatively more equilibration time given less frequent monomer-monomer collisions.) We have confirmed that these equilibration times are sufficient by (1) checking that energies have converged and (2) by visualizing the trajectories to check that clusters undergo frequent intracluster rearrangements and intercluster exchanges (i.e., that individual particles ergodically sample the simulation space). Regarding the latter, we indeed find that by employing the lightly polydisperse mixture that we developed and used previously Jadrich et al. (2015a, b), we avoid the formation of highly-arrested microcrystalline phases typical of monodisperse models.
| Z | ||||||||
| 3 | 4 | 6 | 8 | 10 | 12 | 15 | ||
| 0.7 | - | - | - | - | - | - | 6.55 | |
| 0.8 | - | - | - | - | - | - | 6.80 | |
| 1.0 | - | - | - | 5.55 | 6.00 | 6.40 | 7.10 | |
| 1.2 | - | - | - | 5.65 | 6.10 | - | - | |
| 1.5 | - | - | 5.35 | 5.80 | 6.30 | 6.80 | - | |
| 2.0 | - | 5.05 | 5.50 | 5.95 | 6.45 | 7.00 | 7.90 | |
| 2.5 | - | - | 5.55 | 6.00 | 6.60 | - | - | |
| 3.0 | - | 5.10 | 5.55 | 6.05 | 6.60 | - | - | |
| 4.0 | 4.95 | 5.10 | 5.60 | 6.10 | 6.65 | - | - | |
| 0.7 | - | - | - | - | - | - | 6.30 | |
| 0.8 | - | - | - | - | - | - | - | |
| 1.0 | - | - | - | 5.30 | 5.70 | 6.15 | 6.75 | |
| 1.2 | - | - | - | 5.45 | 5.80 | - | - | |
| 1.5 | - | - | 5.15 | 5.55 | 5.95 | 6.45 | - | |
| 2.0 | - | 4.80 | 5.20 | 5.65 | 6.10 | 6.55 | 7.25 | |
| 2.5 | - | - | 5.20 | 5.70 | 6.20 | - | - | |
| 3.0 | - | 4.90 | 5.25 | 5.70 | 6.20 | - | - | |
| 4.0 | 4.70 | 4.90 | 5.30 | 5.70 | 6.20 | - | - | |
| 0.7 | - | - | - | - | - | - | 6.00 | |
| 0.8 | - | - | - | - | - | - | - | |
| 1.0 | - | - | - | 5.00 | 5.40 | 5.65 | 6.25 | |
| 1.2 | - | - | 4.75 | 5.10 | 5.45 | - | - | |
| 1.5 | - | - | 4.80 | 5.15 | 5.50 | 5.80 | - | |
| 2.0 | - | 4.55 | 4.85 | 5.20 | 5.55 | 5.80 | 6.40 | |
| 2.5 | - | - | 4.90 | 5.20 | 5.60 | - | - | |
| 3.0 | - | 4.60 | 4.85 | - | 5.60 | - | - | |
| 4.0 | 4.40 | 4.60 | 4.85 | 5.20 | 5.60 | - | - | |
| 0.7 | - | - | - | - | - | - | 5.20 | |
| 0.8 | - | - | - | - | - | - | 5.20 | |
| 1.0 | - | - | - | - | - | 4.95 | 5.20 | |
| 1.2 | - | - | - | - | - | - | - | |
| 1.5 | - | - | - | - | 4.75 | 4.95 | 5.20 | |
| 2.0 | - | - | - | 4.60 | 4.75 | 4.95 | - | |
| 2.5 | - | - | - | 4.60 | - | - | - | |
| 3.0 | - | - | - | - | - | - | - | |
| 4.0 | - | - | - | - | - | - | - | |
To characterize pair correlations, we calculate the structure factor via numerical Fourier Transform inversion of the radial distribution function . To characterize multibody structure, we calculate cluster-size distributions (CSDs), which quantify the probability of observing aggregates comprising particles. Following previous studies Sciortino et al. (2004); Godfrin et al. (2014); Mani et al. (2014); Jadrich et al. (2015a), two monomers are considered part of the same aggregate if they are located within the range of the attractive well (i.e., are direct neighbors) and/or they are both direct neighbors with at least one common particle (i.e., are connected via some percolating pathway).
For consistency across many packing fractions and cluster sizes, we consider a phase clustered with characteristic aggregate size based on the following criteria: (1) the distribution exhibits a visibly-apparent local maximum (mode) at some , where the corresponding local minimum between and is notated as ; and (2) that at least 80% of the particles in the system participate in aggregates of size . Thus, in this framework, the onset of clustering occurs when , where is appropriately normalized. In turn, we identify the critical attraction strengths best meeting this condition by examining CSDs of simulations performed in increments of . All of the combinations of , , and analyzed via simulations (where cluster phases could be found) are listed in Table I by their respective values.
To characterize the lengthscales and shapes of the -sized clusters, we calculate the radius of gyration and the relative shape anisotropy . We first calculate the gyration tensor , where the elements are and is the the position of the -th particle participating in the cluster in the -th Cartesian coordinate (, , or ). The radius of gyration is then given by , where , , and are the eigenvalues of in order of magnitude . The well-established relative shape anisotropy Theodorou and Suter (1985) is calculated via , which is bounded between 0 and 1: corresponds to points (particle centers) that are symmetrically distributed and corresponds to points arranged linearly. To slightly smooth over instantaneous cluster distortions (e.g., when the outer edge is distended due to an imminent particle exchange), measurements of and are derived from tensors collected over blocks of 10 individual clusters (where particle positions are renormalized relative to the respective centers of mass of the clusters); in turn, average and error values are based on 500 of these measurements.
III Results & Discussion
III.1 IRO pre-peak formation, clustering, and macroscopic phase separation
We begin our discussion by considering the existence of a low-wavenumber pre-peak in the structure factor , which emerges at a position lower than that of the primary peak associated with monomer-monomer packing effects located at (i.e., a real-space lengthscale of ). A pre-peak position of is associated with suspensions dominated by short-range attractions, where such a pre-peak corresponds to (infinitely) long-ranged, densified regions and diverges in magnitude at the onset of macroscopic liquid-gas phase separation Hansen and McDonald (2006). On the other hand, phases composed of self-terminating microscopic clusters must exhibit an intermediate-range order (IRO) peak at some wavenumber due to their modulated structure; however, as discussed above, it is tentatively understood that not every state exhibiting an IRO peak is actually comprised of characteristically-sized clusters Liu et al. (2011); Godfrin et al. (2013, 2014).
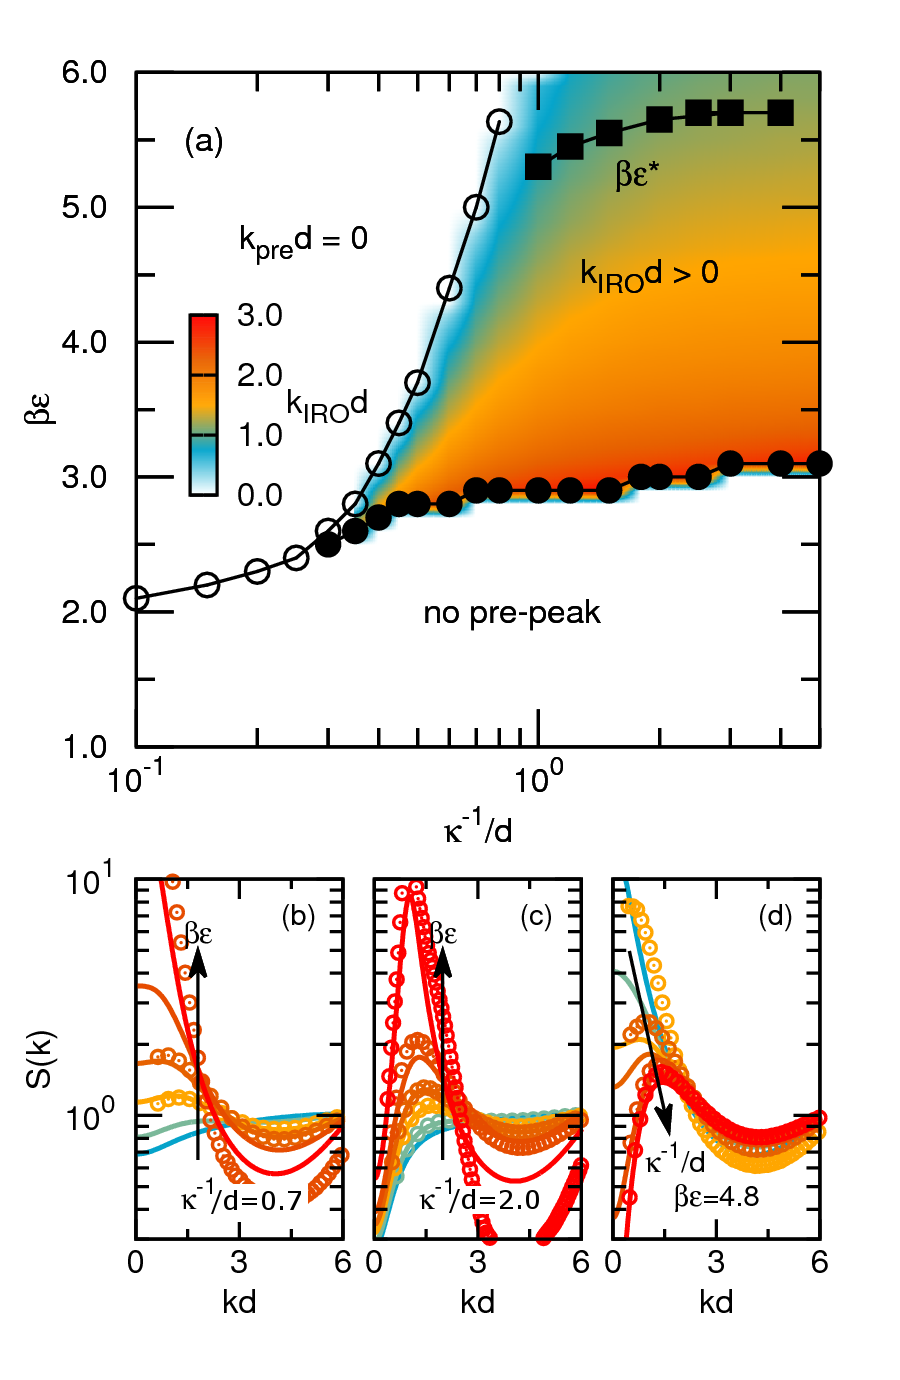
In Fig. 1, we build upon these basic guidelines by examining an SALR system where we fix charge and packing fraction while varying attraction strength and screening length over wide ranges. This allows us to: (1) systematically map out how the existence of the pre-peak and its position relate to some of the tunable parameters controlling interparticle interactions and phase behavior; and (2) consider how the parameter space where IRO pre-peaks exist compares to the parameter space where clusters emerge. In Fig. 1(a), we make the mapping tractable by using IET calculations with the approximate ORPA closure (see Methods) that can efficiently survey parameter space; to address the latter comparison, we plot the line of critical attraction strength observed in MD simulations (where we can directly characterize multi-body structure), which corresponds to the onset of clustering at a given . Meanwhile, in Figs. 1(b-d), we show selected series of profiles obtained from IET and simulations to illustrate the pre-peak shapes that correspond to the positions in Fig. 1(a). Note that here we are using an approximate closure and making comparisons between monodisperse IET calculations and lightly polydisperse MD simulations; thus, while we cannot expect perfect agreement between the methods, we do observe qualitative agreement in terms of the evolution of even in regions where is changing rapidly (as exemplified in Figs. 1(b-d) and elsewhere Jadrich et al. (2015a)). Nonetheless, we restrict our comments below to general trends that should not be sensitive to these types of methodological choices.
Focusing on Fig. 1(a), it is apparent that for any given repulsive interaction, it is only above a sufficiently strong attraction that a pre-peak of any position forms. As might be anticipated, a pre-peak forms in the limit of small screening lengths, while at sufficiently large screening lengths (), one observes an IRO pre-peak at that grows in from higher to lower -values with increasing attractions. Moving left-to-right in the direction of increasing screening length, the transition between and (where the zero-wavenumber convexity switches from negative to positive) is termed a Lifshitz point, which is a common feature of fluids with generic SALR interactions Sear and Gelbart (1999); Pini et al. (2000); Cigala et al. (2015). Generally-speaking, to reach this transition, repulsions must not only exist but must also be sufficiently competitive relative to attractions to favor modulated phases (minimum threshold repulsion strengths are known analytically for some temperature-controlled systems Pini et al. (2000)). In the parameter space here, this condition means that given a surface charge , one requires a minimum to generate repulsions that can collectively stabilize aggregates once attractions start to pull monomers together.
From Fig. 1(a), one can also readily appreciate that the presence of an IRO pre-peak is a poor indicator of: (1) whether a particular state is composed of clusters; and (2) whether the charge-charge repulsions are even strong enough to favor persistent modulated structure. The first point has been postulated previously Liu et al. (2011); Godfrin et al. (2013, 2014), and here is bolstered by the considerable discrepancy between the region of parameter space where an IRO pre-peak is observed and the region where formation of clusters occurs (i.e., at and above locus of ). To wit, there is a energy differential of between the emergence of the IRO pre-peak and the emergence of clusters over many screening lengths.
Meanwhile, one can also observe a second transition in the peak behavior of Fig. 1(a) within the screening length range : moving in the direction of increasing attraction strength, an IRO pre-peak initially develops, but subsequently shifts to while the system bypasses the formation of a cluster phase. Crossing this type of (reverse) Lifshitz boundary is readily attributable to the physical setup we consider, where attraction strength is “decoupled” from repulsions; after all, one should arguably be able to ramp up attractions to such high strengths that macrophase separation is favorable given even relatively strong repulsions. (Alternatively, our previous work illustrates this switch for one case of extremely weak repulsions Jadrich et al. (2015a).) This shift from to is exemplified in Fig. 1(b), which can be contrasted with Fig. 1(c), which shows an series at larger where the IRO pre-peak persists and grows once it emerges. (These behaviors are rounded out by panel Fig. 1(d), which gives a representative series of a system shifting from a to pre-peak.) Taking these two observations together, one must keep in mind that IRO pre-peak existence can not only considerably precede cluster formation, but can be very misleading at intermediate screening lengths where existence does not even universally signal that increasing attraction strength will result in formation of stable clusters.
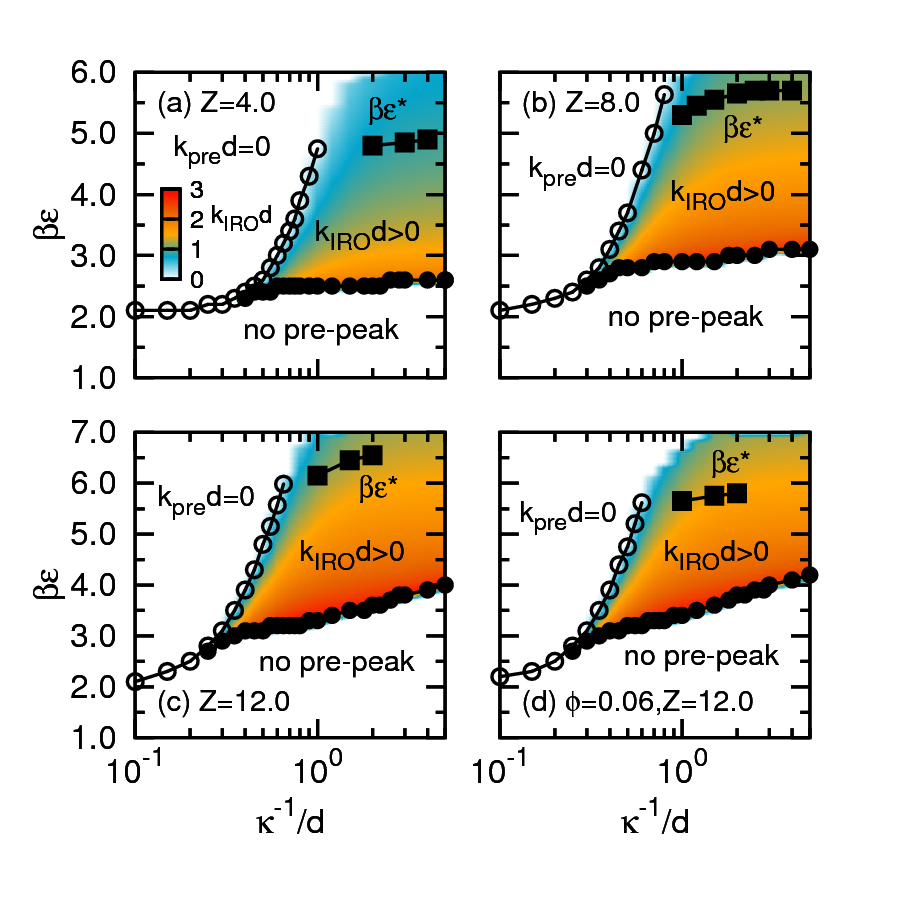
To demonstrate that the qualitative trends of pre-peak existence and position shown in Fig. 1 are relatively generic, we show in Fig. 2 a representative series of pre-peak landscapes for various charges (at fixed ), and a comparison between landscapes for different (at fixed ). Despite the varying conditions, we generally find: (1) that given sufficient integrated repulsions, the formation of an IRO pre-peak precedes cluster formation by a differential in attraction strength upwards of to ; (2) that there exist intermediate ranges of where IRO pre-peaks shift to prior to clustering; and (3) that formation of finite-sized aggregates is very unlikely for screening lengths , though we cannot definitively rule out the possibility.
Indeed, the primary differences across these various conditions are systematic shifts in the critical attraction strength to form clusters. The locus of shifts to higher values as surface charge increases due to the need to overcome greater charge-charge repulsions. In contrast, for fixed and , the critical attraction strength decreases by between approximately and when is doubled (trend applies from ) because this reduces the effective energetic barrier for bringing particles from the reference pair distance of the homogeneous dispersion to the contact distance in aggregates.
As a final point, we note that for a given charge , the range in over which the dense phase moves between an infinite scale (i.e., macroscopic liquid-gas separation) at small to an asymptotic modulated structure (given sufficient charge ) at large is quite narrow. Moving horizontally at, e.g., , across any of the landscapes of Figs. 1 and 2, the pre-peak moves from at to an approximately constant for . Thus, one effectively reaches the Coulombic limit in terms of the repulsion influence for screening lengths approaching only a few monomer diameters.
III.2 Cluster morphologies in simulations
To forge connections between the IRO pre-peak in and the real-space morphologies observed in SALR systems, we analyze 3D configurations of approximately 100 different clustered phases generated via MD simulations, where we can obtain while simultaneously measuring the number-size and real-space lengthscales associated with the aggregates. We consider cluster phases formed for wide ranges of , , , where, for the sake of consistency, we specifically concern ourselves with states at the onset of clustering where aggregates of a preferred size have emerged. These states are defined by critical attraction strengths , where all of the state points that are analyzed in the following sections are listed in Table I by their respective values.)
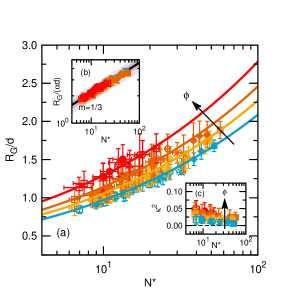
As demonstrated in Figs. 3 and 4, we examine phases comprising clusters in the size range that are compact and spherically symmetric on average, making these states promising for interpretation because they are relatively simple (idealized) in terms of their morphologies. We first consider Figs. 3(a) and 3(b), where we show that plotting the radius of gyration versus cluster size follows the relation
| (6) |
where is a -dependent prefactor on the order of (hereafter notated ) and is the fractal dimension of the aggregates. The fractal dimension signifies that the clusters are compact objects, in contrast with aggregates that are more highly-branched and/or elongated, which would tend to exhibit . Likewise, the magnitudes of the prefactors underline that these aggregates have high internal packing fractions, though we do see a modest positive correlation between and given fixed . This indicates that clusters are slightly less dense given closer intercluster proximity, which can be attributed to more frequent monomer exchanges that tend to instantaneously (but, on average, isotropically) enlarge the clusters compared to their “isolated” structure at very low packing fractions, e.g., .
Meanwhile, measurements of the relative shape anisotropy , which are shown in Fig. 3(c), demonstrate that these cluster objects are highly symmetric even down to small sizes . Here, we calculate the long-established parameter , where corresponds to points (particles) that are symmetrically distributed and corresponds to points arranged linearly Theodorou and Suter (1985). Calculated based on the monomer positions within the clusters, we find for all cluster sizes and packing fractions, which indicates symmetric arrangements of particles and complements the -based findings above that mainly imply compactness. Specifically, we observe (very high symmetry) for the most isolated clusters at , and a slight positive correlation between and that implies aggregate symmetry is somewhat sensitive to the increasing frequency of (near-)collisions and monomer-exchanges, which tend to generate outlying particles and instantaneously distorted states that positively contribute to .
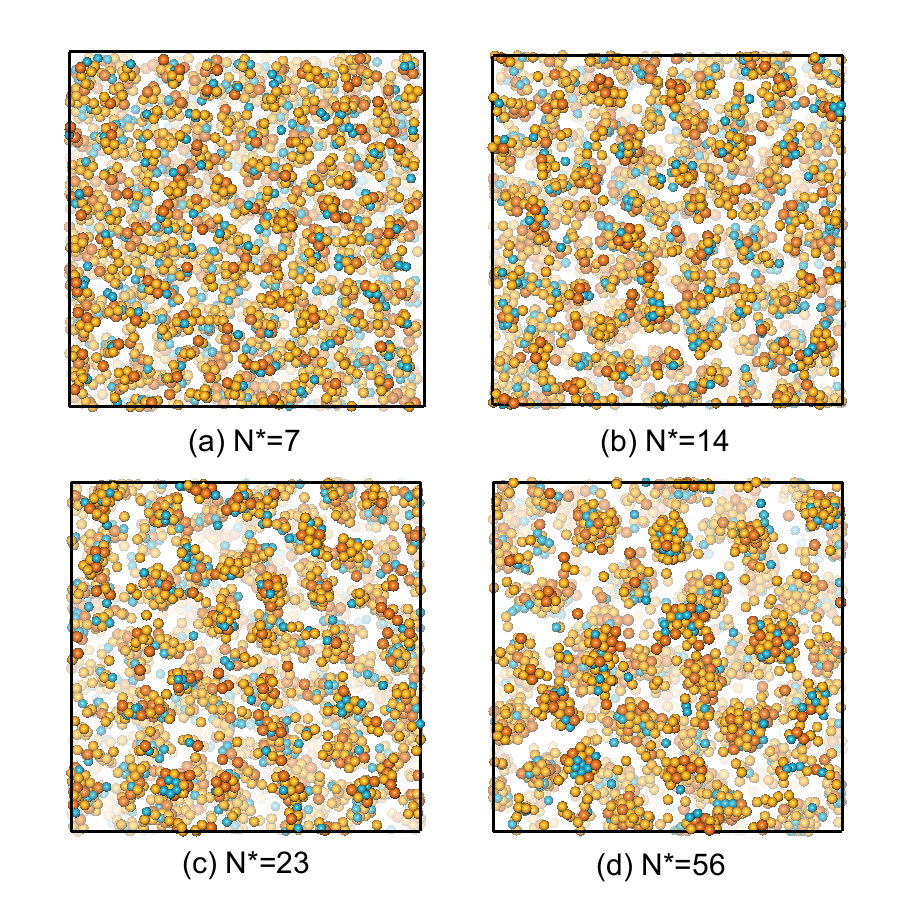
As illustrated in Fig. 4, visualizations of the cluster phases complement the findings above: the aggregates formed in these systems are highly-compact and roughly spherical on average; furthermore, based on these attributes and the size-scaling of the aggregates, we estimate the typical internal packing fraction of the clusters is . To wit, we observe good mixing of the polydisperse monomers, which frustrates intracluster crystallization and promotes intra- and intercluster diffusion. One can also appreciate the preferred sphericity of the clusters, though this can be instantaneously violated as clusters collide, merge, or exchange monomers. Given the clusters are spherical, we can estimate the internal packing fraction using the expression where and are the volumes of the monomer and cluster, respectively (here we assume monodisperse monomer). We then estimate the -dependent cluster radius as where the latter coefficient is added because is based on particle centers. Using the relation gives over the range , with the majority of sizes . This is comparable with dense simple fluids.
Finally, in line with the observations of Godfrin et. al. Godfrin et al. (2014), we find that the emergent aggregates universally exhibit average intracluster coordination numbers (i.e., numbers of nearest-neighbors) of , which is the well-established minimum coordination number corresponding to rigid percolation He and Thorpe (1985). Predictably, grows with respect to cluster size, where the scaling relationship between these two quantities is important for understanding the thermodynamics of cluster formation. We refer the reader to the accompanying publication for a more extensive discussion.
III.3 Interpreting the IRO pre-peak position
Based on our collection of simulated cluster morphologies, we first address what physical characteristic(s) of these morphologies that the IRO pre-peak position in captures. This is important because while the real-space lengthscale captured by the inverse pre-peak position is generally thought to encode the real-space cluster diameter (or perhaps intercluster center of mass separation), there has been limited information available allowing for an unambiguous determination of what lengthscale(s) truly captures. As such, there is not yet consensus about whether the pre-peak position should exhibit a systematic dependence upon bulk monomer density Sciortino et al. (2004); Stradner et al. (2004); Shukla et al. (2008); Stradner et al. (2008); Bomont, Bretonnet, and Costa (2010); Godfrin et al. (2013). In other words, if similarly sized clusters are found at two densities, should pre-peak position be the same?
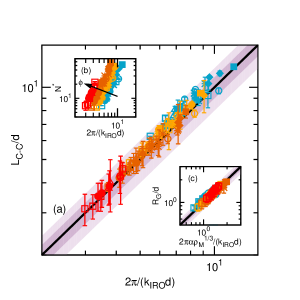
Focusing on Fig. 5, we find that the real-space lengthscale is equivalent to the average center-to-center intercluster distance . A direct comparison between the two quantities is presented in Fig. 5(a), which demonstrates excellent quantitative agreement, and Fig. 5(b) makes it clear that the pre-peak lengthscale is correspondingly a function of both cluster size and bulk monomer density . To understand why this is so, let us consider the number density of clusters , where is the number of clusters in the simulation assuming perfect size-uniformity and is the simulation box length. We can then write , where the second equality is simply due to the definition of the bulk monomer density . Since, in the crudest sense, the average intercluster distance , we thus have:
| (7) |
As is evident from Fig. 5(a), there is excellent collapse in the data along Eqn. 7 for all of the cluster phases tested.
This analysis assumes nothing about the shape and/or compactness of the clusters (only that they are distinguishable and of number-size ), which has two implications: one can readily obtain cluster size given knowledge of and ; however, to obtain a real-space cluster diameter, one must independently possess an empirical relation between and cluster diameter (or, e.g., ). Of course, given our systems exhibit the size-scaling of Eqn. 6, we demonstrate in Fig. 5(c) that this type of conversion from pre-peak position to cluster radius is quantitative. Finally, though this model for pre-peak position assumes little about the nature of the aggregates, we cannot rule out that the strength of the quantitative match between and may diminish for less-idealized morphologies that are not primarily composed of highly-packed spherical clusters.
III.4 Detecting the onset of clustering based on
As already discussed, the existence of an IRO pre-peak is necessary but not sufficient evidence for positively identifying a clustered phase. In this section, we draw on our results from simulations to directly test two criteria postulated to detect the transformation between homogeneous and clustered phases: one based on the IRO pre-peak height (i.e., magnitude) and one based on the IRO pre-peak width.
III.4.1 IRO pre-peak height
We begin by revisiting previous reports Godfrin et al. (2013, 2014) that the onset of clustering occurs as the pre-peak height (magnitude) reaches the threshold value . In brief, this is an adaptation of the empirical Hansen-Verlet freezing rule developed for simple fluids Hansen and Verlet (1969), which states that the height of the first pre-peak in the structure factor approaches at the fluid-solid transition (i.e., along the melting line). In this way, the clustering criterion is conceptually like considering cluster formation as a microcrystallization event, i.e., a frustrated analog of the bulk freezing transition. However, this criterion for identifying clustering has only been tested for a limited scope of repulsions strengths and lengthscales, generally in schemes (unlike the protocol here) where attraction and repulsions strengths have been simultaneously rescaled by modulating .
In Fig. 6, we plot the magnitudes of the IRO pre-peaks in measured from simulations at the onset of clustering for our different systems, where we observe that for the majority of cases tested, the peak-height considerably exceeds (by up to an order of magnitude) the threshold. In essence, the criterion does not generally pinpoint the emergence of aggregates with a characteristic size because many dispersed states (and/or states exhibiting generic amorphous IRO) at a given and exhibit IRO pre-peaks with heights of well before attractions are actually strong enough to stabilize clusters. Thus, one might instead posit that the condition is a necessary but not sufficient criterion for positively identifying clustered phases.
Broadly speaking, the criterion acts only as a minimum threshold because pre-peak height is highly-coupled to the limit of , which is proportional to system compressibility Hansen and McDonald (2006). To wit, the states where the values most exceed the limit at are those governed by relatively weak repulsions (correlated with larger in Fig. 6) and lower , both of which contribute to high . Thus, an IRO pre-peak height can reach large values even as the pre-peak signature itself may be rather weak (i.e., flat, especially away from the clustering locus), simply due to the leading influence of the high-magnitude low- limit. This type of coupling between the pre-peak and zero-wavenumber limit is evident even at “moderate” packing fractions like , as shown in Figs. 6(b) and (c): relatively low-strength repulsions combined with the increasing attractions generating heterogeneity drive compressibility to high values (e.g., greater than 1), with the pre-peak emerging and sharpening at correspondingly large magnitudes.
More conceptually, it should perhaps be unsurprising that the Hansen-Verlet freezing rule is a poor fit for these systems. In essence, the rule was developed based on suspensions undergoing solidification due to packing effects; however, clustering in an SALR system is driven not by a competition between configurational free volumes, but by a competition between attractions and repulsions. In turn, while describing the cluster formation as “microcrystallization” seems fitting–especially for highly monodisperse monomers that form clusters with crystal motifs–it is a transformation more akin to a frustrated liquid-gas separation.
III.4.2 IRO pre-peak width
We now move on to test a recently proposed framework Jadrich et al. (2015a) for identifying the onset of clustering based the IRO pre-peak width, which encodes the thermal correlation length . Conceptually, the thermal correlation length quantifies the real-space persistence of structural correlations and is most frequently considered in the context of fluids undergoing macrophase liquid-gas separation (i.e., unstable droplet formation). In this context, constitutes a prefactor in the well-established Hansen and McDonald (2006) second-order inverse expansion of about the corresponding pre-peak at :
| (8) |
and one can identify the liquid-gas transition based on the divergence of , which signifies formation of “infinitely” persistent dense regions.
For clustering systems dominated by frustrated interactions, one can analogously consider the encoded in the IRO pre-peak, which quantifies the persistence of the modulated dense structure in the fluid characterized by the finite lengthscale . Here, the inverse expansion about the pre-peak can be written:
| (9) |
which can be readily rearranged to give:
| (10) |
This rearranged expression makes it clear that the combined prefactor is equivalent to the second-order coefficient in a Taylor series expansion of . This equivalence provides a highly practical expression for calculating the IRO thermal correlation length
| (11) |
where one must simply (1) record the pre-peak magnitude and (2) perform a polynomial fit about the pre-peak position to obtain the second-derivative.
In line with other systems that undergo frustrated microstructural transformations Schemmel et al. (2003), the peak-width clustering criterion posits that cluster formation should be characterized not by a true divergence in the IRO , but instead when the IRO first exceeds the only competing (characteristic) lengthscale in the system: the screening length of the repulsions . In other words, the onset of clustering should occur when the IRO thermal correlation length reaches the Debye screening length, i.e.,
| (12) |
The remainder of this section aims to provide greater physical intuition for this criterion and to demonstrate how it performs versus simulations.
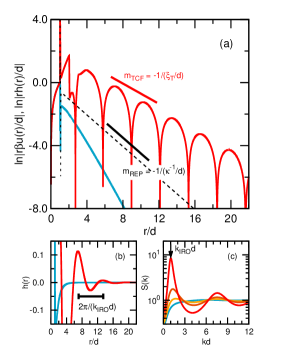
To get a better physical sense for this comparison between thermal correlation length and Debye length, consider Fig. 7(a), where we plot selected transforms of the total correlation function and the interparticle potential that highlight how the constants , and reflect the characteristic exponential decays (negative slopes) of the pair structural correlations and repulsive barrier, respectively. Here, while repulsions are obviously defined by the exponential decay in Eqn. 3, it is also worth recalling that pair correlations have the form Hansen and McDonald (2006)
| (13) |
where the cosine term captures the modulated nature of the IRO structure (it is not normally included for, e.g., simple fluids).
By examining the profiles in Fig. 7 calculated for conditions () exceeding the Eqn. 12 condition, we can readily glean the features of that characterize cluster phases in the IRO framework: oscillations (humps) in transformed that asymptotically decay more slowly than the potential (Fig. 7(a)), where these tell-tale oscillations mirror long-range oscillatory structure in that occurs on the lengthscale (Fig. 7(b)) and sets the pre-peak in (Fig. 7(c)). In contrast, for a dispersed phase (here, ), one observes (transformed or not) decay quickly to zero and display no characteristic oscillations at any intercluster lengthscale. Comparing these cases, it is clear that by searching for sufficiently strong IRO thermal correlation lengths , we are looking for states that exhibit persistent coordination shell structure in at a “cluster-sized” scale. This is intuitive given a clustered phase ideally comprises intermediate-scale densified regions exhibiting disordered fluid structure in themselves.
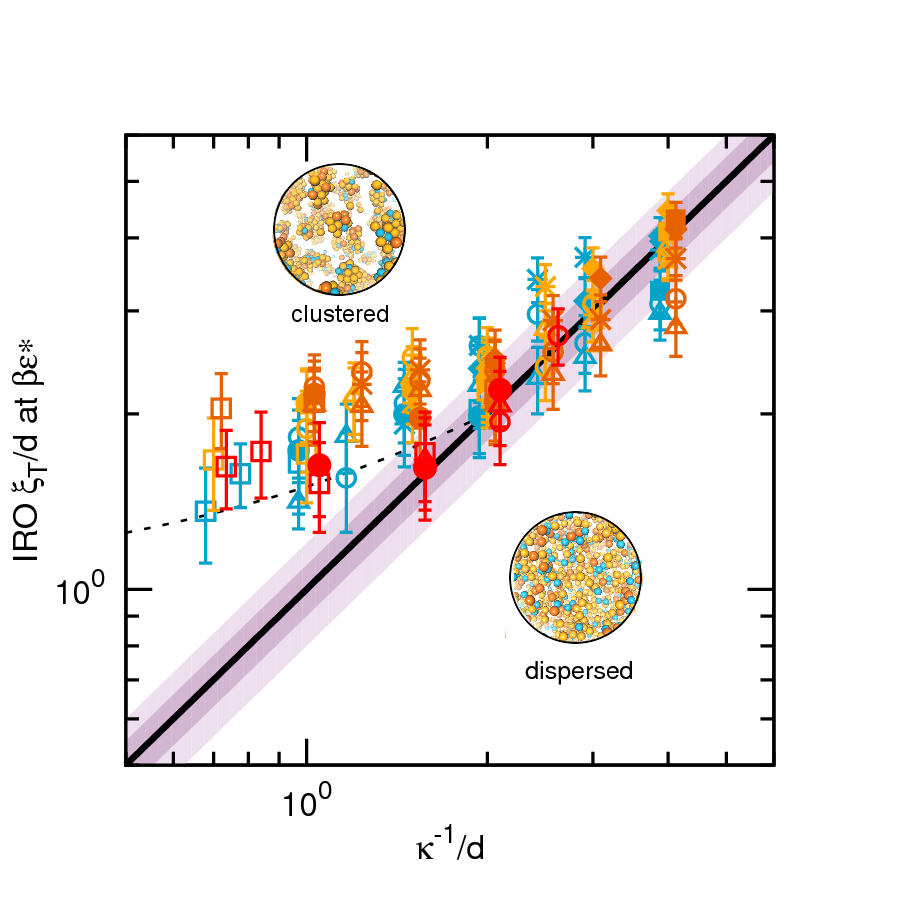
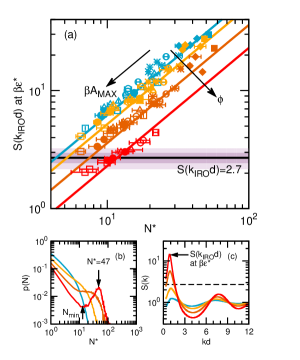
Finally, we consider Fig. 8, where we directly test the criterion by examining the profiles from our simulated systems at the onset of clustering (i.e., at ) and plotting the values extracted from the IRO pre-peaks versus the values defining the respective repulsive interactions. We obtain the values via Eqn. 11, where we measure the pre-peak position and magnitude and then calculate the second derivative of based on a third-order polynomial curve centered at and fitted over a range. To give a sense for the uncertainty in , note that we plot error bars corresponding to the standard deviation in values across the pre-peaks exhibited at attraction strengths and .
So how does the pre-peak width criterion perform? Fig. 8 demonstrates that the emergence of clusters occurs when the IRO for a wide variety of , , and conditions, provided the interactions are governed by sufficiently large screening lengths (). At smaller screening lengths, we clearly observe a systematic breakdown of the criterion shown by the empirical dashed line. In retrospect, this is somewhat unsurprising given that IRO pre-peaks manifesting equally diminutive correlation lengths would be very weak (flat), i.e., would not reflect persistent intercluster coordination shells. In turn, thinking about larger screening lengths beyond those tested (), we would note that the critical IRO likely exhibits weak dependence on because these systems effectively approach the Coulombic limit for (see Figs. 1 and 2 and accompanying publication). Indeed, given the spread in the data, there is already little discernible difference between the critical IRO values recorded from the simulation sweeps at and 4.0.
Taken altogether, we propose as a general guideline that to detect the onset of clustering, one search for the conditions at which the IRO thermal correlation length is within the range and where (given the discussion above) the pre-peak height simultaneously exceeds . This two-fold criterion is advantageous because it does not depend on screening length and, while this rule is necessarily inexact, it is nonetheless more empirically robust with respect to conditions (, , ), particularly over the intermediate screening lengths (one to three monomer diameters) common to clustering studies. We would also point out that this hybrid rule should serve as a lower bound with respect to for the appearance of clusters: above the critical , we have generally observed a bandwidth in attraction strength of before clusters start to form arrested percolated networks that are tentatively classified as thermoreversible gels Jadrich et al. (2015a).
In closing this discussion, we do note that the original pre-peak width criterion, which requires knowledge of , can be used based solely on knowledge of because one can not only extract the IRO , but also an estimate for . (This is an alternative approach to estimating based on , , , etc.) Here, one can recall Hansen and McDonald (2006) that the direct correlation function is generally understood to scale at long-range as . Given that and , one can: (1) measure ; (2) convert it ; (3) and readily obtain . This provides an approximate profile, which can be plotted (as in Fig. 7) to deduce from its slope at long distance. Thus, in principle, one can quantify the characteristic lengthscale of monomer-monomer repulsions in situ at arbitrary density.
IV Conclusions
We have tested how the existence, position, and shape of the IRO pre-peak in the structure factor can be interpreted for colloidal fluids that reversibly form self-limiting aggregate clusters due to isotropic competing SALR interactions between monomers. A major goal was to survey a wide array of parameter space spanning both monomer packing fraction () and the variables controlling monomer-monomer interactions (including attraction strength , surface charge , and screening length ). The bulk of our findings draw upon results from MD simulations of approximately 100 different phases located along the locus of cluster formation, which exhibited relatively idealized morphologies comprising compact spherical clusters.
First, both IET calculations and MD simulations systematically corroborate the previous observations Liu et al. (2011); Godfrin et al. (2013, 2014) that the existence of an IRO pre-peak in is a poor predictor of whether a phase is clustered. Notably, we observe that for many intermediate screening lengths (e.g., ), IRO pre-peaks can form at wavenumbers as increases, but subsequently shift to , which corresponds to macroscopic lengthscales, before any microscopic cluster phases can form. Thus, IRO pre-peak formation does not even guarantee that a particular set of conditions (, , ) favors self-limited aggregation at any .
Provided a phase is clustered, we find that the position (wavenumber) of the IRO pre-peak directly encodes the average real-space intercluster distance, where . This dependence on means that for fixed cluster size , will show a systematic rightward shift with increasing . We add a note of caution that one cannot directly derive a real-space cluster diameter from ; to obtain a cluster diameter, one one must possess an independent relation that can convert between and real-space lengthscale.
We next tested a previously-proposed criterion for detecting the onset of clustering based on the height (magnitude) of the IRO pre-peak, which states that the onset of clustering occurs when . Over our wide survey of states, we instead find that the pre-peak height at the onset of clustering frequently exceeds (by up to an order of magnitude) the threshold because of the coupling between the shape of the IRO pre-peak and the limit of , which equals the system compressibility and is highly sensitive to both and the strength and lengthscale of interparticle repulsions. Thus, the condition appears to be a minimum threshold for clustering, i.e., it is a necessary but not sufficient test for positively identifying clustered phases.
We then revisited an alternative criterion for detecting cluster formation based on IRO pre-peak width, which encodes the thermal correlation length , where the criterion states that the onset of clustering occurs when . We observe that this rule performs well for many different combinations of and provided that the screening length is in the range . However, the criterion breaks down at smaller because clustered phases, which are characterized intermediate-range coordination shells of aggregates, must correspondingly exhibit relatively large “threshold” IRO values.
Because both the pre-peak height and width criteria are only approximate across wide ranges of monomer interactions and packing fractions, we propose a hybrid heuristic for detecting the emergence of cluster phases based on : search for the conditions where (1) the pre-peak height exceeds and (2) the IRO thermal correlation length encoded in the pre-peak width simultaneously reaches the range . The combination of these attributes should ensure that there is both a very strong signature of IRO but also slowly-decaying modulated pair correlations corresponding to well-developed coordination-shell pair structure between clusters. And though inexact, this rule does not require knowledge of and should be reasonably robust to varying conditions and interparticle interactions.
In closing, we remark that beyond the connections considered here between pair correlations and clustering, there remain deep questions about whether one can alternatively identify conditions that favor clustering in SALR fluids based simply on the phase behavior of fluids with equivalent attractions but no repulsions, which exhibit macrophase separation. Indeed, previous work Godfrin et al. (2014) has pointed to strong (predictive) overlap between the onset of clustering and underlying purely-attractive binodal boundaries in systems where temperature is the controlling parameter; meanwhile, our related work on systems where attraction strength is the controlling parameter points to correspondence at least in the limit of very weak repulsions Jadrich et al. (2015a). A fruitful area of inquiry here would be to understand how closely one can map between the temperature- and attraction-strength-based frameworks, which would lend fundamental insights into when and how repulsions drive otherwise macrophase-separating systems to form equilibrium microphase morphologies.
V Acknowledgments
This work was partially supported by the National Science Foundation (1247945) and the Welch Foundation (F-1696). We acknowledge the Texas Advanced Computing Center (TACC) at The University of Texas at Austin for providing HPC resources.
References
- Seul and Andelman (1995) M. Seul and D. Andelman, “Domain shapes and patterns: The phenomenology of modulated phases,” Science 267, 476–483 (1995), http://science.sciencemag.org/content/267/5197/476.full.pdf .
- Langevin (1988) D. Langevin, “Microemulsions,” Acc. Chem. Res. 21, 255–260 (1988), http://dx.doi.org/10.1021/ar00151a001 .
- Helfand (1975) E. Helfand, “Block copolymers, polymer-polymer interfaces, and the theory of inhomogeneous polymers,” Acc. Chem. Res. 8, 295–299 (1975), http://dx.doi.org/10.1021/ar50093a002 .
- Hamley (2004) I. W. Hamley, “Introduction to block copolymers,” in Developments in Block Copolymer Science and Technology (John Wiley & Sons, Ltd, 2004) pp. 1–29.
- Zhang, Sun, and Yang (2012) X. Zhang, H. Sun, and S. Yang, “Self-limiting assembly of two-dimensional domains from graphene oxide at the air/water interface,” J. Phys. Chem. C 116, 19018–19024 (2012), http://dx.doi.org/10.1021/jp3051005 .
- Cynthia Goh, Goldburg, and Knobler (1987) M. Cynthia Goh, W. Goldburg, and C. Knobler, “Phase separation of a binary liquid mixture in a porous medium,” Phys. Rev. Lett. 58, 1008–1011 (1987).
- Schemmel et al. (2003) S. Schemmel, D. Akcakayiran, G. Rother, A. Brulet, B. Farago, T. Hellweg, and G. H. Findenegg, “Phase separation of a binary liquid system in controlled-pore glass,” MRS Proceedings 790, 1–6 (2003), http://dx.doi.org/10.1557/PROC-790-P7.2 .
- Jadrich and Schweizer (2014) R. B. Jadrich and K. S. Schweizer, “Directing colloidal assembly and a metal-insulator transition using a quench-disordered porous rod template,” Phys. Rev. Lett. 113, 208302 (2014).
- Sear and Gelbart (1999) R. P. Sear and W. M. Gelbart, “Microphase separation versus the vapor-liquid transition in systems of spherical particles,” J. Chem. Phys. 110, 4582–4588 (1999).
- Pini et al. (2000) D. Pini, G. Jialin, A. Parola, and L. Reatto, “Enhanced density fluctuations in fluid systems with competing interactions,” Chem. Phys. Lett. 327, 209 – 215 (2000).
- Wu et al. (2004) J. Wu, Y. Liu, W.-R. Chen, J. Cao, and S.-H. Chen, “Structural arrest transitions in fluids described by two yukawa potentials,” Phys. Rev. E 70, 050401 (2004).
- Liu, Chen, and Chen (2005) Y. Liu, W.-R. Chen, and S.-H. Chen, “Cluster formation in two-yukawa fluids,” J. Chem. Phys. 122, 044507 (2005).
- Broccio et al. (2006) M. Broccio, D. Costa, Y. Liu, and S.-H. Chen, “The structural properties of a two-yukawa fluid: Simulation and analytical results,” J. Chem. Phys. 124, 084501 (2006).
- Bomont, Bretonnet, and Costa (2010) J.-M. Bomont, J.-L. Bretonnet, and D. Costa, “Temperature study of cluster formation in two-yukawa fluids,” J. Chem. Phys. 132, 184508 (2010).
- Kim et al. (2011) J. M. Kim, R. Castañeda-Priego, Y. Liu, and N. J. Wagner, “On the importance of thermodynamic self-consistency for calculating clusterlike pair correlations in hard-core double yukawa fluids,” J. Chem. Phys. 134, 064904 (2011).
- Liu et al. (2011) Y. Liu, L. Porcar, J. Chen, W.-R. Chen, P. Falus, A. Faraone, E. Fratini, K. Hong, and P. Baglioni, “Lysozyme protein solution with an intermediate range order structure,” J. Phys. Chem. B 115, 7238–7247 (2011), http://dx.doi.org/10.1021/jp109333c .
- Godfrin et al. (2013) P. D. Godfrin, R. Castañeda-Priego, Y. Liu, and N. J. Wagner, “Intermediate range order and structure in colloidal dispersions with competing interactions,” J. Chem. Phys. 139, 154904 (2013).
- Godfrin et al. (2014) P. D. Godfrin, N. E. Valadez-Perez, R. Castañeda-Priego, N. J. Wagner, and Y. Liu, “Generalized phase behavior of cluster formation in colloidal dispersions with competing interactions,” Soft Matter 10, 5061–5071 (2014).
- Cigala et al. (2015) G. Cigala, D. Costa, J.-M. Bomont, and C. Caccamo, “Aggregate formation in a model fluid with microscopic piecewise-continuous competing interactions,” Molecular Physics 113, 2583–2592 (2015), http://dx.doi.org/10.1080/00268976.2015.1078006 .
- Herr (2011) D. J. Herr, “Directed block copolymer self-assembly for nanoelectronics fabrication,” J. Mater. Res. 26, 122–139 (2011).
- Bates et al. (2012) C. M. Bates, T. Seshimo, M. J. Maher, W. J. Durand, J. D. Cushen, L. M. Dean, G. Blachut, C. J. Ellison, and C. G. Willson, “Polarity-switching top coats enable orientation of sub–10-nm block copolymer domains,” Science 338, 775–779 (2012).
- Johnston et al. (2012) K. P. Johnston, J. A. Maynard, T. M. Truskett, A. U. Borwankar, M. A. Miller, B. K. Wilson, A. K. Dinin, T. A. Khan, and K. J. Kaczorowski, “Concentrated dispersions of equilibrium protein nanoclusters that reversibly dissociate into active monomers,” ACS Nano 6, 1357–1369 (2012), http://dx.doi.org/10.1021/nn204166z .
- Note (1) Note that clusters are differentiated from aggregates such as micelles because the characteristic size of the former need not be set by the monomer size.
- Groenewold and Kegel (2001) J. Groenewold and W. K. Kegel, “Anomalously large equilibrium clusters of colloids†,” J. Phys. Chem. B 105, 11702–11709 (2001), http://dx.doi.org/10.1021/jp011646w .
- Sciortino et al. (2004) F. Sciortino, S. Mossa, E. Zaccarelli, and P. Tartaglia, “Equilibrium cluster phases and low-density arrested disordered states: The role of short-range attraction and long-range repulsion,” Phys. Rev. Lett. 93, 055701 (2004).
- Archer and Wilding (2007) A. J. Archer and N. B. Wilding, “Phase behavior of a fluid with competing attractive and repulsive interactions,” Phys. Rev. E 76, 031501 (2007).
- Toledano, Sciortino, and Zaccarelli (2009) J. C. F. Toledano, F. Sciortino, and E. Zaccarelli, “Colloidal systems with competing interactions: from an arrested repulsive cluster phase to a gel,” Soft Matter 5, 2390–2398 (2009).
- Jiang and Wu (2009) T. Jiang and J. Wu, “Cluster formation and bulk phase behavior of colloidal dispersions,” Phys. Rev. E 80, 021401 (2009).
- Bomont et al. (2012) J.-M. Bomont, J.-L. Bretonnet, D. Costa, and J.-P. Hansen, “Communication: Thermodynamic signatures of cluster formation in fluids with competing interactions,” J. Chem. Phys. 137, 011101 (2012).
- Mani et al. (2014) E. Mani, W. Lechner, W. K. Kegel, and P. G. Bolhuis, “Equilibrium and non-equilibrium cluster phases in colloids with competing interactions,” Soft Matter 10, 4479–4486 (2014).
- Sweatman, Fartaria, and Lue (2014) M. B. Sweatman, R. Fartaria, and L. Lue, “Cluster formation in fluids with competing short-range and long-range interactions,” J. Chem. Phys. 140, 124508 (2014).
- Jadrich et al. (2015a) R. B. Jadrich, J. A. Bollinger, K. P. Johnston, and T. M. Truskett, “Origin and detection of microstructural clustering in fluids with spatial-range competitive interactions,” Phys. Rev. E 91, 042312 (2015a).
- Nguyen et al. (2015) T. D. Nguyen, B. A. Schultz, N. A. Kotov, and S. C. Glotzer, “Generic, phenomenological, on-the-fly renormalized repulsion model for self-limited organization of terminal supraparticle assemblies,” Proc. Natl. Acad. Sci. U. S. A. 112, E3161–E3168 (2015), http://www.pnas.org/content/112/25/E3161.full.pdf .
- Zhuang and Charbonneau (2016) Y. Zhuang and P. Charbonneau, “Recent advances in the theory and simulation of model colloidal microphase formers,” J. Phys. Chem. B (Just Accepted) (2016), http://dx.doi.org/10.1021/acs.jpcb.6b05471 .
- Campbell et al. (2005) A. I. Campbell, V. J. Anderson, J. S. van Duijneveldt, and P. Bartlett, “Dynamical arrest in attractive colloids: The effect of long-range repulsion,” Phys. Rev. Lett. 94, 208301 (2005).
- Klix, Royall, and Tanaka (2010) C. L. Klix, C. P. Royall, and H. Tanaka, “Structural and dynamical features of multiple metastable glassy states in a colloidal system with competing interactions,” Phys. Rev. Lett. 104, 165702 (2010).
- Zhang et al. (2012) T. H. Zhang, J. Klok, R. Hans Tromp, J. Groenewold, and W. K. Kegel, “Non-equilibrium cluster states in colloids with competing interactions,” Soft Matter 8, 667–672 (2012).
- Xia et al. (2012) Y. Xia, T. D. Nguyen, M. Yang, B. Lee, A. Santos, P. Podsiadlo, Z. Tang, S. C. Glotzer, and N. A. Kotov, “Self-assembly of self-limiting monodisperse supraparticles from polydisperse nanoparticles,” Nat. Nanotechnol. 7, 479–479 (2012).
- Yethiraj and van Blaaderen (2003) A. Yethiraj and A. van Blaaderen, “A colloidal model system with an interaction tunable from hard sphere to soft and dipolar,” Nature 421, 513–517 (2003).
- Stradner et al. (2004) A. Stradner, H. Sedgwick, F. Cardinaux, W. C. K. Poon, S. U. Egelhaaf, and P. Schurtenberger, “Equilibrium cluster formation in concentrated protein solutions and colloids,” Nature 432, 492–495 (2004).
- Porcar et al. (2010) L. Porcar, P. Falus, W.-R. Chen, A. Faraone, E. Fratini, K. Hong, P. Baglioni, and Y. Liu, “Formation of the dynamic clusters in concentrated lysozyme protein solutions,” J. Phys. Chem. Lett. 1, 126–129 (2010), http://dx.doi.org/10.1021/jz900127c .
- Yearley et al. (2014) E. J. Yearley, P. D. Godfrin, T. Perevozchikova, H. Zhang, P. Falus, L. Porcar, M. Nagao, J. E. Curtis, P. Gawande, R. Taing, I. E. Zarraga, N. J. Wagner, and Y. Liu, “Observation of small cluster formation in concentrated monoclonal antibody solutions and its implications to solution viscosity,” Biophys. J. 106, 1763 – 1770 (2014).
- Godfrin et al. (2016) P. D. Godfrin, I. E. Zarraga, J. Zarzar, L. Porcar, P. Falus, N. J. Wagner, and Y. Liu, “Effect of hierarchical cluster formation on the viscosity of concentrated monoclonal antibody formulations studied by neutron scattering,” J. Phys. Chem. B 120, 278–291 (2016), pMID: 26707135, http://dx.doi.org/10.1021/acs.jpcb.5b07260 .
- Park et al. (2014) J. I. Park, T. D. Nguyen, G. de Queirós Silveira, J. H. Bahng, S. Srivastava, G. Zhao, K. Sun, P. Zhang, S. C. Glotzer, and N. A. Kotov, “Terminal supraparticle assemblies from similarly charged protein molecules and nanoparticles,” Nat. Commun. 5 (2014).
- Israelachvili (2011) J. N. Israelachvili, Intermolecular and Surface Forces (Academic Press, New York, NY, USA, 2011).
- Shukla et al. (2008) A. Shukla, E. Mylonas, E. Di Cola, S. Finet, P. Timmins, T. Narayanan, and D. I. Svergun, “Absence of equilibrium cluster phase in concentrated lysozyme solutions,” Proc. Natl. Acad. Sci. U. S. A. 105, 5075–5080 (2008), http://www.pnas.org/content/105/13/5075.full.pdf .
- Stradner et al. (2008) A. Stradner, F. Cardinaux, S. U. Egelhaaf, and P. Schurtenberger, “Do equilibrium clusters exist in concentrated lysozyme solutions?” Proc. Natl. Acad. Sci. U. S. A. 105, E75 (2008), http://www.pnas.org/content/105/44/E75.full.pdf .
- Jadrich et al. (2015b) R. B. Jadrich, J. A. Bollinger, B. A. Lindquist, and T. M. Truskett, “Equilibrium cluster fluids: pair interactions via inverse design,” Soft Matter 11, 9342–9354 (2015b).
- Pandav, Pryamitsyn, and Ganesan (2015) G. Pandav, V. Pryamitsyn, and V. Ganesan, “Interactions and aggregation of charged nanoparticles in uncharged polymer solutions,” Langmuir 31, 12328–12338 (2015), pMID: 26535914, http://dx.doi.org/10.1021/acs.langmuir.5b02885 .
- Pandav et al. (2015) G. Pandav, V. Pryamitsyn, J. Errington, and V. Ganesan, “Multibody interactions, phase behavior, and clustering in nanoparticle–polyelectrolyte mixtures,” J. Phys. Chem. B 119, 14536–14550 (2015), pMID: 26473468, http://dx.doi.org/10.1021/acs.jpcb.5b07905 .
- Manning (1979) G. S. Manning, “Counterion binding in polyelectrolyte theory,” Acc. Chem. Res. 12, 443–449 (1979), http://dx.doi.org/10.1021/ar50144a004 .
- Alexander et al. (1984) S. Alexander, P. M. Chaikin, P. Grant, G. J. Morales, P. Pincus, and D. Hone, “Charge renormalization, osmotic pressure, and bulk modulus of colloidal crystals: Theory,” J. Chem. Phys. 80, 5776–5781 (1984).
- Ramanathan (1988) G. V. Ramanathan, “Counterion condensation in micellar and colloidal solutions,” J. Chem. Phys. 88, 3887–3892 (1988).
- Gillespie et al. (2014) D. A. J. Gillespie, J. E. Hallett, O. Elujoba, A. F. Che Hamzah, R. M. Richardson, and P. Bartlett, “Counterion condensation on spheres in the salt-free limit,” Soft Matter 10, 566–577 (2014).
- Derjaguin and Landau (1941) B. V. Derjaguin and L. Landau, “Theory of the stability of strongly charged lyophobic sols and of the adhesion of strongly charged particles in solution of electrolytes,” Acta Physicochim. URSS 14, 633–662 (1941).
- Verwey and Overbeek (1948) E. J. Verwey and J. T. G. Overbeek, Theory of the Stability Lyophobic Colloids (Elsevier, New York, NY, USA, 1948).
- Andersen, Chandler, and Weeks (1972) H. C. Andersen, D. Chandler, and J. D. Weeks, “Roles of repulsive and attractive forces in liquids: The optimized random phase approximation,” J. Chem. Phys. 56, 3812–3823 (1972).
- Hansen and McDonald (2006) J.-P. Hansen and I. R. McDonald, Theory of Simple Liquids, 3rd ed. (Academic Press, New York, NY, USA, 2006).
- Bergenholtz, Wagner, and D’Aguanno (1996) J. Bergenholtz, N. J. Wagner, and B. D’Aguanno, “Thermodynamic self-consistency criterion in the mixed integral equation theory of liquid structure,” Phys. Rev. E 53, 2968–2971 (1996).
- Plimpton (1995) S. Plimpton, “Fast parallel algorithms for short-range molecular dynamics,” J. Comput. Phys. 117, 1–19 (1995).
- Theodorou and Suter (1985) D. N. Theodorou and U. W. Suter, “Shape of unperturbed linear polymers: polypropylene,” Macromolecules 18, 1206–1214 (1985), http://dx.doi.org/10.1021/ma00148a028 .
- Humphrey, Dalke, and Schulten (1996) W. Humphrey, A. Dalke, and K. Schulten, “VMD – Visual Molecular Dynamics,” J. Molec. Graphics 14, 33–38 (1996).
- He and Thorpe (1985) H. He and M. F. Thorpe, “Elastic properties of glasses,” Phys. Rev. Lett. 54, 2107–2110 (1985).
- Hansen and Verlet (1969) J. P. Hansen and L. Verlet, “Phase transitions of the Lennard-Jones system,” Phys. Rev. 184, 151–161 (1969).