The Nucleus of the Planetary Nebula EGB 6 as a Post-Mira Binary11affiliation: Based in part on data obtained with the NASA/ESA Hubble Space Telescope, obtained by the Space Telescope Science Institute. STScI is operated by the Association of Universities for Research in Astronomy, Inc., under NASA contract NAS5-26555. Also based in part on observations with the 1.5-m telescope operated by the SMARTS Consortium at Cerro Tololo Inter-American Observatory.
Abstract
EGB 6 is a faint, large, ancient planetary nebula (PN). Its central star, a hot DAOZ white dwarf (WD), is a prototype of a rare class of PN nuclei associated with dense, compact emission-line knots. The central star also shows excess fluxes in both the near- (NIR) and mid-infrared (MIR). In a 2013 paper, we used Hubble Space Telescope (HST) images to show that the compact nebula is a point-like source, located (118 AU) from the WD. We attributed the NIR excess to an M dwarf companion star, which appeared to coincide with the dense emission knot. We now present new ground-based NIR spectroscopy, showing that the companion is actually a much cooler source with a continuous spectrum, apparently a dust-enshrouded low-luminosity star. New HST images confirm common proper motion of the emission knot and red source with the WD. The -band, NIR, and MIR fluxes are variable, possibly on timescales as short as days. We can fit the spectral-energy distribution with four blackbodies (the WD, a 1850 K NIR component, and MIR dust at 385 and 175 K). Alternatively, we show that the NIR/MIR SED is very similar to that of Class 0/I young stellar objects. We suggest a scenario in which the EGB 6 nucleus is descended from a wide binary similar to the Mira system, in which a portion of the wind from an AGB star was captured into an accretion disk around a companion star; a remnant of this disk has survived to the present time, and is surrounded by gas photoionized by UV radiation from the WD.
1 The Case-Book of EGB 6
EGB 6 (PN G221.5+46.3) is a low-surface-brightness, high-Galactic-latitude, angularly large () planetary nebula (PN), discovered by one of us in 1978—purely by chance—while examining Palomar Observatory Sky Survey (POSS) prints. The PN appears close to spherical, but its southwestern edge has a bright rim, possibly indicating an interaction with the interstellar medium111Deep CCD images of EGB 6 have been published by Jacoby & van de Steene (1995) and Tweedy & Kwitter (1996). An excellent deep color image has been posted on his website by amateur astronomer Dr. Don Goldman: http://astrodonimaging.com/gallery/egb-6-faint-planetary-nebula-in-leo .. The object was included in a list of faint nebulae found on POSS prints by Ellis et al. (1984, hereafter EGB). EGB noted that the POSS photographs show a blue 16th-mag star near the center of the nebula. This star had also been detected independently by Green et al. (1986) during the Palomar-Green survey for high-latitude blue objects, and was designated PG 0950+139. Follow-up spectroscopy by EGB revealed that this candidate planetary-nebula nucleus (PNN) has strong [O III] emission lines, making it elementary that it is the central star. Subsequently, Fleming et al. (1986) classified the absorption-line spectrum of the PNN as that of a hot DA white dwarf (WD). However, Liebert et al. (1989, hereafter L89) showed that He II is seen in absorption in the optical spectrum, and later Gianninas et al. (2010, hereafter G10) found absorption lines of heavy elements in the far ultraviolet. Thus the spectral type of the central star is DAOZ. Based on a non-LTE model-atmosphere analysis, G10 derived stellar parameters of K and .
The [O III] emission from the PNN is too strong to come from the surrounding large, faint, ancient PN222However, very weak [O III] 5007 Å emission from the large PN has been detected serendipitously in the SDSS spectra of two faint galaxies that happen to lie behind EGB 6: Yuan & Liu (2013). Acker et al. (1992) list the relative intensities of H, H, and 5007 Å.. Observations presented by L89 showed that the nebular lines arise from a compact emission knot (CEK), which is unresolved and appears to coincide with the PNN in ground-based images. Moreover, the electron density of the CEK is remarkably high, about , according to an emission-line analysis by Dopita & Liebert (1989, hereafter DL89).
In addition to the hot WD and associated CEK, there is a compact near-infrared (NIR) source located near the EGB 6 nucleus. This was first revealed through NIR photometry of the star by Zuckerman et al. (1991), and confirmed by Fulbright & Liebert (1993, hereafter FL93). These studies showed that the , and fluxes exceed those expected from the hot PNN. Both sets of authors concluded that the NIR excess is consistent with the presence of an M dwarf companion star. Subsequent photometry presented by De Marco et al. (2013) and Douchin et al. (2015, hereafter D15) found no significant excess at the band, but based on the absolute magnitude of the excess at SDSS and at , and an adopted distance, they inferred that the NIR source is a star of spectral type M3-5 V. However, there had been no direct spectroscopic confirmation that an M dwarf is present, and it should be remembered “how dangerous it always is to reason from insufficient data” (Conan Doyle 1892)333In homage to the canon of Sir Arthur Conan Doyle’s fictional character Sherlock Holmes, a master of scientific investigation, we have included a number of allusions to these works throughout the text.. Indeed, De Marco et al. (2013) noted the curious incident that the color is redder than expected for an M3-5 spectral type, and Miszalski et al. (2011) pointed out that the NIR source was too luminous for an unreddened star of the observed color.
Yet another component of the system was discovered in Spitzer Space Telescope observations by Chu et al. (2011, hereafter C11), who showed that the nucleus of EGB 6 has a strong mid-infrared (MIR) excess. C11 surveyed 71 hot WDs (including 35 that are PNNi) with the Spitzer multi-band imaging photometer (MIPS) at m, detecting nine of them at fluxes two or more orders of magnitude above those expected from the hot WDs. Follow-up observations were obtained by C11 with the Spitzer infrared array camera (IRAC) in its four bands from 3.6 to m. Of the nine m sources, EGB 6 is the apparently brightest of all in the four IRAC bands, and second brightest at m. C11 modeled its MIR excess as arising from two cool dust shells, with blackbody temperatures of about 500 K and 150 K.
An extensive discussion of the astrophysical mysteries of the EGB 6 central system, with additional literature references, was published recently by Liebert et al. (2013, hereafter L13). L13 included results from broad-band and emission-line imaging and grism spectroscopy with the Hubble Space Telescope (HST) obtained between 1991 and 1995, but which had not been presented in detail previously. The HST images and spectra revealed the startling result that the CEK is not centered on the PNN, but is instead a separate object with a stellar profile, lying away from the hot nucleus. This corresponds to a projected linear separation of 118 AU, for a nominal distance of about 725 pc. The longest-wavelength broad-band HST images available to L13 were in the F785LP filter of the original Wide Field/Planetary Camera (WF/PC1) and the F814W filter of the Wide Field Planetary Camera 2 (WFPC2)—that is, filters covering roughly the ground-based band. These images revealed a faint, resolved point-source companion of the central WD, which was argued to be the dM star responsible for the NIR excess. Remarkably, the location of the -band stellar source coincides with that of the CEK.
Thus EGB 6 raises several astrophysical puzzles, including how to explain the existence and survival of a compact dense [O III]-emitting nebula apparently associated with a cool M dwarf, located at least 118 AU from the source of ionizing radiation. EGB 6 may not be entirely unique, however: Frew & Parker (2010) and Miszalski et al. (2011) discuss several additional examples of otherwise normal PNe with compact, unresolved, high-density nebulae at their centers, comprising a class of “EGB 6-like” PNNi. The peculiar emission-line object Tol 26 (CTIO 1230275), having a high-density, compact nebula (Hawley 1981), may be related to this class.
In this paper, we discuss new HST images of EGB 6, and present previously unpublished ground-based photometric and spectroscopic monitoring of the object, obtained in a search for time variability in the stellar and nebular fluxes. We also present EGB 6’s NIR spectrum, and discuss the spectral-energy distribution (SED) of the nucleus. We end with some scenarios to explain the origin of this puzzling object.
2 An HST Study in Ultraviolet, Optical, Scarlet, and Near-Infrared
2.1 New HST Images
As noted in §1, the HST data discussed by L13 were taken between 1991 and 1995. Two decades later, in late 2013, we obtained new HST images, for the purposes of confirming the conclusions of L13, verifying that the CEK is physically associated with the PNN by showing that they have the same proper motions, and obtaining NIR images of the source.
Table 1 presents details of our new HST observations. All data were obtained with the Wide Field Planetary Camera 3 (WFC3), using its UVIS channel in the near-ultraviolet (NUV) and optical, and its IR channel in the NIR. For the UVIS imaging, we used a three-point dither pattern in each of seven different filters: five broad-band filters, extending from the NUV to the HST equivalent of the band, and two narrow-band filters covering the emission lines of [O III] 5007 Å and H. The UVIS frames were taken with a -pixel subarray, yielding a field of view of . For the IR imaging, we used a four-point dither pattern and the F160W filter, with a bandpass similar to the ground-based band. The IR subarray was also pixels, giving an angular size of . For our analysis, we downloaded the default pipeline drizzle-combined images in each filter from the Mikulski Archive for Space Telescopes (MAST)444http://archive.stsci.edu. These frames have cosmic rays removed, are corrected for geometric distortions, and have pixel values corresponding to counts (electrons) per second.
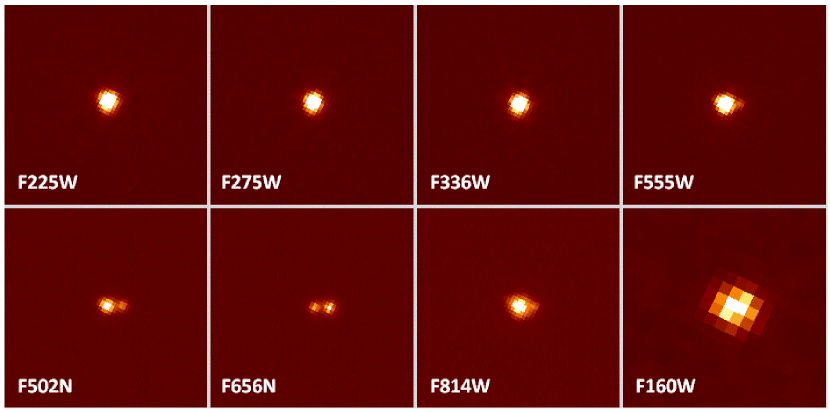
Figure 1 shows pictorial representations of the WFC3 images. In the NUV (F225W and F275W) and optical (F336W) bands, only the hot DAOZ central star is seen. The -band image (F555W) shows the companion CEK faintly, but only because several strong emission lines (principally H and [O III] 4959–5007 Å) lie within the broad filter bandpass. The narrow-band images in [O III] 5007 Å (F502N) and H (F656N) clearly resolve the stellar-appearing CEK from the central star. The widths of the filter bandpasses for F502N and F656N, according to the WFC3 Instrument Handbook (Dressel 2015), are 65 and 18 Å, respectively. The much wider bandpass of the [O III] filter compared to that of H explains why the CEK appears fainter than the central WD in F502N, but brighter in F656N (in addition to the DAOZ WD having H in absorption).
At the band (F814W), a faint source is seen at the position of the CEK. We measure this source to be about 3.6 mag fainter than the WD. Unfortunately, we have no spectroscopy of EGB 6 that covers the entire band. However, the detected source is almost certainly too bright to be due to emission lines from the CEK. There are very few nebular emission lines in the F814W bandpass; see, for example, the -band spectrum of the PN IC 2165 in Fig. 4 of Dufour et al. (2015). IC 2165 has a central star with parameters similar to that of the hot component of EGB 6, according to Henry et al. (2015), so a similar nebular emission spectrum is expected. Moreover, DL89 calculated a photoionization model for the EGB 6 CEK, leading to predictions of emission-line strengths, including lines in the F814W bandpass (their Table 1). Using either the line fluxes measured in IC 2165 (scaled to the H flux in EGB 6), or the model predictions from DL89, as input to the WFC3 Exposure Time Calculator555http://etc.stsci.edu/etc/input/wfc3uvis/imaging, we find that the emission lines can account for no more than 10% of the signal seen in F814W. Thus we confirm the argument in L13 that a cool source of faint -band light lies at the location of the CEK.
At the band (IR-channel F160W) we see a single source with a stellar profile. Although the WD is comparable in flux to the cool source in the band (see §4 below), the IR channel has considerably larger pixels () compared to those of the UVIS channel (), so we expect at most a small elongation of the image. However, the two components are well resolved in ground-based NIR active-optics (AO) data, as discussed below in §3.4.
2.2 Absolute Fluxes
We used routines from the IRAF666IRAF is distributed by the National Optical Astronomy Observatory, which is operated by the Association of Universities for Research in Astronomy (AURA) under a cooperative agreement with the National Science Foundation. software package to carry out aperture photometry on the WFC3 images. The count rates within apertures with a radius of (thus including the central star, cool companion, and CEK) were first determined with the phot task. These were then converted to absolute fluxes, using the photometric zero-points given by the PHOTFLAM keywords in the image headers, and scaling these values (which are for apertures of infinite radius) to apertures, using ratios derived from the information given at the WFC3 website777http://www.stsci.edu/hst/wfc3/phot_zp_lbn, accessed on 2015 November 15. at Space Telescope Science Institute (STScI).
The resulting values are given in the right-hand columns in Table 1 for the broad-band filters. For the narrow-band filters, we calculated the emission-line fluxes from the CEK for [O III] 5007 Å and H by multiplying by the filter bandwidths given above, and then scaling by the magnitude differences between the central star and the CEK measured in the two images. The resulting monochromatic line fluxes are given in the final column of Table 1, for the [O III] 5007 Å and H lines. The line fluxes are consistent with all of the emission being from the knot.
2.3 Astrometry
The separation and position angle (PA) of the CEK with respect to the PNN were measured by L13 in the HST frames taken between 1991 and 1995. For convenience, these measures are reproduced in the first three lines of Table 2. In order to determine whether our new observations reveal any appreciable relative motion, we measured the positions of the CEK and PNN, using the centroiding task in the imexamine package in IRAF. We then employed the STSDAS888STSDAS (Space Telescope Science Data Analysis System) is a product of STScI, which is operated by AURA for NASA. xy2rd routine to convert the positions to J2000 right ascension and declination, from which separation and PA can be determined. The average values from the 2013 frames in [O III] and H are given in the last line of Table 2. These results show that there has been no significant change in the separation and PA over the approximately two-decade interval covered by our observations.
Independent measurements of the absolute proper motion of the central star are available from the PPMXL (Roeser et al. 2010) and UCAC4 (Zacharias et al. 2013) catalogs, and from Data Release 7 of the Sloan Digital Sky Survey (SDSS) as quoted by Girven et al. (2011). These sources give proper motions, in , of , , and , respectively. Taking the mean of these values, we find that the total absolute motion of the central star from the epoch of the first HST observation to that of the most recent one is . Since the measured separation of the PNN and CEK has changed by no more than a few mas, this is a strong indication that they are physically associated. There has, however, been no detectable orbital motion. This is slightly surprising, since the nominal period, for a true separation of 118 AU, would be of order 1450 years, and thus about 1/60th of the period would have elapsed between the two sets of HST images. This would give a change of in PA for a face-on circular orbit, which we do not see. However, there is a wide range of orbital parameters for a gravitationally bound system that are consistent with our observations.
3 Ground-based Data! Data! Data!
We turn now to ground-based photometry and spectroscopy of the EGB 6 central object. We discuss absolute photometry, monitoring programs aimed at searching for photometric and/or spectroscopic variations that might shed light on the nature of the central source, and an archival but previously unpublished NIR spectroscopic observation.
3.1 Absolute Optical Photometry
We obtained absolute photometry of the central source in EGB 6 on three photometric nights between 1991 and 1998, using 0.9-m telescopes at Kitt Peak National Observatory (KPNO) and Cerro Tololo Inter-American Observatory (CTIO), and calibrated to the Johnson-Kron-Cousins BVRI system via observations of standard stars from Landolt (1992, 2009). These previously unpublished data are presented in Table 3, along with results quoted from the literature sources indicated in the last column. In addition, the last two data entries from 2016 are from observations with the Asiago 0.67/0.92-m Schmidt telescope, and likewise calibrated to Landolt standards. The first two lines in Table 3 are from photoelectric observations in 1978 and 1982, with errors of approximately 0.05 mag. The remaining data were obtained with CCDs, were reduced with standard aperture-photometry routines, and have typical errors usually of about 0.005–0.010 mag. Averages of the CCD results, and the errors of the means, are given at the bottom of Table 3.
The and magnitudes of the central object have been essentially constant within the errors from 1991 to 2016, and, with slightly larger uncertainty, since the photoelectric observations in 1978–1982. The magnitude is also nearly constant, but with perhaps a slightly larger scatter. There does appear to be variability at the band, at the level of several hundredths of a magnitude, even during a single observing run with identical equipment. Based primarily on the two observations in 1991 and 1994, compared with subsequent measures, there is a slight suggestion of a slow secular fading of the magnitude, but this could simply be due to the randomness of the short-timescale variability.
Our measured magnitude difference of 3.6 between the companion and the WD in the HST F814W image (discussed in §2.1), along with an magnitude of the total flux of 16.31, imply that the apparent magnitude of the companion is .
3.2 Differential Optical Photometric Monitoring
We obtained differential CCD photometry during six different observing runs on 0.9-m telescopes at KPNO (1990 December, 1991 November, 1998 March) and CTIO (1991 January, 1992 May, 1994 March). These results have likewise not been published previously. In nearly all cases only a single set of BVRI observations was made per night during these runs, as they were part of a larger monitoring survey of many PNNi in search of variable central stars (e.g., Bond et al. 1992; Ciardullo & Bond 1996). The total number of observations of EGB 6 was 57 in and , 50 in , and 53 in . The seeing in these frames generally ranged between and .
The frames were bias-subtracted and flat-fielded using standard IRAF tasks. Differential photometry was carried out using the daophot point-spread-function (PSF)-fitting routines within IRAF. Each frame’s PSF was determined from three bright, isolated field stars located near the EGB 6 central star. We then calculated the magnitude difference between EGB 6 and the sum of intensities of these three comparison stars. The formal precisions for differential magnitudes determined in this way for a source as faint as EGB 6 are about 0.01 mag in , , and , and about 0.02 mag in .
Unfortunately, for the purpose of long-term monitoring, this is a cumbersome batch of data. Not only were the six runs made with five different combinations of CCD and filter sets, but the PNN () is considerably bluer than the comparison stars (whose combined light has ). Thus our differential magnitudes are sensitive to changes in the bandpass effective wavelengths among the different instrumental setups. During three of the six observing runs, observations of Landolt standard stars allowed us to determine the color terms, and thus correct our data to the standard system. For the other three runs (KPNO 1990 December, KPNO 1991 November, and CTIO 1992 May), we simply forced the mean differential magnitudes to equal the means from the three calibrated runs. (This would mean that we might miss any systematic long-term changes in brightness, but the absolute photometry discussed above indicates this is not the case, except possibly in .)
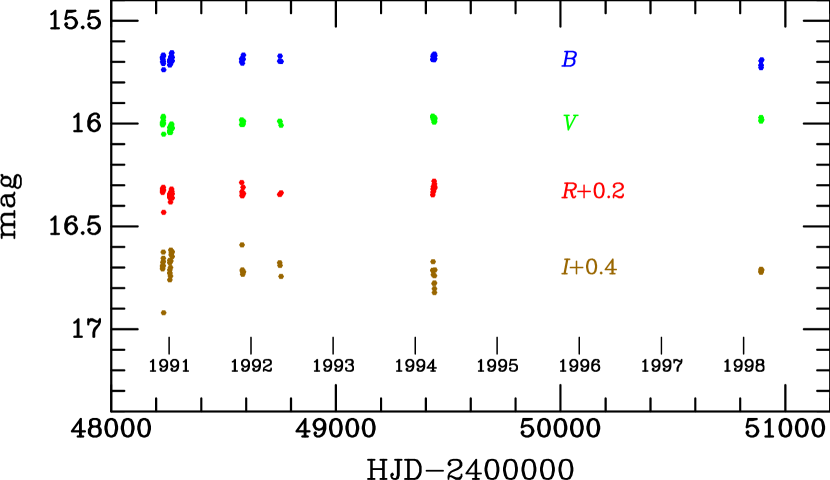
Figure 2 plots the resulting magnitudes against date of observation. The zero-points in each filter have been set to reproduce the mean calibrated magnitudes given in Table 3, but with and offset for clarity by the amounts indicated in the figure. The photometric scatter in , , and is roughly twice that suggested by the photon-statistical errors quoted above, but this is not surprising because some of the data were taken in non-photometric conditions, and because of small systematic errors due to flat-field illumination and other instrumental effects. The scatter in does, however, appear to exceed the expected amount; since the absolute photometry discussed in §3.1 also suggested variability, we believe that the source is indeed a short-term variable at the bandpass. We searched for a periodic signal using a periodogram analysis, but did not find any evidence for one. However, the observing cadence of one observation per night was not particularly suitable for this purpose. An intensive campaign of monitoring would be useful for further investigation.
Photometry of EGB 6 in the band is also available from late 2005 to late 2013 from the Catalina Real-time Transient Survey (CRTS)999http://crts.caltech.edu, accessed 2015 December 23 (Drake et al. 2009). No significant variability at , apart from a few outliers, is seen in more than 700 observations. Typical error bars for the CRTS data points are about 0.07 mag. There are also about 20 photographic observations from the Digital Access to a Sky Century @ Harvard (DASCH) project (Grindlay et al. 2012), going back to 1914, again showing no convincing evidence for long-term variability at blue wavelengths. The star did nothing in the night-time.
3.3 Optical Spectroscopic Monitoring
As discussed in §1, it had been believed that there is an M dwarf companion to the central WD star of EGB 6. Moreover, the system is suspected of variability in the band (and in the NIR—see below). This suggested the possibility that the cool component could be a dM flare star or other type of variable. If so, the optical spectrum during a flare might exhibit enhanced Balmer emission as well as emission at Ca II H and K. Moreover, the discussion in L13 raised the possibility that the electron density in the CEK could be changing, for example if the dense compact nebula is dispersing. In this case, the nebular forbidden emission-line spectrum might be variable.
With these motivations, we monitored the central source by arranging to obtain optical spectra with the 1.5-m telescope at CTIO operated by the SMARTS Consortium101010SMARTS is the Small & Moderate Aperture Research Telescope System; http://www.astro.yale.edu/smarts. The observations were conducted by Chilean service observers on 47 nights between 2004 January 31 and 2012 January 24. We used the RC-focus spectrograph equipped with a CCD camera, and grating 26 in first order, covering either 3532–5300 Å or 3660–5440 Å, at a spectral resolution of 4.3 Å. Exposure times each night were s. A short exposure on a HeAr lamp was taken before each set of stellar observations for wavelength calibration. The CCD images were bias-subtracted and flat-fielded, combined for cosmic-ray removal, and then the spectrum was extracted and wavelength-calibrated, all using standard IRAF routines. The spectra were normalized to a flat continuum, and smoothed with a three-point boxcar kernel.
The top panel in Figure 3 shows two examples of the spectra, obtained near the beginning and end of the eight-year observing interval, in order to illustrate the quality of the individual data. This panel also shows a mean spectrum made by combining all 47 observations. The strongest emission lines are marked. The bottom panel in Figure 3 shows the same combined spectrum, with the vertical scale expanded so as to show the photospheric absorption features from the WD more clearly.
We see no strong evidence for spectroscopic variability in these data. Enhanced Balmer emissions, and the appearance of Ca II H and K in emission, never occurred. Using standard IRAF tasks, we combined the spectra into seasonal averages, and determined the equivalent widths (EWs) of the emission lines during each season. We also measured the EWs in the combined spectrum of all 47 observations. The results are presented in Table 4. The uncertainties for the seasonal averages are of order a few percent for the strong lines, and up to about 12% for the weaker ones. In the next-to-last line of Table 4 we list the EWs published by L89, based on the averages of seven spectra obtained with various telescopes over the interval 1978 to 1987. We see no evidence for large changes in the emission-line spectrum over the entire range from 1978 to 2012. (There is a slight suggestion that [O III] 5007 Å and H have weakened, but at least for the latter this could be a systematic effect due to the blend with the photospheric absorption feature, combined with the relatively low spectral resolution of the SMARTS spectra.)
As this paper was being completed, we were able to obtain spectrograms of EGB 6 on 2016 April 3, using the Asiago Astrophysical Observatory 1.22-m telescope. The exposures were s. Equivalent widths derived from these spectra are given in the final entry in Table 4. They are generally consistent with the values in the rest of the table, showing again that any secular changes in the emission-line spectrum since the late 1970s have been small. The new observation provides marginal evidence for a slow strengthening of [O III] 4363 Å, which if so would suggest an increase in the electron density. There is further evidence that H has weakened, and [O III] 4959–5007 Å have strengthened. Continued monitoring of the spectrum is desirable.
3.4 Gemini Near-IR Spectrum
In a search of the Gemini Observatory Archive111111https://archive.gemini.edu, we found that observations of the central source in EGB 6 had been obtained with the 8-m Gemini North NIR spectrograph (GNIRS; Elias et al. 2006) on 2012 December 29 (program GN-2012B-Q-60; PI: J. Bilíková). The observing sequence was a standard ABBA pattern of s exposures on EGB 6 and s exposures on HR 4041, a neighboring A0 V star to be used for telluric correction. GNIRS was operated using AO in its cross-dispersed mode with the grating and a slit. Wavelength coverage was 0.95–2.5 m, at resolution .
In the -band acquisition images, we noticed that EGB 6 was partially resolved into two point sources, at a separation consistent with the HST observations described above. The spectrograph slit, perhaps fortuitously, was oriented such that it lay almost exactly along the nearly east-west orientation of the two sources; thus the spectra of the two sources are spatially separated. Visual examination shows that the hot WD dominates the continuum emission blueward of m. At longer wavelengths, the cool source brightens and the WD weakens. In the band, the two sources have nearly equal fluxes. The cool companion dominates redward of there.
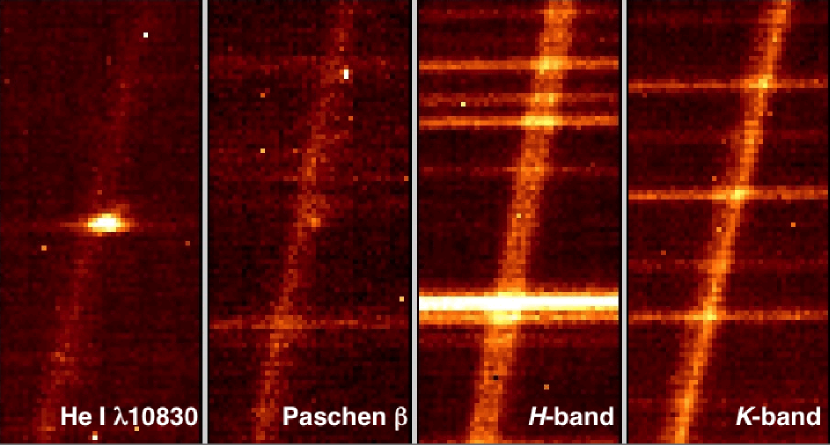
Figure 4 presents close-ups of four sections of the two-dimensional spectrum. The first panel on the left shows the region around the He I 10830 Å emission line from the CEK. The emission is spatially offset from the continuum of the WD, consistent with our findings from the narrow-band HST images discussed in §2.1 and in L13. The second panel is centered on the region around Paschen- at 12818 Å; this emission line is likewise offset from the WD continuum, and coincides instead with the weakly visible continuum of the cool source. The third panel lies near the center of the band; now the continua of the WD and cool source have similar brightnesses. In the final panel, near the center of the band, the spectrum of the cool source is brighter than that of the WD.
After removing electronic artifacts from the images using the cleanir.py routine provided by the Gemini Observatory, we processed the data using standard IRAF tasks for long-slit spectroscopy. Consecutive images were first flat-fielded, then subtracted to remove sky emission, and finally stacked. Due to the semi-resolved nature of the sources, we elected to extract the combined spectrum of both objects using an aperture with a width of 12 pixels121212This extraction width corresponds to an angular width of . We attempted to extract separate spectra of the two sources, but were only partially successful, due to the varying flux ratio between the sources and across spectral orders.. The spectrum for HR 4041 was processed in a similar manner. An argon arc-lamp spectrum taken immediately after the science observations provided wavelength calibration. To remove telluric absorption lines and correct for instrumental response, we divided the combined spectrum of the two EGB 6 sources by the spectrum of HR 4041, after first interpolating across its intrinsic hydrogen absorption lines. This ratio spectrum was then multiplied by the vs. wavelength relation for a 9500 K blackbody (the approximate effective temperature of HR 4041). The zero-point flux level of the final spectrum was normalized to match the available absolute NIR photometry (tabulated below in Table 5).
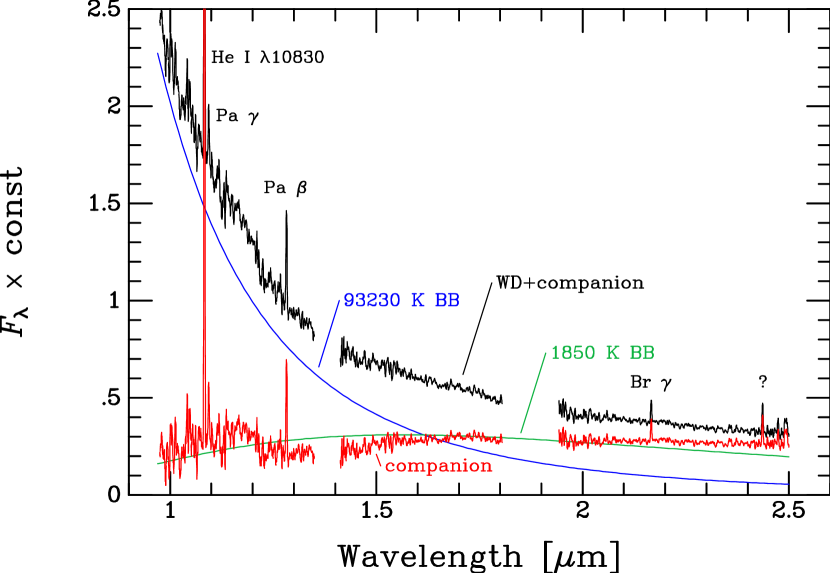
Figure 5 plots the resulting spectrum of the WD plus companion source as a black line. We saw no absorption features in the spectrum at its modest SNR, so we applied an 11-point boxcar smoothing. Several prominent emission lines from the CEK are labeled131313A strong emission line is detected at m, which we have been unable to identify. Inspection of the spectrum image indicates that it appears to be real, and is spatially associated with the companion source.. To recover the contribution of the cool companion, we subtracted a 93,230 K blackbody, representing the WD component, shown as a blue curve. The resulting companion spectrum is plotted as a red line.
We stared at it in astonishment: the companion spectrum is not that of the M dwarf that has been claimed by earlier authors (§1), including our own previous report in L13. Instead, longward of about m, there is a smooth continuum, consistent with that of a cool blackbody. There appears to be a broad bump from approximately 1.0 to m, but this feature may be of doubtful reality since the intrinsic signal in this part of the spectrum (before conversion to ) is quite weak and noisy. (If the bump is real, we have no obvious explanation for it; for example, it is much too narrow to be attributed to a blackbody contribution, and there are no features in late-type stellar spectra with such a structure.) Overall, the companion’s energy distribution can be fitted approximately by a blackbody of about 1850 K, plotted as a green line in Figure 5, or somewhat cooler if we were to discount the 1.0–m bump.
Thus the Gemini spectrum has clearly revealed the spatial location of the NIR excess that was discovered more than two decades ago. The NIR source is a point-like companion of the central star, which coincides with the unresolved CEK seen in the HST images. It is not a dM star, but a considerably cooler source.
4 The Sign of the Four: The Spectral-Energy Distribution
4.1 Broad-band Photometry and Calibrated Spectra
In Table 1 we had presented the continuum fluxes () derived from our 2013 HST broad-band photometry. In Table 5 we collect additional broad-band photometry of the EGB 6 central source and accompanying CEK from the following archival and literature sources: (1) FUV and NUV magnitudes from the Galaxy Evolution Explorer (GALEX); (2) a magnitude from D15; (3) mean BVRI magnitudes from our Table 3 (which included data from D15); (4) ugriz photometry from the SDSS; (5) the mean of the JHK magnitudes listed by FL93; (6) the 2MASS magnitudes; (7) the WISE through magnitudes; and (8) fluxes from 3.6 to m from the Spitzer IRAC and MIPS instruments. The footnotes to Table 5 give literature or archive references for each of these sources of data. Column 4 gives effective wavelengths for each bandpass, with the literature sources given in another footnote. The magnitudes have then been converted to values in the fifth column, using zero-points referenced in the final footnote.
We also make use of Herschel Space Observatory imaging of EGB 6, available at the Herschel Science Archive141414http://www.cosmos.esa.int/web/herschel/science-archive. The target was observed (Program OT1_ksu_2; PI: K. Su) with the Photodetector Array Camera and Spectrometer (PACS; Poglitsch et al. 2010) and the Spectral and Photometric Imaging Receiver (SPIRE; Griffin et al. 2010) on 2011 November 27 and 2011 October 23, respectively. The PACS observations consist of images at 70 and 160 m, but the central source in EGB 6 was only detected at 70 m. EGB 6 was likewise undetected in the SPIRE data (250, 350, and 500 m). We reduced the PACS data using the Herschel Interactive Processing Environment (HIPE; Ott 2010) software version 9.0.0, following the standard pipeline. We measured the flux density at 70 m using aperture photometry with a radius of 60, and then applying the aperture corrections suggested by the NASA Herschel Science Center151515https://nhscsci.ipac.caltech.edu/sc/index.php/Pacs/ApertureCorrections. Since the error maps created by the HIPE are unreliable, we estimated the flux error by taking the standard deviation of the background measurements in five arbitrarily distributed 60 apertures placed in the high-coverage area of the observations. We also estimated an upper limit to the non-detection at 160 m in a similar manner and report the measured standard deviation multiplied by three. The final results are flux densities of mJy at 70 m, and an upper limit of 15 mJy at 160 m. The 70 m value, converted to , is given in the final line of Table 5.
In addition to the broad-band photometry presented in Table 5, and the Gemini NIR spectrum discussed in §3.4, there are flux-calibrated space-based spectroscopic observations available from the following archival sources: (1) three FUV spectra (1150–1970 Å) obtained with the International Ultraviolet Explorer (IUE) in 1987 (PI: J. Holberg) and 1989 (PI: J.L.); (2) two spectra, covering 1140–2500 Å and 2220–3300 Å, obtained with the Faint Object Spectrograph (FOS) on HST in 1992 (PI: H. Shipman); and (3) a MIR spectrum (5.25–37.3 m) obtained with the Infrared Spectrograph (IRS) on Spitzer in 2009 (PI: K. Su). We downloaded these data from MAST (for IUE and FOS) and from the Cornell Atlas of Spitzer IRS Sources161616http://cassis.sirtf.com/atlas (for IRS; Lebouteiller et al. 2011).
4.2 Variability
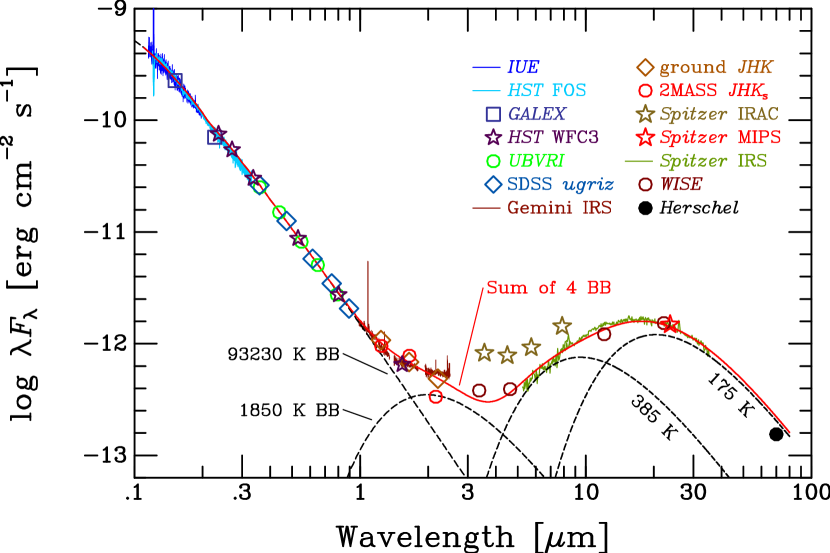
In Figure 6 we plot values based on Tables 1 and 5, and the spectroscopic fluxes, against wavelength. (This figure is an update of one presented in a conference poster by Su et al. 2011171717The poster is available at http://www.jb.man.ac.uk/apn5/poster_pdfs.html.) The legend in the figure identifies the sources of the plotted photometry and spectra. From the FUV through the NUV and optical, up to about the band, all of the data are in excellent agreement, in spite of having been obtained over a wide interval of dates. We thus verify again that EGB 6 is non-variable over this spectral range. We had already noted evidence for variability in the ground-based band in §3.2. Figure 6 shows that even larger discrepancies start to appear as we move to longer wavelengths. The NIR and MIR data were obtained over a range of dates: in chronological order (1) the ground-based observations were made in 1991 (FL93), with variations on a timescale of one day noted; (2) the 2MASS data, especially discrepant with FL93 at , are a combination of survey observations obtained from 1997 to 2001; (3) the four Spitzer IRAC data points—which are systematically bright by 0.75 mag relative to the rest of the observations—were obtained in 2007, and the MIPS datum in 2008; (4) the Spitzer IRS spectrum is from 2009; (5) the four WISE points are from survey observations made over seven months in 2010; (6) the Herschel 70 m datum was obtained in 2011; and (7) the Gemini NIR spectrum is from 2012.
4.3 The Spectral-Energy Distribution
Because of the variability of the EGB 6 nucleus in the NIR and MIR, and the fact that the data plotted in Figure 6 were obtained at a range of different epochs, it is doubtless premature to attempt a general, static model to explain the SED. However, as a rough guide to the astrophysical parameters, here we will simply fit the SED of the combined light of the nucleus and companion with four components, represented by blackbodies. We fixed the temperature of the hot WD at 93,230 K from the atmospheric analysis (§1). The optical colors as well as the IUE and HST/FOS spectra show that the WD is very lightly reddened; we adopted , giving a good fit to the SED from the FUV to the optical. Since the total reddening in the direction of EGB 6 is , according to the reddening maps of Schlafly & Finkbeiner (2011)181818as implemented at the NASA/IPAC Extragalactic Database, http://ned.ipac.caltech.edu/forms/calculator.html, it appears that the hot central star suffers no significant reddening within the system.
We arbitrarily omitted the four high Spitzer IRAC points191919 To verify the C11 results that produced the four high values, we obtained the IRAC data from the Spitzer archive (http://irsa.ipac.caltech.edu), combined the individual corrected basic calibrated data images into a mosaic, and performed aperture photometry using the Mosaicking and Point Source Extraction package developed by the Spitzer Science Center (Makovoz & Marleau 2005). Our results are in agreement with those of C11., because the remaining data are reasonably self-consistent, although still showing some discordances due to variability, and then performed a fit of four blackbodies to the remaining data. The blackbodies were corrected for the adopted reddening, using the formulae of Cardelli et al. (1989) with . The resulting SEDs of these blackbodies are shown as dashed black lines in Figure 6, and their sum as a solid red line. The MIR data are fit reasonably well by two cool blackbodies, corresponding to dust with temperatures of 385 and 175 K. This result is in fairly good agreement with C11, who found 500 and 150 K for these components, but using only the Spitzer IRAC and MIPS data. However, these two blackbodies, combined with the Rayleigh-Jeans tail of the WD, fail to account for the excess flux in the NIR, whose presence as a separate source is clearly revealed by the Gemini spectrum. This NIR excess has been attributed to an M3–M5 dwarf (–3000 K202020For nominal stellar parameters as functions of spectral type, here and in the next section, we use a literature compilation assembled by E. Mamajek: http://www.pas.rochester.edu/∼emamajek/EEM_dwarf_UBVIJHK_colors_Teff.txt) in previous studies, as summarized in §1 and in L13 and references therein. However, our fit, as well as the Gemini spectrum (§3.4 and Figure 5), require a much lower temperature for this component, around 1850 K.
5 Dust is an Essential Part of the System
To summarize the results presented here and in L13: the hot WD nucleus of the old PN EGB 6 is accompanied by a compact source at a projected separation of 118 AU. This companion object emits both forbidden emission lines from a dense nebula, and NIR flux with a blackbody-like spectrum at a temperature of 1850 K. The NIR flux varies on a timescale possibly as short as a few days, but the nebular emission spectrum has not shown any large variability. In addition, there is cooler dust, with temperatures of 175–385 K, whose physical location within the system remains unknown from the available observations. The flux from at least the 385 K component of this dust is also time-variable.
L13 discussed two scenarios that might explain the emission-line knot seen in EGB 6, based on their conclusion that it is physically associated with an M dwarf: (1) the CEK is a stable region of compressed gas where winds from the WD and dM star collide, or (2) the CEK is a photoionized remnant envelope or accretion disk around the dM star, which (as first suggested by Zuckerman et al. 1991) was captured during the epoch of rapid mass outflow from the WD progenitor that created the large, faint surrounding PN a few times yr ago. Our new finding that there is not an exposed M dwarf in the system now makes the colliding-wind scenario unlikely.
A combination of four blackbodies—WD, NIR source, and the two cool MIR components—does fit the entire SED reasonably well (again, apart from the four discrepantly high Spitzer IRAC points), as depicted by the red line in Figure 6. L13 estimated a distance to EGB 6 of pc, based on the absolute magnitude of the WD component derived from its atmospheric parameters; the large uncertainty in is due to relatively large uncertainties in the and of the WD, a consequence of emission-line contamination of the photospheric Balmer lines in the spectra analyzed by G10. However, Frew et al. (2016) have developed a statistical distance indicator for PNe based on an H surface-brightness vs. physical radius relation. Applying this calibration to the surrounding large, faint PN of EGB 6, Frew et al. find a similar distance but with a smaller uncertainty: pc.
If the NIR source were a star with an effective temperature of 1850 K, it would be an early L-type dwarf, with a -band absolute magnitude of roughly +11.3. At a distance of about 725 pc (the unweighted average of the above two estimates), this L dwarf would have an apparent magnitude of ; however, the observed magnitudes (Table 5) are in the range 15.6–16.1. Moreover, the observed NIR spectrum does not have the strong molecular bands seen in L-type dwarfs; as described in §3.4, it has a smooth blackbody-like spectrum longward of 1.2 m. Clearly the NIR source is not a stellar photosphere.
At a separation of at least 118 AU from the WD, the NIR source is much too warm to be heated by the WD. The NIR source is more plausibly a dusty envelope or disk, which reradiates the luminosity of a heavily obscured low-mass star. The physical radius of the 1850 K NIR source, for a 725 pc distance, is about . Its radiated luminosity is . If this luminosity is due entirely to reprocessed radiation from an enshrouded star, it corresponds to that of an M3.5 V dwarf, using the Mamajek table cited above. In this picture, the companion source is an M dwarf after all, but one that is hidden from view by surrounding dust212121Alternatively, the putative enshrouded companion could be a WD with the required luminosity, although it requires “fine-tuning” of the time since its formation; if so, it would currently have an effective temperature of about 15,000 K and a cooling age of yr. This is based on an assumed mass of and the “Montreal” WD cooling tracks at http://www.astro.umontreal.ca/∼bergeron/CoolingModels (e.g., Tremblay et al. 2011)..
In the remainder of this section we discuss two alternative pictures: one in which the NIR and MIR sources have separate locations in the system, and another in which they are both emitted by the obscured companion.
5.1 Dusty Debris Cloud?
We first consider a scenario in which the source of the MIR excess in EGB 6 does not coincide with the NIR and emission-line companion, but is located elsewhere in the binary system. Over the past decade, it has been discovered that a significant fraction of hot WDs and PNNi are associated with NIR and/or MIR excesses, indicating the presence of warm and/or cool dust. Su et al. (2007, hereafter S07), using Spitzer observations, detected a MIR flux from the central star of the Helix Nebula (NGC 7293), a well-known and very nearby PN. This MIR source exhibits a thermal continuum, with a blackbody temperature of 120 K, attributed to an optically thin debris disk of cool dust surrounding the hot WD at separations of 35–150 AU. S07 suggest that this dust arose from collisions of Kuiper-Belt objects or breakup of Oort-Cloud comets, due to the dynamical perturbation induced by the sudden mass loss from the central star when the PN was ejected. HST imaging of the Helix PNN (Ciardullo et al. 1999) detected no companion stars with spectral types earlier than M8 (for projected separations greater than 65 AU) to M5 (for separations as close as 11 AU). S07 noted moreover that the Helix PNN shows no NIR excess; thus there is no compelling argument that it has a binary companion.
Although the HST and NIR observations of EGB 6 clearly associate the NIR excess (and the emission-line source) with a companion object, there is no direct evidence that the MIR excess is located at the position of the companion. Thus the Helix results may suggest a scenario in which the MIR excess in EGB 6 is likewise due to a debris disk encircling the hot WD nucleus, and is not directly associated with a companion star
Searches for IR excesses associated with hot WDs and PNNi have been made by C11 (see §1), Bilíková et al. (2012), and Clayton et al. (2014, hereafter C14). (Hoard et al. 2013 carried out a wider-scale search of the all-sky WISE archive for dust excesses around a large sample of WDs over a broad range of temperatures, but excluded known PNNi and binaries, including EGB 6.) C11 found nine cases of MIR excesses out of a sample of 71 hot WDs; seven of the nine WDs are PN nuclei, including EGB 6 itself. Dust temperatures are typically 120–190 K, but four of the PNNi—which C11 call “EGB 6-like”— also exhibit NIR excesses implying additional, warmer dust components with temperatures of 500–1200 K. Bilíková et al. searched the Spitzer archive and found additional examples; overall, about 18% of PNNi have associated dust disks. This is a significantly higher fraction than the 1–3% incidence of NIR excesses due to warm dust around cool (25,000 K) WDs (Farihi et al. 2009; C14 and references therein). A further difference is that the warm-dust disks around the cool WDs lie very close to the star, typically within the tidal-disruption radius for asteroidal bodies. As discussed by C14, this suggests that the dust around PNNi is recently formed and relatively transitory, in addition to lying at much greater distances from the central stars as demanded by the low dust temperatures. These authors note that eight out of 13 PNNi with dust disks detected at 8 or m are known or suspected to have binary companions. This raises the possibility that a binary interaction with the asymptotic-giant-branch (AGB) wind aids the formation of a dusty disk around the mass-losing star in at least some systems, if not in the Helix Nebula.
Stone et al. (2015, hereafter SML15) have discussed these phenomena from a theoretical standpoint. They propose that the cool dust debris at large separations from PNNi arises from the response of a pre-existing Oort-Cloud analog to the sudden ejection of the PN and the “natal kick” received by the WD. Some of the comets would be placed in orbits bringing them close enough to the WD for evaporation or even tidal disruption, leading for formation of a spherical, optically thin, cool dust cloud around the WD. Their model does not directly account for the warmer dust detected in the NIR—but, at least in the case of EGB 6, this dust appears to be associated with a companion rather than a cloud around the PN nucleus. For EGB 6 itself, modeling by SML15 finds that the m flux implies a dust mass of .
5.2 Post-Mira Accretion Disk?
Now we consider an alternative scenario in which the EGB 6 nucleus is the immediate descendant of a symbiotic-like binary similar to the Mira (o Ceti) system. Mira itself, a prototypical mass-losing long-period variable star, is accompanied by a companion, Mira B, at a separation (in 1995) of (Karovska et al. 1997), corresponding to a projected linear separation of 50 AU. Mira B is hidden by an optically thick accretion disk of material captured from the wind of Mira A (e.g., Ireland et al. 2007, hereafter I07, and references therein). I07 argue on both theoretical and observational grounds that the underlying Mira B star is a late-type dwarf, although many other authors (e.g., Sokoloski & Bildsten 2010 and references therein) cite evidence for it being a WD.
Based on the statistics of wide binaries, I07 predict that binary systems in which an accretion disk is formed around a companion during the AGB wind phase are relatively common—about one in five among solar-type stars. Once the AGB star becomes a WD and its slow, dusty stellar wind dies out, the companion’s accretion disk will also eventually disappear. Citing Alexander et al. (2006) for the timescale for viscous evolution of such accretion disks, I07 conclude that “systems like Mira should produce clear observational signatures of an accretion disk around the secondary for at least a few times yr after the primary becomes a WD.”
Wind accretion from AGB stars in wide binaries has been studied theoretically by a number of authors, including Soker & Rappaport (2000), Perets & Kenyon (2013, hereafter PK13), and Huarte-Espinosa et al. (2013). PK13 state that “for separations of 3–100 AU wind-fed disks have surface-density and temperature profiles similar to those observed in low-mass protoplanetary disks.” PK13 even raise the possibility of planet formation within such wind-created accretion disks.
If we attribute both the NIR and MIR flux to the companion object in EGB 6, then in fact it does have several features in common with young stellar objects (YSOs), in particular those of class 0/I (the youngest protostars, with both an obscuring envelope and an accretion disk). These traits include: (1) significant NIR and MIR excesses; (2) large-amplitude variability in the NIR and MIR (up to 2 mag in extreme cases, e.g., Carpenter et al. 2001; Morales-Calderón et al. 2011); and (3) occasionally H, He, and other species in emission, including [O III] (e.g., van Loon et al. 2010). These phenomena arise from combinations of accretion, disk morphology, shocks, starspots, and ionizing radiation from nearby bright stars. These give rise to a wide variety of NIR and MIR SEDs and spectra of YSOs (e.g., Furlan et al. 2011).
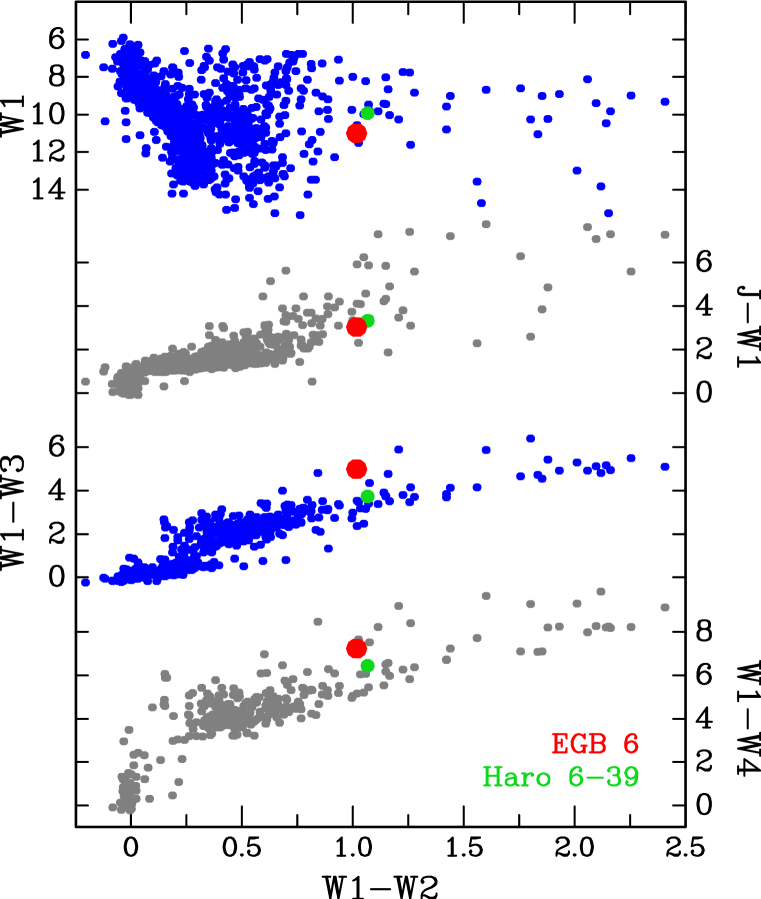
For a direct comparison of the NIR/MIR SED of the EGB 6 companion with those of YSOs, in Figure 7 we plot its position in color-magnitude and color-color diagrams for combinations of the 2MASS and WISE magnitudes. The contribution of the hot WD to the EGB 6 magnitudes has been removed. We also plot data for samples of YSOs in the Taurus and Upper Scorpius star-forming regions, taken from Esplin et al. (2014, hereafter E14) and Luhman & Mamajek (2012), respectively. The magnitudes for EGB 6 and Upper Scorpius have been adjusted to the 140 pc distance of the Taurus region.
Figure 7 illustrates that the infrared luminosity and colors of the EGB 6 companion are consistent with those observed in YSOs. In this interpretation, the NIR/MIR excess, SED, and spectrum of EGB 6 are attributed to a companion object, embedded in an accretion disk and envelope. The star itself is obscured, and the disk and envelope, which have a wide range of effective temperatures, provide the IR excess. The emission lines of H and possibly He would be produced by accretion shocks from in-falling material (e.g., Calvet & Hartmann 1992), while the forbidden lines are formed in an outflow or wind. Variations in the accretion rate could be responsible for the observed infrared variability of the system.
In Figure 7, we highlight (filled green circles) a particular YSO, Haro 6-39 in the Taurus region. We chose this source because, as the figure shows, it has very similar colors to EGB 6 (but is somewhat more luminous). E14 report that NIR spectra of Haro 6-39 show no absorption features, and it has H and He emission (again, a signature of accretion). Thus this YSO has several properties remarkably similar to those of the EGB 6 companion.
The direction of evolution of YSOs in Figure 7 is from right to left, i.e., from young, very red class 0/I protostars on the right, through class II and then to the least obscured and bluest class III objects on the left. The EGB 6 companion has the characteristics of a relatively young object—consistent with our interpretation of a recent accretion process—but with a very different origin from the true YSOs in Taurus and Scorpius. EGB 6 does have a luminosity, as represented by the magnitude, that is relatively low compared to most YSOs at the same color, which may reflect its different formation process.
There is an extensive literature on much closer binary systems among post-AGB stars. There is substantial evidence for interactions with the companion stars during the AGB mass-losing phase. Recently, for example, a dusty circumstellar disk has been directly imaged around the post-AGB binary IRAS 085444431 by Hillen et al. (2016). They have moreover detected a likely compact accretion disk around the binary companion in this system. However, with an orbital period of only 499 days, the companion is at least two orders of magnitude closer to the mass-losing star than in the case of EGB 6.
6 The Final Problems
To summarize, we have considered two scenarios to explain the astrophysical puzzles presented by EGB 6.
(1) One interpretation is that the MIR excess is due to a large-scale, optically thin dust disk surrounding the WD, making it an analog of the cool dust disks seen around a significant fraction of PNNi. In this case, the faint companion star is surrounded only by warm dust, located very close to the companion, and having an effective temperature of 1850 K, which accounts for the NIR excess flux. Evaporation from the outer surface, and photoionization due to illumination by the nearby hot WD, produce the compact emission-line nebula. To account for the optically thick dust shell around the companion star, we could speculate that it was produced by pulverized rocky bodies that passed very close to the M dwarf. In fact, the inferred radius of this shell, , is quite close to the tidal-disruption radius of a low-mass star.
(2) Alternatively, the central hot WD has a companion M dwarf (or possibly a second WD), which captured an optically thick accretion disk during the mass-ejection episode that produced the surrounding large PN a few times yr ago. In this picture, the system is descended from a binary similar to the present-day Mira—that is, a mass-losing AGB star accompanied by a distant main-sequence (or WD) companion. Both the NIR and MIR excesses of EGB 6 are due to this thick accretion disk. Its properties, including short-timescale variability, are similar to those of YSOs in star-forming regions. A portion of the accretion disk is evaporating rather than falling onto the companion, or there are possibly jets being ejected. Photoionization of the ejecta by the UV flux of the PNN produces the forbidden-emission-line source.
A key uncertainty in distinguishing between these possibilities is the currently unknown physical location of the MIR source. High-resolution imaging, or even just high-precision astrometry, with the James Webb Space Telescope might be able to make this distinction. Another useful program would be simultaneous NIR and MIR photometric monitoring of the EGB 6 nucleus. If both the NIR and MIR fluxes vary in tandem, it would argue strongly that they are located close together; but if the NIR variations are not associated with variations in the MIR, it could indicate physically separate locations.
Also useful would be to apply investigations as comprehensive as the ones described here to a larger sample of PNNi with IR excesses. Such studies would help us understand empirically whether all of the EGB 6-like central stars have binary companions, or whether these phenomena can arise even from single PN nuclei. As the fictional Sherlock Holmes pointed out, “it is a capital mistake to theorize before you have all the evidence.”
References
- (1)
- (2) Acker, A., Marcout, J., Ochsenbein, F., Stenholm, B., & Tylenda, R. 1992, The Strasbourg-ESO Catalogue of Galactic Planetary Nebulae. Parts 1 and 2 (Garching, Germany: European Southern Observatory)
- (3)
- (4) Bilíková, J., Chu, Y.-H., Gruendl, R. A., Su, K. Y. L., & De Marco, O. 2012, ApJS, 200, 3
- (5)
- (6) Bond, H. E., Ciardullo, R., & Meakes, M. G. 1992, in Evolutionary Processes in Interacting Binary Stars, ed. Y. Kondo, R. Sistero, & R. Polidan (Dordrecht: Kluwer), 517
- (7)
- (8) Calvet, N., & Hartmann, L. 1992, ApJ, 386, 239
- (9)
- (10) Cardelli, J. A., Clayton, G. C., & Mathis, J. S. 1989, ApJ, 345, 245
- (11)
- (12) Carpenter, J., Hillenbrand, L., & Skrutskie, M. 2001, AJ, 121, 3160
- (13)
- (14) Chu, Y.-H., Su, K. Y. L., Bilíková, J., et al. 2011, AJ, 142, 75 (C11)
- (15)
- (16) Ciardullo, R., & Bond, H. E. 1996, AJ, 111, 2332
- (17)
- (18) Ciardullo, R., Bond, H. E., Sipior, M. S., et al. 1999, AJ, 118, 488
- (19)
- (20) Clayton, G. C., De Marco, O., Nordhaus, J., et al. 2014, AJ, 147, 142 (C14)
- (21)
- (22) Conan Doyle, A. 1892, The Strand Magazine (London, UK), 3, 142
- (23)
- (24) De Marco, O., Passy, J.-C., Frew, D. J., Moe, M., & Jacoby, G. H. 2013, MNRAS, 428, 2118
- (25)
- (26) Dopita, M.A., & Liebert, J. 1989, ApJ, 347, 910 (DL89)
- (27)
- (28) Douchin, D., De Marco, O., Frew, D. J., et al. 2015, MNRAS, 448, 3132 (D15)
- (29)
- (30) Drake, A. J., Djorgovski, S. G., Mahabal, A., et al. 2009, ApJ, 696, 870
- (31)
- (32) Dressel, L., 2015, Wide Field Camera 3 Instrument Handbook, Version 7.0 (Baltimore: STScI)
- (33)
- (34) Dufour, R. J., Kwitter, K. B., Shaw, R. A., et al. 2015, ApJ, 803, 23
- (35)
- (36) Elias, J. H., Joyce, R. R., Liang, M., et al. 2006, Proc. SPIE, 6269, 62694C
- (37)
- (38) Ellis, G.L., Grayson, E.T., & Bond, H.E. 1984, PASP, 96, 283 (EGB)
- (39)
- (40) Esplin, T. L., Luhman, K. L., & Mamajek, E. E., 2014, ApJ, 784, 126 (E14)
- (41)
- (42) Farihi, J., Jura, M., & Zuckerman, B. 2009, ApJ, 694, 805
- (43)
- (44) Frew, D.J., & Parker, Q.A. 2010, PASA, 27, 129
- (45)
- (46) Frew, D. J., Parker, Q. A., & Bojičić, I. S. 2016, MNRAS, 455, 1459
- (47)
- (48) Fulbright, M.S., & Liebert, J. 1993, ApJ, 410, 275 (FL93)
- (49)
- (50) Furlan, E., Luhman, K. L., Espaillat, C., et al. 2011, ApJS, 195, 3
- (51)
- (52) Gianninas, A., Bergeron, P., Dupuis, J., & Ruiz, M.T. 2010, ApJ, 720, 581 (G10)
- (53)
- (54) Girven, J., Gänsicke, B. T., Steeghs, D., & Koester, D. 2011, MNRAS, 417, 1210
- (55)
- (56) Green, R.F., Schmidt, M., & Liebert, J. 1986, ApJS, 61, 305
- (57)
- (58) Griffin, M. J., Abergel, A., Abreu, A., et al. 2010, A&A, 518, L3
- (59)
- (60) Grindlay, J., Tang, S., Los, E., & Servillat, M. 2012, New Horizons in Time-domain Astronomy (IAU Symp. 285), ed. E. Griffin, R. Hanisch, & R. Seaman (Cambridge: Cambridge Univ. Press), 29
- (61)
- (62) Hawley, S. A. 1981, PASP, 93, 93
- (63)
- (64) Henry, R. B. C., Balick, B., Dufour, R. J., et al. 2015, ApJ, 813, 121
- (65)
- (66) Hillen, M., Kluska, J., Le Bouquin, J.-B., et al. 2016, A&A, in press
- (67)
- (68) Hoard, D. W., Debes, J. H., Wachter, S., Leisawitz, D. T., & Cohen, M. 2013, ApJ, 770, 21
- (69)
- (70) Huarte-Espinosa, M., Carroll-Nellenback, J., Nordhaus, J., Frank, A., & Blackman, E. G. 2013, MNRAS, 433, 295
- (71)
- (72) Ireland, M. J., Monnier, J. D., Tuthill, P. G., et al. 2007, ApJ, 662, 651 (I07)
- (73)
- (74) Jacoby, G. H., & van de Steene, G. 1995, AJ, 110, 1285
- (75)
- (76) Karovska, M., Hack, W., Raymond, J., & Guinan, E. 1997, ApJ, 482, L175
- (77)
- (78) Landolt, A. U. 1992, AJ, 104, 340
- (79)
- (80) Landolt, A. U. 2009, AJ, 137, 4186
- (81)
- (82) Lebouteiller, V., Barry, D. J., Spoon, H. W. W., et al. 2011, ApJS, 196, 8
- (83)
- (84) Liebert, J., Bond, H. E., Dufour, P., et al. 2013, ApJ, 769, 32 (L13)
- (85)
- (86) Liebert, J., Green, R., Bond, H. E., et al. 1989, ApJ, 346, 251 (L89)
- (87)
- (88) Luhman, K. L., & Mamajek, E. E. 2012, ApJ, 758, 31
- (89)
- (90) Makovoz, D., & Marleau, F. R. 2005, PASP, 117, 1113
- (91)
- (92) Mann, A. W., & von Braun, K. 2015, PASP, 127, 102
- (93)
- (94) Miszalski, B., Acker, A., Parker, Q. A., et al. 2011, in Asymmetric Planetary Nebulae 5, ed. A. A. Zilstra et al. (Jodrell Bank: Jodrell Bank Centre for Astrophysics)
- (95)
- (96) Morales-Calderón, M., Stauffer, J. R., Hillenbrand, L. A., et al. 2011, ApJ, 733, 50
- (97)
- (98) Ott, S. 2010, in ASP Conf. Ser. 434, Astronomical Data Analysis Software and Systems XIX, ed. Y. Mizumoto, K.-I. Morita, & M. Ohishi (San Francisco, CA: ASP), 139
- (99)
- (100) Perets, H. B., & Kenyon, S. J. 2013, ApJ, 764, 169 (PK13)
- (101)
- (102) Poglitsch, A., Waelkens, C., Geis, N., et al. 2010, A&A, 518, L2
- (103)
- (104) Roeser, S., Demleitner, M., & Schilbach, E. 2010, AJ, 139, 2440
- (105)
- (106) Schlafly, E. F. & Finkbeiner, D. P. 2011, ApJ, 737, 103
- (107)
- (108) Soker, N., & Rappaport, S. 2000, ApJ, 538, 241
- (109)
- (110) Sokoloski, J. L., & Bildsten, L. 2010, ApJ, 723, 1188
- (111)
- (112) Stone, N., Metzger, B. D., & Loeb, A. 2015, MNRAS, 448, 188 (SML15)
- (113)
- (114) Su, K., Bilíková, J., Chu, Y.-H., et al. 2011, in Asymmetric Planetary Nebulae 5, ed. A. A. Zilstra et al. (Jodrell Bank: Jodrell Bank Centre for Astrophysics)
- (115)
- (116) Su, K. Y. L., Chu, Y.-H., Rieke, G. H., et al. 2007, ApJ, 657, L41 (S07)
- (117)
- (118) Tremblay, P.-E., Bergeron, P., & Gianninas, A. 2011, ApJ, 730, 128
- (119)
- (120) Tweedy, R.W., & Kwitter, K.B. 1996, ApJS, 107, 255
- (121)
- (122) van Loon, J. T., Oliveira, J. M., Gordon, K. D., Sloan, G. C., & Engelbracht, C. W. 2010, AJ, 139, 1553
- (123)
- (124) Yuan, H. B., & Liu, X. W. 2013, MNRAS, 436, 718
- (125)
- (126) Zacharias, N., Finch, C., Girard, T., et al. 2013, AJ, 145, 44
- (127)
- (128) Zuckerman, B., Becklin, E. E., & McLean, I. S. 1991, Astrophysics with Infrared Arrays (ASP Conf. Ser. 14), ed. R. Elston (San Francisco, CA: ASP), 161
- (129)
| Date | Camera | Filter | Total | or aaFor the broad-band filters, this column contains the total flux density ( in ) measured for the central source. For [O III] and H (F502N and F656N, this column contains the monochromatic line flux for the emission knot ( in ). |
|---|---|---|---|---|
| Exposure [s] | ||||
| 2013 Dec 6 | WFC3/UVIS | F225W | 15 | |
| ′′ | ′′ | F275W | 15 | |
| ′′ | ′′ | F336W | 15 | |
| ′′ | ′′ | F502N | 360 | |
| ′′ | ′′ | F555W | 15 | |
| ′′ | ′′ | F656N | 720 | |
| ′′ | ′′ | F814W | 30 | |
| ′′ | WFC3/IR | F160W | 20.47 |
Note. — Observations were made in program GO-13469 (PI: H.E.B.)
| Date | Separation [′′] | PA (J2000) [∘] | Source |
|---|---|---|---|
| 1991.9198 | Liebert et al. (2013) | ||
| 1993.0942 | ′′ | ||
| 1995.7768 | ′′ | ||
| 2013.9314 | This paperaaErrors were estimated from the agreement between the [O III] and H measurements. |
| UT Date | Source | ||||
|---|---|---|---|---|---|
| 1978 Apr 10 | 16.05 | L89 | |||
| 1982 Apr 24 | 16.00 | EGB; L89 | |||
| 1991 Jan 9 | 15.992 | This paper | |||
| 1994 May 20 | 15.995 | ′′ | |||
| 1998 Mar 20 | 16.018 | ′′ | |||
| 2007 Nov 2 | 16.001 | De Marco et al. 2013 | |||
| 2007 Nov 5 | 15.997 | ′′ | |||
| 2011 Mar 11 | 15.991 | Douchin et al. 2015 | |||
| 2011 Mar 16 | 16.004 | ′′ | |||
| 2016 Mar 14 | 15.992 | This paper | |||
| 2016 Mar 17 | 15.989 | ′′ | |||
| MeanaaThe photoelectric measurements from 1978 & 1982 are not included in the means & | 15.998 | ||||
| error | 0.003 | 0.003 | 0.004 | 0.010 |
| Date | No. of | [Ne III] | [O III] | H | [O III] | [O III] |
|---|---|---|---|---|---|---|
| Interval | Spectra | 3869 | 4363 | 4959 | 5007 | |
| 2004.1–2004.3 | 2 | 2.0 | 0.9 | 2.1 | 5.8 | 18.7 |
| 2004.9–2005.4 | 6 | 2.3 | 1.0 | 2.3 | 5.5 | 16.8 |
| 2005.9–2006.4 | 6 | 2.2 | 1.0 | 2.6 | 5.8 | 17.8 |
| 2007.0–2007.3 | 5 | 2.1 | 0.9 | 2.2 | 5.5 | 17.2 |
| 2007.9–2008.5 | 6 | 1.7 | 1.2 | 2.2 | 5.5 | 16.6 |
| 2008.9–2009.3 | 7 | 2.0 | 1.2 | 2.4 | 5.5 | 17.3 |
| 2010.0–2010.4 | 6 | 1.8 | 1.2 | 2.4 | 5.8 | 17.4 |
| 2011.0–2011.2 | 5 | 1.8 | 1.2 | 2.6 | 5.9 | 17.9 |
| 2011.9–2012.1 | 4 | 1.5 | 1.3 | 2.6 | 6.4 | 17.8 |
| Mean 1.5-m spectrum | 47 | 1.9 | 1.1 | 2.4 | 5.7 | 17.4 |
| 1978–1982aaFrom L89, Table 2C; these are mean equivalent widths from spectra obtained in 1978–1987 | 1.7 | 1.1 | 2.9 | 5.4 | 17.9 | |
| 2016.25 Asiago 1.22-mbbAsiago 1.22-m, 2016 April 3 | 1.7 | 1.7 | 1.9 | 6.4 | 18.4 |
| Bandpass | Magnitude | SourceaaSources for magnitudes or fluxes are: D15 (Douchin et al. 2015, who quote values from SDSS); FL93 (Fulbright & Liebert 1993, mean values); the Mikulski Archive for Space Telescopes (http://galex.stsci.edu) for GALEX; the NASA/IPAC Infrared Science Archive (http://irsa.ipac.caltech.edu/frontpage) for 2MASS and WISE; C11 (Chu et al. 2011) for Spitzer IRAC and MIPS; our §4.1 for Herschel. | bbEffective wavelengths are from http://galex.stsci.edu for GALEX; http://www.astro.ucla.edu/∼wright/WISE/passbands.html for the WISE bands; http://irsa.ipac.caltech.edu/data/SPITZER/docs/irac/iracinstrumenthandbook/ and http://irsa.ipac.caltech.edu/data/SPITZER/docs/mips/mipsinstrumenthandbook/ for Spitzer IRAC and MIPS; and Douchin et al. (2015) for UBVRI, ugriz, JHK, and JHKs. | ccPhotometric zero-points are from http://galex.stsci.edu for GALEX; Mann & von Braun (2015) for UBVRI and ground-based JHK; from the compilation at http://coolwiki.ipac.caltech.edu/index.php/Central_wavelengths_and_zero_points for 2MASS and AllWISE; and from http://www.sdss.org/dr12/algorithms/fluxcal for SDSS. |
|---|---|---|---|---|
| [m] | [] | |||
| FUV | 13.75 | GALEX | 0.1516 | |
| NUV | 14.58 | GALEX | 0.2267 | |
| 14.465 | D15 | 0.3597 | ||
| 15.688 | Table 3 | 0.4386 | ||
| 15.998 | Table 3 | 0.5491 | ||
| 16.132 | Table 3 | 0.6500 | ||
| 16.308 | Table 3 | 0.7884 | ||
| 15.199 | D15 | 0.3586 | ||
| 15.660 | D15 | 0.4716 | ||
| 16.216 | D15 | 0.6165 | ||
| 16.563 | D15 | 0.7475 | ||
| 16.906 | D15 | 0.8922 | ||
| 16.38 | FL93 | 1.237 | ||
| 16.08 | FL93 | 1.645 | ||
| 15.65 | FL93 | 2.212 | ||
| 16.518 | 2MASS | 1.241 | ||
| 15.945 | 2MASS | 1.651 | ||
| 16.099 | 2MASS | 2.165 | ||
| 1 | 14.651 | AllWISE | 3.37 | |
| 2 | 13.636 | AllWISE | 4.62 | |
| 3 | 9.520 | AllWISE | 12.08 | |
| 4 | 7.170 | AllWISE | 22.19 | |
| IRAC 1 | C11 | 3.550 | ||
| IRAC 2 | C11 | 4.493 | ||
| IRAC 3 | C11 | 5.731 | ||
| IRAC 4 | C11 | 7.872 | ||
| MIPS 1 | C11 | 23.68 | ||
| PACS | Herschel | 70 |