The star-formation rate density from z = 1-6 ††thanks: Herschel is an ESA space observatory with science instruments provided by European-led Principal Investigator consortia and with important participation from NASA.
Abstract
We use 3035 Herschel-SPIRE 500m sources from 20.3 sq deg of sky in the HerMES Lockman, ES1 and XMM-LSS areas to estimate the star-formation rate density at z = 1-6. 500 m sources are associated first with 350 and 250 m sources, and then with Spitzer 24 m sources from the SWIRE photometric redshift catalogue. The infrared and submillimetre data are fitted with a set of radiative-transfer templates corresponding to cirrus (quiescent) and starburst galaxies. Lensing candidates are removed via a set of colour-colour and colour-redshift constraints. Star-formation rates are found to extend from 1 to 20,000 . Such high values were also seen in the all-sky IRAS Faint Source Survey. Star-formation rate functions are derived in a series of redshift bins from 0-6, combined with earlier far-infrared estimates, where available, and fitted with a Saunders et al (1990) functional form. The star-formation-rate density as a function of redshift is derived and compared with other estimates. There is reasonable agreement with both infrared and ultraviolet estimates for z 3, but we find higher star-formation-rate densities than ultraviolet estimates at z = 3-6. Given the considerable uncertainties in the submillimetre estimates, we can not rule out the possibility that the ultraviolet estimates are correct. But the possibility that the ultraviolet estimates have seriously underestimated the contribution of dust-shrouded star-formation can also not be excluded.
keywords:
infrared: galaxies - galaxies: evolution - star:formation - galaxies: starburst - cosmology: observations1 Introduction
The history of the determination of the evolution of the integrated star-formation rate density has been controversial. Lilley at al (1996) and Madau et al (1996) gave estimates based purely on the ultraviolet (uv) light from galaxies, with a correction for extinction based on a screen model. Rowan-Robinson et al (1997) showed from ISO data that these estimates were likely to be significantly underestimated. More recent uv surveys (e.g. Wyder et al 2005, Schiminovich et al 2005, Dahlen et al 2007, Reddy and Steidel (2009), Cucciati et al 2012) and infrared (ir) surveys (eg Sanders et al 2003, Takeuchi et al 2003, Magnelli et al 2011, 2013, Gruppioni et al 2013) are now in reasonable agreement for z 3. The Gruppioni et al (2013) study of Herschel sources at 70, 100 and 160 m is especially significant in capturing the total far infrared luminosity, and hence a more accurate estimate of the star- formation rate. Madau and Dickinson (2014) have given a comprehensive review of the current situation.
At higher redshifts (z 4-10) we have only ultraviolet estimates (Bouwens et al 2012a,b, Schenker et al 2013) and so the problem remains: is the contribution of dust-shrouded star-formation being properly accounted for? The problem can be seen clearly by imagining external observations of our own Galaxy. The blue and ultraviolet light would be dominated by young stars which would be subject to an average extinction of a few tenths of a magnitude, due to the dust spread through the interstellar medium. The infrared emission from this optically thin dust makes up the infrared ‘cirrus’. However the contribution of newly formed stars embedded in dense molecular clouds would not be accounted for. In the case of our Galaxy this would result in an underestimate of the total star-formation rate by only about 10, but for luminous starbursts the underestimate could be over a factor of 100.
To address this question we really need to analyse the star-formation history separately for relatively quiescent galaxies like our own and for starburst galaxies. In the latter star formation appears to be driven primarily by major mergers whereas for quiescent galaxies the driver is either interaction with companions or infall of gas from the cosmic web (Daddi et al 2010, Rodighiero et al 2011).
The Herschel mission (Pilbratt et al 2010) gives us for the first time samples of galaxies for which we have the full ultraviolet to submillimetre spectral energy distributions (SEDs) reaching out to z = 6 and so allows us to explore the evolution of the star-formation rate density beyond z = 3. The samples we focus on in this paper are from the HerMES survey (Oliver et al 2012), made with the SPIRE sub-millimetre camera (Griffin et al 2010) and are selected at 500 m, where the negative K-correction gives us greater visibility of the high redshift universe than selection at 250 or 350 m (Franceschini et al 1991). 500 m selection also has the benefit that in the majority of cases we have 250 and 350 m data, which give us valuable spectral energy distribution (SED) information. Rowan-Robinson et al (2014) have given a very detailed discussion of the SEDs of a sample of 957 galaxies in the HerMES-Lockman area. Here we extend the sample to the ES1 and XMM-LSS areas of the HerMES survey.
The structure of this paper is as follows: in section 2 we define our samples and describe the determination of the star-formation rate via modelling of the spectral energy distributions (SEDs). In section 3 we derive the star-formation rate function in redshift bins from z = 0-6. In section 4 we use this information to determine the evolution of the star-formation rate density. Section 5 gives our discussion and conclusions.
A cosmological model with =0.7, =0.72 has been used throughout.
| field | area in common | no. of 500 m | candidate | no. of 500 m sources | limiting 500 m |
|---|---|---|---|---|---|
| with SWIRE (sq deg) | sources | lenses | not associated with SWIRE | flux-density (mJy) | |
| Lockman | 7.5 | 957 | 109 | 368 | 25 |
| ES1 | 3.8 | 478 | 48 | 205 | 25 |
| XMM-LSS | 9 | 767 | 72 | 259 | 30 |
| EN1 | 3.1 | 116 | 23 | 5 | 40 |
| CDFS | 2.9 | 129 | 17 | 22 | 40 |
2 Determination of star-formation rate through SED modelling
The Lockman sample has been studied in detail by Rowan-Robinson et al (2014). Our starting point was the HerMES SPIRE (SCAT) 500 m catalogue (Wang et al 2014a) with sources detected at 500 m without using any prior information from other SWIRE bands (i.e. ‘blind’ 500 m catalogue). 500 m sources from the HerMES survey in Lockman were associated first with 350 m sources, and only accepted as credible if there was a good (5-) 350 m detection, and then with 250 m sources and with galaxies from the SWIRE photometric redshift catalogue (Rowan-Robinson et al 2013), using automated SED fits to the SWIRE data to select the most likely 24 m association. There are then 957 sources for which we have SEDs from 0.36 to 500 m, and a further 368 500-350-250 m sources with no SWIRE counterpart. The 957 sources with SWIRE counterparts were modelled with an automatic infrared template-fitting routine using a set of standard templates: M82 and A220 starbursts, a young starburst template, normal and cool cirrus templates, and an AGN dust torus template. These templates have been derived from full radiative-transfer treatments (Efstathiou et al 2000, Efstathiou and Rowan-Robinson 2003, Rowan-Robinson 1995). Full details of the templates used are given via a readme page 111http://astro.ic.ac.uk/public/mrr/swirephotzcat/templates/readme.
109 lensing candidates were identified through their anomalous SEDs, which in Rowan-Robinson et al (2013) we characterised by a set of colour-colour and colour-redshift constraints. These lensing candidates have been removed from the present study, leaving a sample 0f 848 submillimetre galaxies with SWIRE counterparts.
We have applied a similar analysis to the ES1, EN1, XMM-LSS and CDFS areas within the HerMES survey. A detailed discussion of the HerMES catalogues, and their completeness and reliability is given by Wang et al (2014a). Full details of the SWIRE photometric redshift catalogue in these areas are given via a readme page 222http://astro.ic.ac.uk/public/mrr/swirephotzcat/readmeSWIRErev, including details of reprocessing of the XMM-LSS and ES1 areas to take advantage of new photometry. Table 1 summarises the areas and numbers of sources for each region. Plots of S24 versus S500 for each region (not shown here) allow an estimate of the 500 m completeness limit for each region. Because we require sources to be detected at both 500 and 350 m at 5 times the total noise (confusion plus instrumental), our completeness limits are higher than the confusion limits quoted by Nguyen et al (2010), Wang et al (2014a). Only ES1 and XMM-LSS are of comparable depth to Lockman (25 mJy): these regions have been added to the present study, yielding a total area covered of 20.3 sq deg. The EN1 and CDFS areas do not play a part in the remainder of the paper.
Because our detection threshold at 500 m is set at 5-, where is the total (confusion plus instrumental) noise, we do not believe our sample is seriously compromised by completeness or confusion issues. An extensive discussion of confusion and misassociation issues was given by Rowan-Robinson et al (2014). The chance of misassociation with the wrong 24 m counterpart was estimated as 5.
As the templates used are derived from full radiative transfer models they allow the star-formation rate to be estimated for each galaxy. The conversion factors from the infrared luminosity have been given by Rowan-Robinson et al (2008). The models are spherically symmetric and do not account, for example, for the possibility of multiple starburst locations in a galaxy. In the case of cirrus components, where optically thin dust is heated by starlight, we have made a correction here for the contribution of old stars to the heating. To do this we use the approximation noted by Rowan-Robinson (2003), that the optical-nir SEDs of Hubble sequence galaxies can be modelled as a superposition of an elliptical galaxy template, representing stars older than 1 Gyr, and a residual component due to young stars which varies with Hubble type. We use the flux at 1.25 m as a measure of the old star component.
The fraction of infrared radiation contributed by young stars in a galaxy of type t, y(t), is then estimated as
| (1) |
where
| (2) |
and is the absorption efficiency of the dust grains.
The star formation rate for cirrus components is then calculated from . Table 2 gives the calculated values of y as a function of the optical template type.
| j2 | 1 | 2 | 3 | 4 | 5 | 6 | 7 | 8 | 9 | 10 | 11 |
|---|---|---|---|---|---|---|---|---|---|---|---|
| type | E | E’ | Sab | Sbc | Scd | Sdm | sb | ||||
| y | 0.0 | 0.0 | 0.360 | 0.288 | 0.216 | 0.412 | 0.607 | 0.752 | 0.896 | 0.866 | 0.835 |
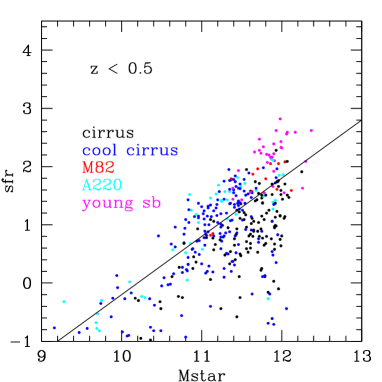
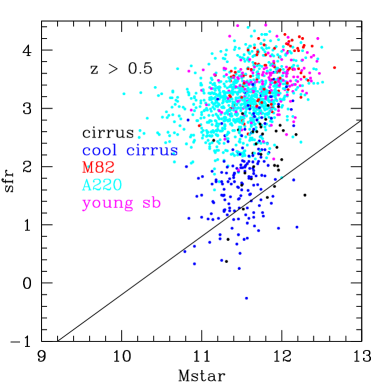
The optical templates used for the SWIRE photometric redshift catalogue were fitted with stellar synthesis codes and so give estimates of the stellar mass (Rowan-Robinson et al 2008). Figure 1 shows the star formation rate versus stellar mass for 1983 unlensed Lockman+XMM+ES1-SWIRE sources, colour-coded by the dominant SED template component, divided into z 0.5 (L) and z 0.5 (R). There is a reasonably clear distinction in Fig 1 between quiescent galaxies, modelled with cirrus templates and with star-formation rate 100 , and starburst galaxies, with star-formation rates greater than this. However our distinction between starburst and quiescent galaxies is based on SED type not on location in the sfr- diagram, unlike the main-sequence′ locus (Brinchmann et al 2004, Daddi et al 2007, 2010, Elbaz et al 2007, Noeske et al 2007, Genzel et al 2010, Rodighiero et al 2014). 32 of the 848 unlensed Lockman galaxies are fitted with a QSO template at 0.36-4.5 m and do not feature in Fig 1.
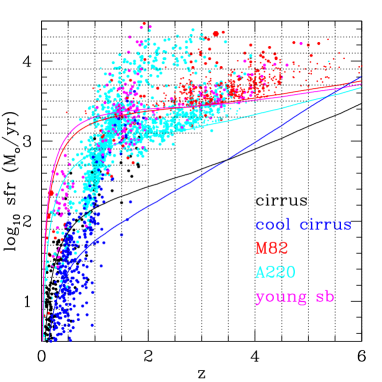
Figure 2L shows the star-formation rate versus redshift for Lockman+XMM+ES1 sources, with loci showing the selection imposed by the 500 m sensitivity limit of 25 mJy for different template types. Galaxies of a certain type can fall below the limit imposed by the 500 m limit for that type because SEDs can be modelled with a mixture of template types, which contribute to different wavelength ranges. We see that the selection loci for M82 starbursts and for young starbursts are almost identical. Of the 848 unlensed Lockman galaxies, 255 use an AGN dust torus template in the far infrared and submillimetre SED fit ( and these do not contribute to the star-formation rate) but for only two objects is an AGN dust torus the dominant contribution to the infrared luminosity.
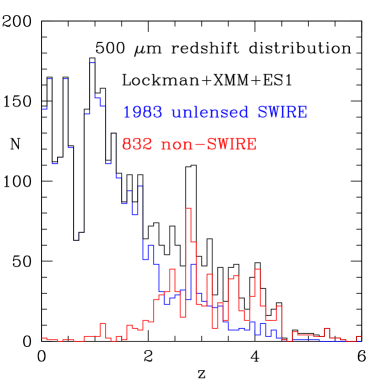
We have also estimated photometric redshifts for the unidentified 500 m sources from the 250-500 m fluxes, allowing M82, Arp220 or young starburst templates, and these are shown as small filled circles in Fig 2L. Redshifts for these generally range from z = 2-6. The redshift distribution for both (unlensed) identified and unidentified sources in Lockman+XMM+ES1 is shown in Fig 3. 60 of our redshifts from 2-4 and almost all those at z4 are unidentified sources. Cirrus galaxies at z =1-2 could give similar 250-500m colours to starbursts at z = 4-6. However it would not be be possible for them to be detected at 500 and 350 m, but not at 24, 3.6m and in the r-band. So they could not contribute to the unidentified sources. There can be no cirrus galaxies at z2 in this sample because their infrared luminosity would exceed the maximum possible for an optical galaxy. Thus it is reasonable to use only starburst templates in estimating the redshifts of unidentified sources.
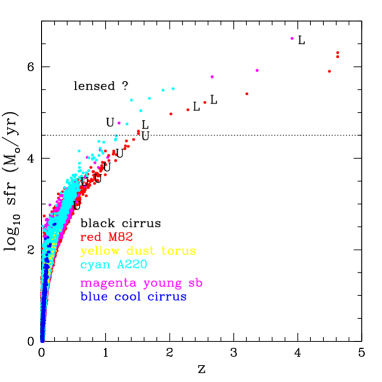
It is striking that star-formation rates extend up to 20,000 . Such enormous star-formation rates can presumably last for no more than yrs, compared with yrs for local starbursts (Genzel et al 1998, Rowan-Robinson 2000). Such high star-formation rates have been seen before in the IRAS hyperluminous galaxies (Rowan-Robinson 2000, Rowan-Robinson and Wang 2010). Figure 2R shows the star-formation rate versus redshift for the RIFSCz catalogue (Wang et al 2014b), with known lensed sources indicated by L, and sources for which Hubble Space Telescope imaging (Farrah et al 2002) shows no sign of lensing indicated by U. The boundary between lensed and unlensed sources appears to fall at a star-formation rate of 30,000 . In the case of the all-sky RIFSCz, selected at 60 m, we see rare, exceptionally strongly lensed galaxies, in which the optical emission is also from the lensed galaxy. Typically the surface-density of such objects is 0.001 . For the HerMES 500 m-selected candidate lensed galaxies, the optical emission is from the lensing galaxy and the surface density of candidate lenses is 10,000 times greater, .
3 Reliability of z 4 photometric redshifts
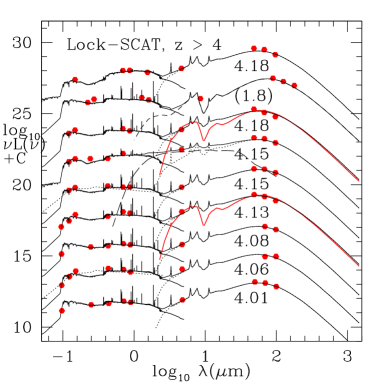
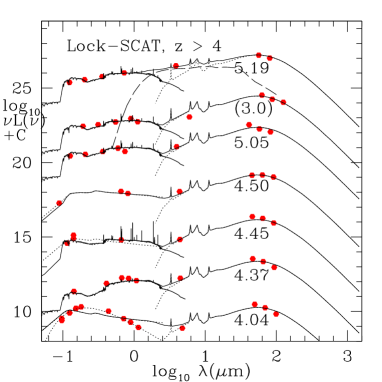
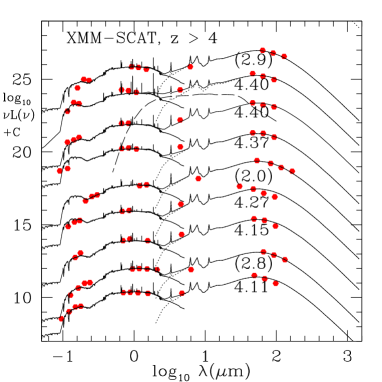
The reliability of SWIRE photometric redshifts has been discussed by Rowan-Robinson et al (2013). Provided at least 5 photometric bands are available, photometric redshifts have an rms accuracy better than 5 and a catastrophic outlier rate out to z = 1.5. Beyond this redshift we have few spectroscopic redshifts available and the plausibility of redshifts can only be tested through SED plotting. The 24 and 250-500 m fluxes can be helpful here. Figures 4 and 5 show SEDs of Lockman, XMM-LSS and ES1 500 m sources with photometric redshifts 4. Most of these look plausible. 160.02754+58.22380, the bottom source in Fig 3R, has a blackbody spectrum in the optical and is therefore a star. The submillimetre source has been transferred to the unidentified category. Of the other 26 objects one (162.68120+57.55606) has been fitted with a QSO template at optical-nir wavelengths, but several others could also be fitted with a QSO template (shown as dotted loci).
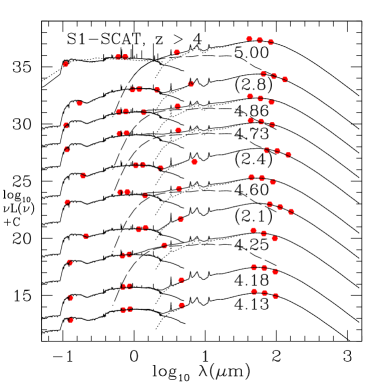
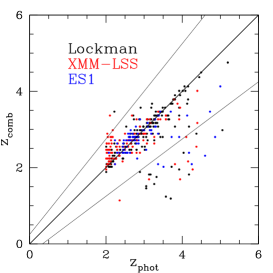
We can make an independent estimate of the redshift from the submillimeter (250-500 m data), , using the best fit M82, Arp220 or young starburst templates. This is valuable in selecting between aliases. For all galaxies with we have estimated . Figure 6L shows versus for Lockman, XMM-LSS and S1 galaxies. We estimate the uncertainty in as of (1+z) (see discussion of distributions below). We have also summed and and estimated , where the combined is a minimum. Figure 6R shows a plot of versus . Generally , with an rms uncertainty of in (1+z), showing that the submillimetre data are consistent with . However there are 27 catastrophic outliers (out of 388 galaxies) where (1+) differs from (1+) by more than 30 from (1+). 12 of these outliers had . For these 27 outliers we have adopted rather than in the subsequent analysis. For it is not possible to make a meaningful estimate of because of the presence of cirrus components, which alias catastrophically with Arp 220 starbursts.
Figure 7 shows , and the sum of these for the galaxies in Lockman. The distributions demonstrate that the uncertainty in is of (1+z), due to the different redshifts generated by the different templates seen in luminous starbursts. For galaxies where differs significantly from we have shown SED fits for both and (labelled with redshifts in brackets) in Fig 4 and 5.
We have tested the reliability of our estimates by applying them to 28 Herschel sources with measured spectroscopic redshifts (Cox et al 2011, Lupu et al 2012, Combes et al 2012, Riechers et al 2013, Wardlow et al 2013, Dowell et al 2014, Rowan-Robinson et al 2013). Figure 6R shows versus for these galaxies. The rms error in was found to be 21.
Table 3 lists all the objects with photometric redshift 4, together with and . In the end the reliability of these redshifts can only be demonstrated with optical or submillimetre spectroscopy. This limitation, that redshifts 4 are entirely photometric, applies equally to the ultraviolet-based studies of Bouwens et al (2012a,b) and Schenker et al (2013).
| RA | dec | i | S24 | S250 | S350 | S500 | type | ||||||
| (Jy) | (mJy) | (mJy) | (mJy) | (opt-nir) | |||||||||
| Lockman | |||||||||||||
| 162.84616 | 58.00514 | (g=24.41) | 179.3 | 34.4 | 40.1 | 32.4 | 4.01 | sb | 13.0 | 5 | 3.6 | 4.0 | |
| 162.46065 | 58.11701 | 21.96 | 252.5 | - | 28.4 | 41.4 | 4.06 | sb (QSO?) | 7.9 | 6 | 4.8 | 4.1 | |
| 163.90918 | 57.94004 | (g=24.48) | 135.0 | - | 36.7 | 31.9 | 4.08 | sb | 12.6 | 5 | 3.9 | 4.0 | |
| 161.98271 | 58.07477 | 22.10 | 264.4 | 44.2 | 45.3 | 33.6 | 4.13 | sb | 25.4 | 6 | 3.2 | 3.7 | |
| 163.51913 | 58.28540 | 22.35 | 138.4 | 28.1 | 37.2 | 30.3 | 4.15 | sb (QSO?) | 1.0 | 5 | 3.8 | 4.1 | |
| 164.28366 | 58.43524 | 22.30 | 596.0 | 43.5 | 51.0 | 37.4 | 4.15 | Scd | 60.0 | 5 | 2.5 | 3.8 | |
| 164.02647 | 57.07153 | 22.28 | 252.3 | 43.2 | 35.2 | 26.0 | 4.18 | sb | 2.5 | 4 | 2.7 | 1.8 | low-z alias |
| 164.52054 | 58.30782 | 23.40 | 306.9 | 81.9 | 92.1 | 58.2 | 4.18 | Sab | 0.03 | 3 | 2.2 | 3.1 | |
| 160.02754 | 58.22380 | 18.74 | 168.2 | 69.5 | 57.5 | 31.4 | 4.04 | QSO | 61.6 | 11 | 2.4 | star | |
| 161.89894 | 58.16401 | 23.60 | 315.0 | 66.4 | 59.7 | 35.3 | 4.37 | Sab | 22.7 | 4 | 1.8 | 2.9 | |
| 162.42290 | 57.18750 | 22.25 | 121.0 | 43.5 | 46.1 | 32.6 | 4.45 | sb (QSO?) | 5.6 | 4 | 3.2 | 4.4 | |
| 162.68120 | 57.55606 | (g=24.35) | 194.9 | 25.5 | 37.0 | 38.3 | 4.50 | QSO | 1.3 | 3 | 4.8 | 4.5 | |
| 161.58835 | 59.65826 | 23.71 | 156.0 | 48.1 | 35.1 | 31.8 | 5.05 | Scd | 4.7 | 5 | 3.0 | 3.0 | |
| 161.63013 | 59.17688 | 23.94 | 391.4 | - | 29.6 | 27.0 | 5.19 | Scd | 4.8 | 4 | 3.0 | 4.8 | |
| ES1 | |||||||||||||
| 7.98209 | -43.29812 | R=24.87 | 275.8 | 45.6 | 49.7 | 38.8 | 4.13 | Sab | 0.02 | 3 | 2.5 | 3.4 | |
| 9.28433 | -44.23750 | R=25.06 | 437.0 | 62.5 | 72.5 | 51.5 | 4.18 | Scd | 0.03 | 3 | 3.4 | 3.5 | |
| 9.08571 | -42.59628 | R=24.89 | 271.8 | 95.7 | 76.3 | 41.3 | 4.25 | Scd | 0.85 | 3 | 2.3 | 2.1 | low-z alias |
| 9.11142 | -42.84052 | R=24.44 | 354.5 | 37.6 | 45.0 | 30.1 | 4.60 | Scd | 0.03 | 3 | 2.1 | 2.4 | low-z alias |
| 8.70199 | -44.48560 | R=25.38 | 423.0 | 31.2 | 36.1 | 27.1 | 4.73 | Scd | 0.01 | 3 | 3.5 | 3.9 | |
| 9.30474 | -43.03506 | R=25.19 | 504.5 | 39.6 | 36.3 | 26.3 | 4.86 | Scd | 0.09 | 3 | 2.9 | 2.8 | |
| 9.19681 | -44.42382 | R=24.35 | 249.1 | 39.2 | 43.2 | 41.0 | 5.00 | sb (QSO?) | 0.04 | 3 | 4.0 | 4.1 | |
| XMM-LSS | |||||||||||||
| 35.73369 | -5.62305 | 23.42 | 422.0 | 73.1 | 60.9 | 42.1 | 4.11 | Sbc | 4.1 | 6 | 2.6 | 2.8 | |
| 34.26031 | -4.95556 | 24.95 | 451.0 | 55.2 | 61.6 | 35.6 | 4.15 | Sbc | 3.9 | 4 | 2.0 | 2.2 | low-z alias |
| 36.25277 | -5.59534 | 23.94 | 511.7 | 57.9 | 42.0 | 33.6 | 4.27 | Scd | 1.2 | 5 | 2.7 | 2.0 | low-z alias |
| 35.73605 | -4.88950 | (g=25.02) | 421.5 | 40.6 | 51.9 | 40.5 | 4.37 | Scd | 11.4 | 6 | 3.7 | 2.6 | |
| 36.65871 | -4.14628 | 24.91 | 288.8 | 46.1 | 45.7 | 48.1 | 4.40 | Sbc | 2.1 | 6 | 4.0 | 4.4 | |
| 34.53469 | -5.00769 | 23.47 | 342.8 | 47.3 | 42.4 | 35.8 | 4.40 | sb | 4.0 | 5 | 2.3 | 2.9 |


4 The star-formation rate function
We can use the data displayed in Fig 2L (and the corresponding data in XMM-LSS and ES1) to determine the star-formation rate function over the redshift range 0-6. We use bins of 0.5 in z, and 0.2 dex in SFR = . Ideally we would do this for each template type but our sample is not large enough to do this so we perform this analysis for the two broad population types, starburst (M82+A220+young starburst) and quiescent (normal cirrus + cool dust + cold dust). For each of these two populations we use the most conservative sensitivity limit locus, the M82 template for starbursts and the normal cirrus template for quiescent galaxies.
| z = | 0.25 | 0.75 | 1.25 | 1.75 | 2.25 | 2.75 | 3.25 | 3.75 | 4.25 | 4.75 | 5.25 | 5.75 |
|---|---|---|---|---|---|---|---|---|---|---|---|---|
| quiescent | ||||||||||||
| no. of gals in fit | 106 | 38 | 41 | |||||||||
| -2.43 | [-2.51] | [-2.92] | ||||||||||
| -0.38 | -0.03 | 0.67 | ||||||||||
| starburst | ||||||||||||
| no. of gals used in LFs | 68 | 95 | 295 | 219 | 230 | 252 | 172 | 158 | 89 | 14 | 21 | 5 |
| of which, unassociated | 4 | 6 | 18 | 23 | 130 | 158 | 81 | 132 | 79 | 12 | 20 | 5 |
| -3.30 | -3.11 | -3.42 | -3.50 | -3.49 | -3.50 | [-3.48] | [-3.48] | [-3.48] | [-3.48] | [-3.48] | [-3.48] | |
| 0.27 | 0.93 | 1.57 | 1.66 | 1.66 | 1.80 | 1.68 | 1.85 | 1.88 | 1.69 | 1.76 | 1.65 | |
| median no. of | 10 | 8 | 6 | 6 | 6 | 5 | 5 | 5 | 4 | 4 | 4 | 3 |
| photom. bands | ||||||||||||
| sfrd | -1.90 | -1.28 | -0.95 | -1.06 | -1.05 | -0.82 | -0.99 | -0.82 | -0.79 | -0.99 | -0.92 | -1.03 |
| +0.27 | +0.18 | +0.14 | +0.18 | +0.14 | +0.29 | +0.28 | +0.32 | |||||
| -0.09 | -0.09 | -0.41 | -0.36 | -0.41 | -0.46 | -0.44 | -0.38 |
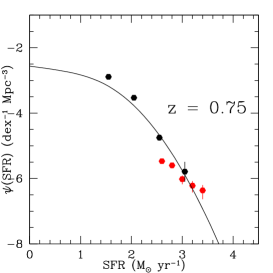
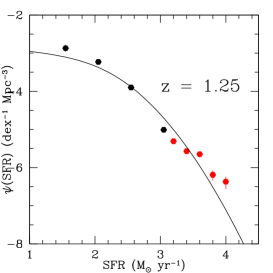
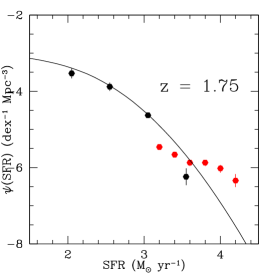
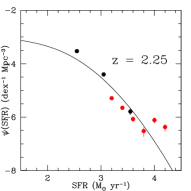
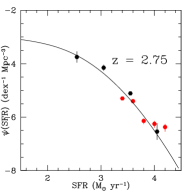
For each bin of redshift and sfr we estimate the contribution to the dust-enshrouded star-formation-rate density (sfrd) as n(A V), where n is the number of sources in the bin, A is the area of the survey (20.3 sq deg), and V is the co-moving volume sampled by the bin. For each redshift bin we then fit the star-formation-rate function with a Saunders functional form (Saunders et al 1990):
However because we see only the high luminosity end of the star-formation-rate function we can not
determine all the parameters of the luminosity function freely from the present samples on their own
in all redshift bins.
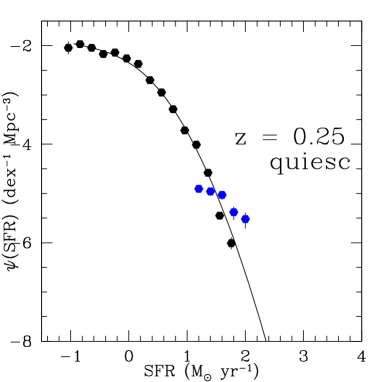
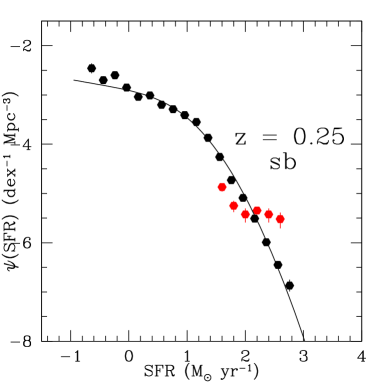
For z 0.5 (Fig 8) we combine our data with the Saunders et al (1990) cool′ and warm′ 60 m luminosity functions as representative of the quiescent and starburst populations, respectively, with a conversion from 60 m luminosity to star-formation rate of sfr = , where is in solar units (Rowan-Robinson et al 1997). The accuracy of the Saunders et al (1990) luminosity functions has been confirmed in many subsequent analyses, including the Wang and Rowan-Robinson (2010) determination of the 60 m luminosity function from the IRAS FSS Redshift Catalogue, which gave almost identical results to Saunders et al (1990). Other recent determinations of the far infrared and submillimetre local luminosity functions include Vaccari et al (2010), Patel et al (2013) and Marchetti et al (2016). There is reasonable consistency between our 500m selected determination of the star-formation rate function for starburst and quiescent galaxies and those determined by conversion from the Saunders et al (1990) ‘warm’ and ‘cool’ 60m luminosity functions, although our estimates appear high for the highest luminosity bins. For starburstwarm galaxies we find = 1.2 0.1, and = 0.60 0.03. For quiescentcool galaxies we find = 1.2 0.1, and = 0.55 0.05. For all other redshift bins we then fix but allow a range in estimating the uncertainty in the sfrd (which is the integral of the star-formation-rate function).
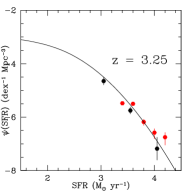
For z = 0.5-3.5 we combine our data with the Gruppioni et al (2013) total infrared luminosity function, using a conversion sfr = (Rowan-Robinson et al 1997), where is in solar units. For some of our redshift bins we had to combine two of Gruppioni et al’s bins to get the equivalent redshift range. We show their z=3-4.2 function compared to our 3-3.5 function, since the most of their redshifts fall in that bin. There is reasonable consistency between these independent estimates of the star-formation-rate function in the range of star-formation rates in common.
For quiescent galaxies at z = 0.5-1.5 we used = 0.55 but allowed a range of 0.05 in estimating the uncertainty in the sfrd. We also fixed at the values determined by Gruppioni et al (2013).
For starburst galaxies in the range z = 0-3 we find a best fit of . We allow a range in of in estimating the uncertainties of other parameters. and were allowed to be free parameters.
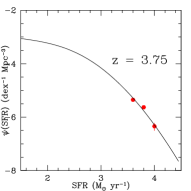
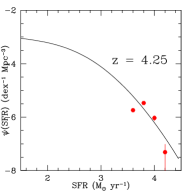
For z 3.5 we have only the estimates of the star-formation-rate function at very high values of the star-formation-rate from our samples and so fix , . We also note that for z = 0-3 the parameter is consistent with being constant, with an average value , so for z 3 we fix at this value. However in estimating the uncertainty in the integrated sfrd in each redshift bin, we allow both and to vary by dex (this is illustrated in Fig 10). Because we have data only at high luminosities and star-formation rates at these redshifts, we have to apply some constraint to the star-formation-rate function parameters, particularly , to avoid abrupt changes in this function. We have also shown results in Fig 11 assuming that varies as , as assumed by Gruppioni et al (2013), open circles in Fig 11. These give slightly lower values of the sfrd. The issue that we are probing only the high-luminosity end of the star-formation-rate function at z3 is common to other studies, e.g. Cucciati et al (2012), Gruppioni et al (2013).
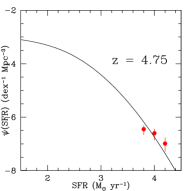
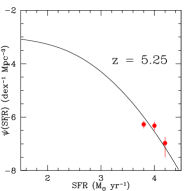
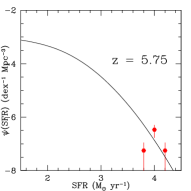
Table 4 summarises the parameters for the star-formation-rate function in each redshift bin, with square brackets denoting prior fixed values. Figures 8, 9 shows a montage of these star-formation-rate functions, with the fitted Saunders forms. There is a tendency for the very highest sfr bins to be higher than the fitted curves for z 3.5 but these are generally based on quite small numbers of sources.
Figure 10L shows the evolution of and with redshift and fits to these with the functional form introduced by Rowan-Robinson (2009) in modelling infrared and submillimetre source-counts:
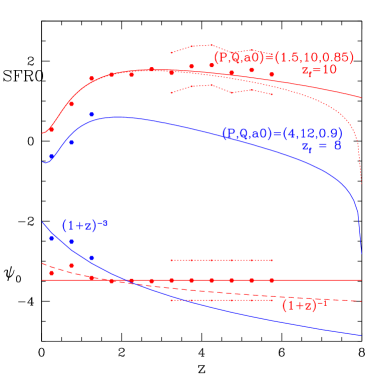
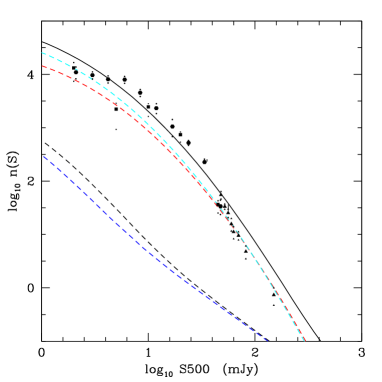
As a check we show in Fig 10R a fit to the 500 m differential source-counts with these assumed evolution rates for the different components. The predicted background intensity at 500 m is 3.3 nW , consistent with direct measurements (2.400.60, Fixsen et al 1998, 2.700.67 Lagache et al 2000) and stacking analysis (2.80+0.93-0.81 Bethermin et al 2012).
5 Evolution of the star-formation rate density
We are now in a position to show the evolution of the star-formation-rate density with redshift for quiescent galaxies, starbursts, and for the combined total (Fig 11). This can be compared with the data compiled by Madau and Dickinson (2014). The uncertainties we have shown fully take into account the effect of varying the parameters of the star-formation-rate function, except that at z 3 we have not allowed variation of the parameters and . To indicate the uncertainties associated with the photometric redshifts we have shown a range of redshift corresponding to the rms uncertainty for the median number of photometric bands in each redshift bin (last line of table 4), taken from Rowan-Robinson et al (2013, Fig 15). Catastrophic photometric redshift outliers are a negligible problem for z 1 (%), and not a big problem for z = 1-2 (few ). Our analysis combining 0.36-4.5m photometric redshift and 250-350 m submillimetre redshift estimates for z 2 galaxies identified 27 catastrophic outliers out of 388 objects (7), and we substituted for for these outliers.
For the 500 m sources unassociated with SWIRE objects, the redshifts, determined only from 250-500 m data, are highly uncertain, with an estimated range of values of (1+z) due to the range of template types seen in the submillimetre ( and a direct estimate from known spectroscopic redshifts of ). Extensive discussions of finding high redshift (z4) galaxies purely from submillimetre photometry have been given by Dowell et al (2014) and Asboth et al (2015). The situation can be improved in the future by submillimetre spectroscopy of these sources. We believe the redshift uncertainties are unlikely to be responsible for the high star-formation-rate density we find at z = 3-6.
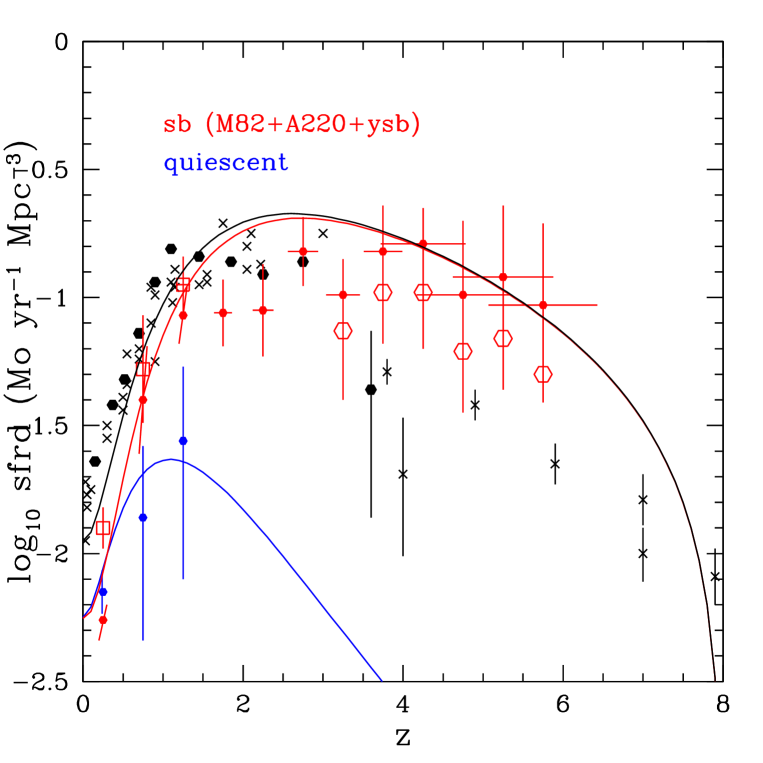
There is reasonable agreement between our results and those of Madau and Dickinson (2014), for z 3.5. Working at 500 m allows us to make a good determination of the sfrd at z = 3.5-4.5, and a more uncertain determination, based on small numbers of galaxies, at z = 4.5-6. Our star-formation-rate density is higher than that of Gruppioni et al (2013) at z=3-4.5, but the latter is based on very few galaxies and is quoted by the authors as essentially a lower limit. Our values are also higher than uv estimates at z = 3.5-6, by a factor 2-3, with the lower value applying if we assume negative density evolution, with varying as . Although the uncertainties in the submillimetre estimates mean that we can not rule out the possibility that the ultraviolet estimates are correct, the higher values of the sfrd that we find could also be attributed to the fact that uv estimates are not able to assess the contribution of embedded star-formation. Note that the uv estimates of Bouwens et al (2012a,b) and Schenker et al (2013) do not include any correction for extinction by dust, though those of Cucciati et al (2012) do.
6 Discussion and conclusions
Our conclusion is that the epoch of high star-formation-rate density, and hence of rapid heavy element formation, stretches from redshift 4 to redshift 1. This is a significantly earlier start to the epoch of high star-formation-rate density than assumed in previous studies. This may pose problems for semi-analytic models for galaxy formation, which tend to set the epoch of intense star-formation at z = 2 to 1. Gruppioni et al (2015) have discussed the consistency of the submillimetre luminosity function evolution with semi-analytic models. Their conclusion that the semi-analytic models underpredict the high star-formation rate seen in starburst galaxies at z 2 is strengthened by the results of the present paper.
McDowell et al (2014) have constructed a sample of z 4 submillimetre galaxies by selecting HerMES sources with S(500)S(350)S250). While only 3 of our Table 3 z 4 sample satisfy S(500)S(350), it is interesting that assuming the submillimetre luminosity function does not evolve from z = 2 to 5 they conclude that that the sfrd from z=4-6 is between 1 and 3 times the uv estimates, depending on which luminosity function they use.
Luminous star-forming galaxies at redshift 5-6 had significant dust opacities in their star-forming regions. If this dust originates in Population 2 stars, this in turn has implications for the epoch when star-formation commenced, as this must be 1 Gyr before z = 6. Michalowski et al (2010) have emphasised the problems posed by some high-redshift submillimetre galaxies for the assumption of AGB dust formation.
Our estimates of the star-formation rate density at z 4 are based entirely on very exceptional objects, with star-formation rates 3,000 . Presumably the lifetime of such exceptional starbursts is significantly shorter than the yrs seen in local starbursts, but they still need to be understood in the context of semi-analytic galaxy formation models. We believe we have efficiently removed lensing objects from our study and that these represent real star-formation rates. However it is possible that some of the 500 m sources not associated with SWIRE galaxies may be lensed and this could reduce our sfrd estimates at high redshift. If the fraction of lensed objects amongst the unassociated sources was the same as for the Herschel sources associated with SWIRE galaxies, i.e. 11, then the star-formation rate density at z4 would need to be reduced by this factor. This would not alter our conclusions.
While our estimate of the star-formation rate density is highly uncertain, especially at z 4.5, it demonstrates the potential of submillimetre selected samples of galaxies for probing the high redshift universe and the need for further work, especially spectroscopy and submillimetre imaging, on these high redshift submillimetre galaxies.
7 Acknowledgements
Herschel is an ESA space observatory with science instruments provided by European-led Principal Investigator consortia and with important participation from NASA. SPIRE has been developed by a consortium of institutes led by Cardiff University (UK) and including Univ. Lethbridge (Canada); NAOC (China); CEA, LAM (France); IFSI, Univ. Padua (Italy); IAC (Spain); Stockholm Observatory (Sweden); Imperial College London, RAL, UCL-MSSL, UKATC, Univ. Sussex (UK); and Caltech, JPL, NHSC, Univ. Colorado (USA). This development has been supported by national funding agencies: CSA (Canada); NAOC (China); CEA, CNES, CNRS (France); ASI (Italy); MCINN (Spain); SNSB (Sweden); STFC, UKSA (UK); and NASA (USA).
We thank an anonymous referee for helpful comments.
References
- (1) Asboth V. et al, 2016, MNRAS (subm)
- (2) Bethermin M. et al, 2012, AA 542, A58
- (3) Bouwens R.J. et al 2012a, ApJ 754, 83
- (4) Bouwens R.J. et al 2012b, ApJL 752. L5
- (5) Brinchman J., Charlot S., White S.D.M., 2004, MNRAS 351, 1151
- (6) Clements D.L. et al, 2010, AA 518, L8
- (7) Combes F. et al, 2012, AA 538, L4
- (8) Cox P. et al, 2011, ApJ 740, 63
- (9) Cucciati O. et al, 2012, AA539, 31
- (10) Daddi E. et al, 2007, ApJ 670, 156
- (11) Daddi E. et al, 2010, ApJ 714, L18
- (12) Dahlen T. et al, 2007, ApJ 654, 172
- (13) Dowell C.D. et al, 2014, ApJ 780, 75
- (14) Efstathiou A., Rowan-Robinson M., Siebenmorgen R., 2000, MNRAS 313, 734
- (15) Efstathiou A., Rowan-Robinson M., 2003, MNRAS 343, 322
- (16) Elbaz D. et al, 2007, AA 468, 33
- (17) Farrah D., Verma A., Oliver S., Rowan-Robinson M., McMahon R., 2002, MNRAS 329, 605
- (18) Franceschini A. et al, 1991, AA Supp 89, 285
- (19) Fixsen D.J., Dwek E., Mather J.C., Bennett C.L., Shafer R.A., 1998, ApJ 508, 123
- (20) Genzel R. et al, 1998, ApJ 498, 579
- (21) Genzel R. et al, 2010, MNRAS 407, 2091
- (22) Glenn S.J. et al, 2010, MNRAS 409, 109
- (23) Griffin M.J. et al, 2010, AA 518, L3
- (24) Gruppioni C. et al, 2013, MNRAS 432, 23
- (25) Gruppioni C. et al, 2015, MNRAS 451, 3419
- (26) Kennicutt R.C. et al, 2010, PASP 123, 1347
- (27) Lagache C., Haffner L.M., Reynolds R.J., Tuffte S.L., 2000, AA 354, 247
- (28) Lilly S.J., Le Fevre O., Hammer F., Crampton D., 1996, ApJL 460, L1
- (29) Lupu R.E. et al, 2012, ApJ 757, 1352
- (30) Madau P. et al, 1996, MNRAS 283, 1388
- (31) Madau P. and Dickinson M., 2014, ARAA 52, 415
- (32) Magnelli B. et al, 2011, AA 528, A35
- (33) Magnelli B. et al, 2013, AA 553, A132
- (34) Marchetti L. et al, 2016, MNRAS 456, 1999
- (35) Michalowski M.J., Watson D., Hjorth J., 2010, ApJ 712,942
- (36) Nguyen H.T. et al, 2010, AA 518, L5
- (37) Noeske K.G. et al, 2007, ApJL 660, L47
- (38) Oliver S.J. et al, 2010, AA 518, L21
- (39) Oliver S.J. et al, 2012, MNRAS 424, 1614
- (40) Patel H., Clements D.L., Vaccari M., Mortlock D.J., Rowan-Robinson M., Perez-Fournon I., Afonso-Luis A., 2013, MNRAS 428, 291
- (41) Pilbratt G. et al, 2010, AA 518, L1
- (42) Reddy N.A. and Steidel C.C., 2009, ApJ 692, 778
- (43) Riechers D.A. et al, 2013, Nature 496, 329
- (44) Rodighiero G. et al, 2011, ApJ 739, 40L
- (45) Rodighiero G. et al, 2014, MNRAS 443, 19
- (46) Rowan-Robinson M., 1995, MNRAS 272, 737
- (47) Rowan-Robinson M. et al, 1997, MNRAS 289, 490
- (48) Rowan-Robinson M., 2003, MNRAS 344, 13
- (49) Rowan-Robinson M. et al, 2008, MNRAS 386, 697
- (50) Rowan-Robinson M. et al, 2010, MNRAS 409, 2
- (51) Rowan-Robinson M. et al, 2013, MNRAS 428, 1958
- (52) Rowan-Robinson M. et al, 2014, MNRAS 445, 3848
- (53) Rowan-Robinson M., Wang L., 2010, MNRAS 406, 720
- (54) Sanders D.B., Mazzerella J.M., Kim D.C., Surace J.A., Soifer B.T., 2003,AJ 126, 1607
- (55) Saunders W. et al, 1990, MNRAS 242, 318
- (56) Schenker M.A. et al, 2013, ApJ 768, 196
- (57) Schiminovich D. et al, 2005, ApJL 619, L47
- (58) Takeuchi T.T., Yoshikawa K, Ishii T.T., 2003, ApJL 749, L38
- (59) Vaccari M. et al 2010, AA 518, L20
- (60) Wang L., Rowan-Robinson M., 2010, MNRAS 401, 35
- (61) Wang L. et al, 2014a, MNRAS 444, 2870
- (62) Wang L., Rowan-Robinson M., Norberg P., Heinis S., Han J., 2014b, MNRAS 442, 2739
- (63) Wyder T.K. et al, 2005, ApJL 619, L15