Nonlinear pulsations of stars with initial mass
on the asymptotic giant branch
Yu. A. Fadeyev***E–mail: fadeyev@inasan.ru
Institute of Astronomy, Russian Academy of Sciences, Pyatnitskaya ul. 48, Moscow, 119017 Russia
Received March 29, 2016
Abstract — Pulsation period changes in Mira type variables are investigated using the stellar evolution and nonlinear stellar pulsation calculations. We considered the evolutionary sequence of stellar models with initial mass and population I composition. Pulsations of stars in the early stage of the asymptotic giant branch are shown to be due to instability of the fundamental mode. In the later stage of evolution when the helium shell source becomes thermally unstable the stellar oscillations occur in either the fundamental mode (for the stellar luminosuty ) or the first overtone (). Excitation of pulsations is due to the –mechanism in the hydrogen ionization zone. Stars with intermediate luminosities were found to be stable against radial oscillations. The pulsation period was determined as a function of evolutionary time and period change rates were evaluated for the first ten helium flashes. The period change rate becomes the largest in absolute value () between the helium flash and the maximum of the stellar luminosity. Period changes with rate take place during yr, that is nearly one hundredth of the interval between helium flashes.
Keywords: stars: variable and peculiar
introduction
Cet type variables (or Miras) belong to numerous pulsating variables with visual amplitudes greater than two magnitudes and oscillation periods . The long–term observations spanning one or several decades reveal that pulsation periods of some Miras undergo secular variation (either decrease or increase). One of the first reports on detection of secular period variation in the variables Cet and Cyg was made by Eddington and Plakidis (1929). Recent estimates of the fraction of Miras with unambiguously detected period changes are of a few percent of their total number (Templeton et al., 2005; Lebzelter and Andronache, 2011), whereas the rate of period change is as high as a few tenths of the percent per year. For example, the pulsation period of T UMi ( day) decreases with rate of and the period of LX Cyg ( day) increases with rate of (Templeton et al., 2005). It should be noted that detection of secular period change in Miras is hindered by small (i.e. with amplitude as high as 10%) random period changes of unknown nature (Percy and Colivas, 1999; Koen and Lombard, 2004; Uttenthaler et al., 2011).
Miras are assumed to be the stars of the asymptotic giant branch (AGB) with nuclear energy sources in the hydrogen–burning and helium–burning shells surrounding a carbon–oxygen core (Wood and Zarro, 1981; Iben and Renzini, 1983; Boothroyd and Sackmann, 1988; Vassiliadis and Wood, 1993). Shell helium burning is characterized by thermal instability, that is by short–term enhancements of nuclear energy release (Schwarzschild and Härm, 1965; Weigert, 1966). The thermal flash amplitude is so large that the energy release in the helium burning shell is by several orders of magnitude higher than the surface luminosity. The short–lived intershell convection zone created due to the large energy flux transports the products of helium burning upwards. After a shorth time the innner boundary of the outer convection zone descends in these layers and dredges up the material enriched in heavier elements to the surface of the red supergiant. Detection of unstable technetium isotopes 97Tc and 98Tc (Merrill, 1952; Little–Marenin and Little, 1979; Lebzelter and Hron, 1999) with half–life time yr corroborates that Miras are thermally pulsing AGB stars.
Helium flashes are accompanied by changes in stellar radius and luminosity on the time scale of yr and are thought to be responsible for secular period variation in Miras. In particular, the duration of the surface luminosity changes due to the helium flash is from one to a few hundredths of the time interval between two thermal pulses and is comparable with fraction of Miras with secular period variation. Moreover, Wood and Zarro (1981) showed that the period change rates in Mira type variables R Hya, R Aql and W Dra agree with lumiunosity variations predicted by evolutionary calculations. This conclusion, however, implies that these stars are the first overtone pulsators and, as noted the authors of the work, should be corroborated by the methods of the stellar pulsation theory.
The pulsation mode of Miras remains disputable. For example, Wood and Sebo (1996), Weiner (2004), Perrin et al. (2004) argued in favor of the fundamental mode, whereas Tuchman (1991), Tuthill et al. (1994), Haniff et al. (1995) showed that Miras are the first overtone pulsators. It should be noted that these conclusions are based on measurements of angular diameters of a few stars with known parallaxes. Results of photometric observations of many long period variables in the Large and Small Magellanic Clouds (Ita et al. 2004) and in the dwarf galaxies NGC 147 and NGC 185 (Lorenz et al., 2011) allow us to conclude that Miras pulsate in the both fundamental mode and first overtone.
Below we discuss the results of hydrodynamic computations of radial pulsations of population I stars with initial mass on the early AGB stage as well as on the advanced stage of thermal instability of the helium shell source. The goal of the study is to investigate the evolutionary changes of pulsational properties of Miras. In particular, we specially pay attention to the mode of radial oscillations and to changes in the pulsation period. Comparison of theoretical period change rates with observational data is of importance to corroborate the evolutionary status of Miras as AGB stars.
calculations of stellar evolution
To solve the equations of radiation hydrodynamics for self–excited stellar pulsations we need to impose the initial conditions corresponding to the hydrostatic equilibrium. In the present study the initial conditions were represented as models of the evolutionary sequence calculated with the MESA code version 7624 (Paxton et al., 2011; 2013; 2015). The initial chemical composition was assumed to be that of population I stars with fractional mass abundances of hydrogen and elements heavier than helium and , respectively. The reaction network included isotopes from to .
Convection was treated through the classical mixing length theory (Böhm–Vitense, 1958) with a mixing length to pressure scale height ratio . Convective overshooting was taken into account using the prescription of Herwig (2000) and the coefficient of convective diffusion was assumed to reduce exponentially as a function of geometric distance from the edge of the convective zone:
| (1) |
Here is the local pressure scale height, is the coefficient of convective diffusion within the convective zone in the layer located at from the boundary of convective stability. Relation (1) was used for smoothing of the convective diffusion coefficient at boundaries of all convective zones and the dimensionless parameter was .
The mass loss rate in units of was evaluated according to Blöcker (1995):
| (2) |
where
| (3) |
is the Reimers (1975) formula. The adopted free parameters are and .
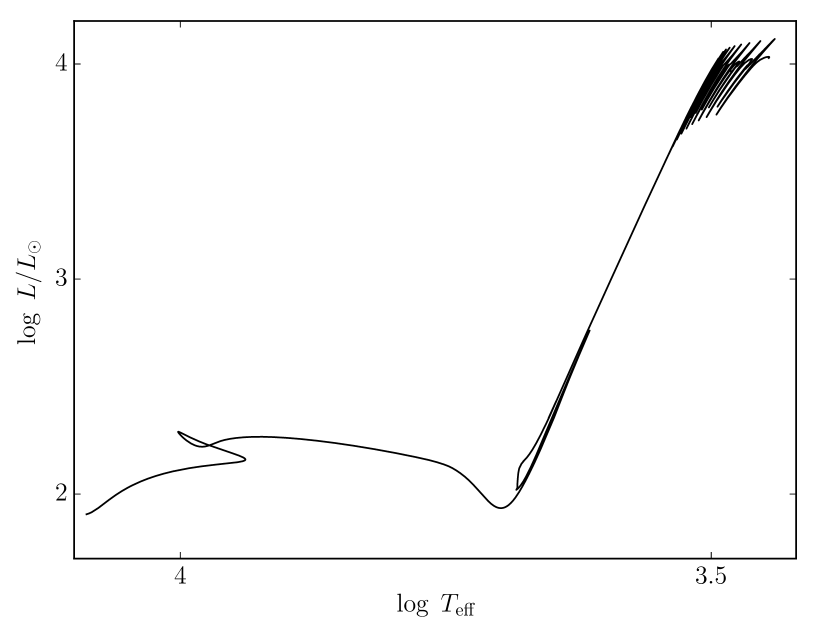
Fig. 1 displays the evolutionary track of the star with initial mass on the Hertzsprung–Russel diagram (HRD). The initial point of the track corresponds to the homogeneous chemical composition along the radius. At the final point of the track the age, mass of the star and mass of the carbon–oxygen core are yr, and , respectively. Abrupt changes of the luminosity in the upper part of the track within are due to thermal instability of helium shell burning. The evolutionary computations of the present study comprise the first ten helium flashes.
The temporal dependence of the stellar luminosity is shown in Fig. 2a where for the sake of convenience the evolutionary time is set to zero at the first helium flash luminosity maximum. As the star evolves the time interval between helium flashes gradually increases from yr to yr. Results of our evolutionary computations agree with those by Herwig (2000) notwithstanding the fact that during the last decade and a half the data on equation of state, opacity and thermonuclear reaction rates underwent substantial changes.
Thermal flashes in the helium burning shell and convective dredge up lead to enrichment of outer stellar layers in helium, carbon and oxygen. This is illustrated in Fig. 2b where the carbon to oxygen surface abundance ratio is shown as a function of .
The initial conditions for hydrodynamic computations of nonlinear stellar pulsations were obtained from interpolation of the radius , luminosity , total pressure and temperature represented as a function of mass coordinate , where is the gas density. To diminish interpolation errors the evolutionary computations were done with the number of mass zones , so that the interpolation region spanned outermost zones of the evolutinary model. The inner boundary of the hydrodynamical model was set in the layers with radius , where is the radius of the outer boundary of the evolutionary model. All hydrodynamical models were computed with the number of Lagrangian mass zones . The mass intervals increase geometrically inwards. The inner boundary of the hydrodynamical model locates near the outer boundary of the carbon–oxygen core where the temperature and pressure gradients abruptly grow inwards. To diminish approximation errors of the difference equations in this region of the hydrodynamical model we used the mesh with 100 innermost equally spaced mass intervals.
The envelope of the pulsating star was assumed to be chemically homogeneous and calculation of thermodynamic quantities in numerical solution of the equations of hydrodynamics was carried out as bicubic interpolation of tabular data with respect to and . The tables of thermodynamic quantities were calculated for each hydrodynamical model for abundances of the outer layers of the evolutionary model. The equation of state tables were calculated with the library of programs FreeEOS (Irwin, 2012). Thermodynamic quantities calculated in such a way were found to agree with those obtained from MESA computations.
hydrodynamical models
In the present study the equations of radiation hydrodynamics for nonlinear stellar pulsations are solved together with transport equations for time–dependent convection in spherically–symmetric geometry (Kuhfuß, 1986). The system of differential equations and the adopted parameters of the convection model are given in our previous paper(Fadeyev, 2015). The solution of the equations of hydrodynamics is represented by physical quantities as a function of mass coordinate and time . Time corresponds to the initial state of hydrostatic equilibrium.
As in the studies of nonlinear pulsations of massive red supergiants (Fadeyev, 2012; 2013) the mean pulsation period was evaluated by a discrete Fourier transform of the kinetic energy of pulsational motions of the stellar enevelope on the time interval spanning several hundred pulsation cycles. The instability growth rate was determined from maximum values of the kinetic energy on the initial integration interval where changes linearly with time . An inverse of the growth rate is the number of pulsation cycles corresponding to either increase or decrease of the maximum kinetic energy by a factor of .
Fig. 3 shows the plot of evolutionary change of the stellar luminosity in vicinity of the first helium flash. On the same figure we give the mean values of the luminosity of hydrodynamical models. For pulsationally unstable () and pulsationally stable () models they are shown by filled and open circles, respectively.
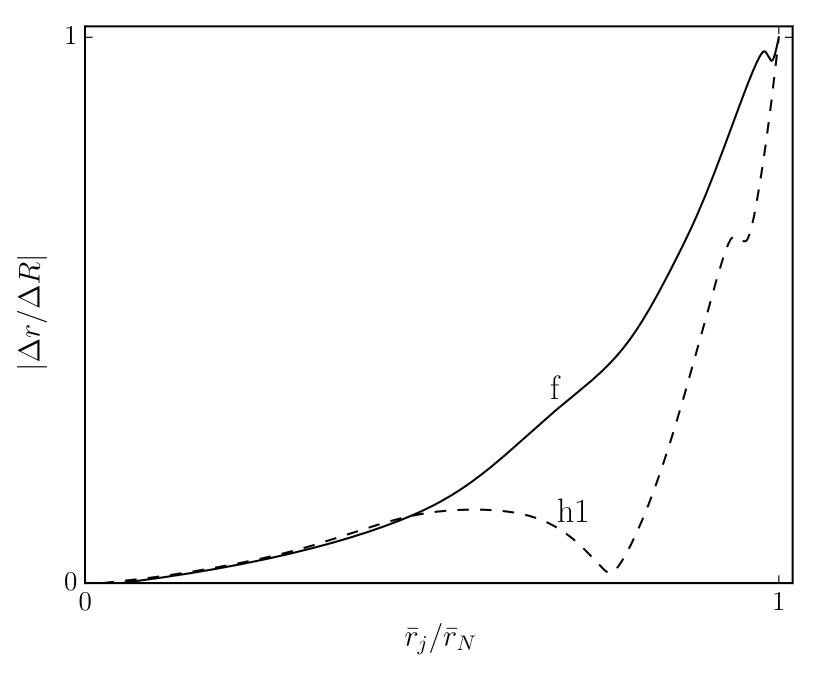
The most striking feature of the plots displayed in Fig. 3 is stability against radial pulsations of stars with luminosity and pulsational instability at luminosities beyond this interval. The discrete Fourier transform of radii of the hydrodynamical models allows us to conclude that stars with luminosity pulsate in the fundamental mode whereas stars with are the first overtone oscillators. The difference in pulsation modes is illustrated in Fig. 4 where the radial dependences of the normalized power spectral density of the radial displacement are shown for two models indicated in Fig. 3 as f (fundamental mode) and h1 (first overtone). The independent variable of the plot in Fig. 4 is the ratio of the mean radius of the –th mass zone to the mean radius of the outer boundary of the hydrodynamical model.
Pulsations in the fundamental mode arise during the early AGB stage as well as on the stage of the thermal instability of the helium shell source. The upper luminosity boundary for pulsations in the fundamental mode decreases with evolutionary time from near the first helium flash to near the sixth helium flash. After the seveth helium flash the stellar luminosity exceeds the upper luminosity limit for the fundamental mode and further stellar evolution is accompanied by oscillations in the first overtone or by pulsational stability.
In the hydrodynamical model indicated in Fig. 3 as h1 the mean values of the radius and temperature at the node of the first overtone are and K, respectively. The region of excitation of pulsational instability in the first overtone (i.e. the layers with the mechanical work per closed cycle , where is the specific volume) locates in layers with radii and temperatures K. Therefore, the first overtone oscillations are driven in the hydrogen ionization zone. Fundamental mode pulsations seem to be driven in the both hydrogen and first helium ionization zone since the condition is fulfilled in layers with temperature K.
The radius of the model h1 pulsating in the first overtone with period of day is almost twice the radius of the model f pulsating in the fundamental mode ( dat). Nevertheless, the temporal dependences of the bolometric light and the velocity of the outer boundary do not show significant differences in the oscillation amplitude and the shape of the curve (Fig. 5). At the same time the hydrodynamical models of fundamental mode and first overtone pulsators reveal significant differences on the period–luminosity and period–radius diagrams (Fig. 6). Periods of fundamental mode pulsations are day and for first-overtone pulsations day.
For the fundamental mode pulsators the period–luminosity and period–radius relations can be approximated as
| (4) | |||
| (5) |
and for first–overtone pulsators
| (6) | |||
| (7) |
where the pulsation period is expressed in days.
pulsation period change
Fig. 7a shows the temporal dependence of the stellar luminosity for the evolutionary time interval spanning three (from seventh to ninth) helium flashes. As in Fig. 3 the mean values of the luminosity of hydrodynamical models are shown for both positive and negative growth rates. In contrast to the first helium flash all unstable models are the first overtone pulsators.
Fig. 7b shows for the same evolutionary time interval the plot of the pulsation period with gaps for . Time intervals between thermal flashes are and yr but the most significant changes of the period occur within shorter time interval ( yr) in vicinity of the maximum light.
The rate of period change was calculated using the numerical didderentiation. To obtain typical estimates of we choosed the eighth helium flash and calculated nearly thirty hydrodynamical models. Results of these computations are illustarted in Fig. 8 where temporal dependences of the pulsation period and the rate of period change are shown for the evolutionary time interval yr. It is seen that the rate of period change is greater in absolute value than 0.1% within the evolutionary time interval yr, that is during one hundredth of the interval between helium flashes. The period change rate becomes the largest in absolute value () during the abrupt stellar radius decrease before the maximum of stellar luminosity but so great secular period variation continues no longer than a hundred years.
conclusion
The results of computations presented above allow us to conclude that radial pulsations of long period variables with masses arise in both the fundamental mode and the first overtone. An unexpected conclusion is that the models demonstrated existence of the region of pulsational stability separating stellar oscillations in different modes. Therefore, together with secular changes of the pulsation period one might observe secular changes of the amplitude of light curves. The change of the pulsation amplitude should be a more rare phenomenon since it occurs on a shorter time scale. Nevertheless, secular amplitude decrease observed in Mira type variables R Cen (Hawkins et al., 2001) and T UMi (Szatmáry et al., 2003) seems to be such a case.
Theoretically calculated period change rates obtained in the present study agree with those observed in Miras. However one shoul bear in mind that results of our computations comprise the small part of AGB stars. Therefore it is of importance to continue the consistent evolutionary and stellar pulsation computations for Miras with various initial masses for longer evolutionary tracks.
references
-
1.
T. Blöcker, Astron. Astrophys. 297, 727 (1995).
-
2.
E. Böhm–Vitense, Zeitschrift für Astrophys. 46, 108 (1958).
-
3.
A.I. Boothroyd and I.–J. Sackmann, Astrophys. J. 328, 632 (1988).
-
4.
A.S. Eddington and S. Plakidis, MNRAS 90, 65 (1929).
-
5.
Yu.A. Fadeyev, Pis’ma Astron. Zh. 38, 295 (2012) [Astron. Lett. 38, 260 (2012)].
-
6.
Yu.A. Fadeyev, Pis’ma Astron. Zh. 39, 342 (2013) [Astron.Lett. 39, 306 (2013)].
-
7.
Yu.A. Fadeyev, MNRAS 449, 1011 (2015).
-
8.
C.A. Haniff, M. Scholz, and P.G. Tuthill, MNRAS 276, 640 (1995).
-
9.
G. Hawkins, J.A. Mattei, and G. Foster, PASP 113, 501 (2001).
-
10.
F. Herwig, Astron. Astrophys. 360, 952 (2000).
-
11.
I. Iben and A. Renzini, Annual Rev. Astron. Astrophys. 21, 271 (1983).
-
12.
A.W. Irwin, Astrophysics Source Code Library, record ascl:1211.002 (2012).
-
13.
Y. Ita, T. Tanabé, N. Matsunaga, et al., MNRAS 347, 720 (2004).
-
14.
C. Koen and F. Lombard, MNRAS 353, 98 (2004).
-
15.
R. Kuhfuß, Astron. Astrophys. 160, 116 (1986).
-
16.
T. Lebzelter and S. Andronache, IBVS 5981, 1 (2011).
-
17.
T. Lebzelter and J. Hron, Astron. Astrophys. 351, 533 (1999).
-
18.
I.R. Little–Marenin and S.J. Little, Astron.J. 84, 1374 (1979).
-
19.
D. Lorenz, T. Lebzelter, W. Nowotny, et al., Astron. Astrophys. 532, A78 (2011).
-
20.
P.W. Merrill, Astrophys. J. 116, 21 (1952).
-
21.
B. Paxton, L. Bildsten, A. Dotter, et al., Astropys. J. Suppl. Ser. 192, 3 (2011).
-
22.
B. Paxton, M. Cantiello, P. Arras, et al., Astropys. J. Suppl. Ser. 208, 4 (2013).
-
23.
B. Paxton, P. Marchant, J. Schwab, et al., Astropys. J. Suppl. Ser. 220, 15 (2015).
-
24.
J.R. Percy and T. Colivas, Publ. Astron. Soc. Pacific 111, 94 (1999).
-
25.
G. Perrin, S.T. Ridgway, B. Mennesson, et al., Astron. Astrophys. 426, 279 (2004).
-
26.
D. Reimers, Problems in stellar atmospheres and envelopes (Ed. B. Baschek, W.H. Kegel, and G. Traving, New York: Springer-Verlag, 1975), p. 229.
-
27.
M. Schwarzschild and R. Härm, Astrophys. J. 142, 855 (1965).
-
28.
K. Szatmáry, L.L. Kiss, and Zs. Bebesi, Astron. Astrophys. 398, 277 (2003).
-
29.
M.R. Templeton, J.A. Mattei, and L.A. Willson, Astron. J. 130, 776 (2005).
-
30.
Y. Tuchman, Astrophys. J. 383, 779 (1991).
-
31.
P.G. Tuthill, C.A. Haniff, J.E. Baldwin, and M.W. Feast, MNRAS 266, 745 (1994).
-
32.
S. Uttenthaler, K. van Stiphout, K. Voet, et al., Astron. Astrophys. 531, A88 (2011).
-
33.
E. Vassiliadis and P.R. Wood, Astrophys. J. 413, 641 (1993).
-
34.
A. Weigert, Zeitschrift für Astrophys. 64, 395 (1966).
-
35.
J. Weiner, Astrophys. J. 611, L37 (2004).
-
36.
P.R. Wood and K.M. Sebo, MNRAS 282, 958 (1996).
-
37.
P.R. Wood and D.M. Zarro, Astrophys. J. 247, 247 (1981).
figure captions
-
Fig. 1.
The evolutionary track of the star from the zero age main sequence to the thermally pulsing AGB.
-
Fig. 2.
Temporal dependences of the stellar luminosity (a) and the ratio of surface mass abundances of carbon and oxygen (b) during the AGB stage.
-
Fig. 3.
The stellar luminosity as a function of evolutionary time in vicinity of the first thermal flash in the helium burning shell. Pulsationally unstable models () are shown in filled cicles and models with decaying oscillations () are shown in open cicrcles. The symbols f and h1 indicate the models pulsating in the fundamental mode and the first overtone, respectively.
-
Fig. 4.
The normalized power spectral density of the radial displacement at the frequency of the principal pulsation mode as a function of the mean radial distance. The plotted radial dependences are calculated for models indicated in Fig. 3 as f (pulsations in the fundamental mode) and h1 (pulsations in the first overtone).
-
Fig. 5.
Temporal dependeces of the bolometric light (a) and the gas flow velocity at the outer boundary (b) for models of stars pulsating in the fundamental mode (f) and the first overtone (h1).
- Fig. 6.
-
Fig. 7.
The stellar luminosity (a) and the pulsation period (b) as a function of the evolutionary time . The number of the thermal flash is indicated at the luminosity maximum. The filled and open circles show the mean luminosities of hydrodynamical models that are unstable () and stable () against radial oscillations.
-
Fig. 8.
Temporal dependences of the pulsation period (a) and the period change rate (b) in vicinity of the luminosity maximum of the eight thermal flash.