=3 10000 10000 150
Aberration-free volumetric high-speed imaging of in vivo retina
1Thorlabs GmbH,
Maria-Goeppert-Straße 9, 23562 Lübeck, Germany
2Institute of Biomedical Optics Lübeck,
Peter-Monnik-Weg 4, 23562 Lübeck, Germany
3Medical Laser Center Lübeck GmbH,
Peter-Monnik-Weg 4, 23562 Lübeck, Germany
4Airway Research Center North (ARCN),
Member of the German Center for Lung Research (DZL), Germany
*dhillmann@thorlabs.com
Research and medicine rely on non-invasive optical techniques to image living tissue with high resolution in space and time. But so far a single data acquisition could not provide entirely diffraction-limited tomographic volumes of rapidly moving or changing targets, which additionally becomes increasingly difficult in the presence of aberrations, e.g., when imaging retina in vivo. We show, that a simple interferometric setup based on parallelized optical coherence tomography acquires volumetric data with 10 billion voxels per second, exceeding previous imaging speeds by an order of magnitude. This allows us to computationally obtain and correct defocus and aberrations resulting in entirely diffraction-limited volumes. As demonstration, we imaged living human retina with clearly visible nerve fiber layer, small capillary networks, and photoreceptor cells, but the technique is also applicable to obtain phase-sensitive volumes of other scattering structures at unprecedented acquisition speeds.
Fourier-domain optical coherence tomography (FD-OCT) images living tissue with high resolution [1, 2, 3]. Its most important applications are currently in ophthalmology, where it provides three-dimensional data of the human retina that are not attainable with any other imaging method. However, especially at high numerical apertures (NA), aberrations significantly reduce its resolution and the focal range restricts the volume depth that is obtained in a single measurement. Although computational methods have been shown to remove these limitations [4, 5, 6, 7, 8, 9], they have hardly been applicable in vivo, as these methods face two major challenges: First, volumes have to be acquired coherently, i.e., phases must not be influenced by sample motion, but must only depend on tissue morphology. And second, the aberrations need to be determined reliably.
Essentially, FD-OCT acquires coherent volumes. It interferometrically detects backscattered infrared light at multiple wavelengths and computes its depth-resolved amplitude and phase at one lateral point (A-scan). To obtain a three-dimensional volume it usually acquires A-scans for different lateral positions by confocal scanning. If all A-scans are measured without sample motion, the volume is phase-stable and coherent, and the advantage of such data was previously shown: degradation of the lateral resolution by a limited focal depth was eliminated by interferometric synthetic aperture microscopy (ISAM) [6, 9], and later, Adie et al. [7, 8] corrected aberrations.
However, a moving sample destroys the phase-stability and makes the acquired OCT dataset virtually not coherent, which held back in vivo applications of ISAM [10, 11]. Sample tracking and motion correction improved the phase-stability [12], and even the photoreceptor layer of living human retina was imaged [13]. But to achieve sufficient phase-stability, imaging had to be limited to a single en face layer of the retina, and data with little tissue motion had to be selected. No three-dimensional tomography was possible.
To acquire a phase-stable three-dimensional volume of targets such as the human retina in vivo and to numerically correct defocus and aberrations, a further increase in imaging speed is required. In principle, full-field swept-source OCT (FF-SS-OCT) [14] can acquire data several orders of magnitude faster than confocal OCT as it removes the lateral scanning by imaging all positions onto an area camera and it allows higher radiant flux on the sample without damaging the tissue. But so far, it showed poor image quality and the available cameras limited its imaging speed and field of view [15].
Here we show, that a remarkably simple FF-SS-OCT system obtains truly coherent three-dimensional tomograms of the living human retina with high image quality. Its acquisition speed is lateral points (A-scans) per second, which exceeds current clinical systems by several orders of magnitude and is about one order of magnitude faster than any other OCT system in research [16, 17]. Its fast and phase-stable acquisition allows a computational optimization of image quality, similar to [18] in synthetic aperture radar, which removes defocus and aberrations and pinpoints all light to its three-dimensional scattering location in a volume spanning multiple Rayleigh lengths in depth. No additional hardware tracks motion, or determines and corrects aberrations. To show the validity of this approach, we imaged the living human retina at maximum pupil diameter (7 mm), and obtained images of the nerve fiber layer, small vascular structures, and the photoreceptor cells with nearly diffraction-limited resolution. The presented technique visualizes living and moving tissue, such as the retina, with higher lateral and temporal resolution than previously possible. In addition the detected phase of the scattered light can provide valuable data on small subwavelength changes in axial direction. Thereby the technique can visualize dynamic in vivo processes that were previously inaccessible.
1 Data acquisition and processing
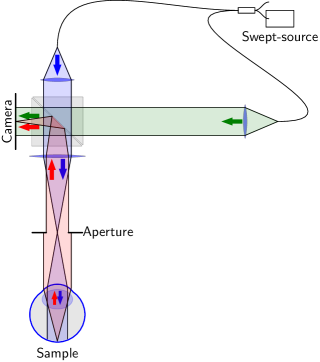
To acquire an entire three-dimensional volume coherently by FF-SS-OCT, interference images of light backscattered by the retina and reference light were acquired at multiple wavelengths. To this end, the interference pattern was generated in a simple Mach-Zehnder type setup (see Methods) as shown in Fig. 1. For a single volume, a high-speed camera (Photron FASTCAM SA-Z) recorded of these interferograms during the wavelength sweep of a tunable laser (Superlum Broadsweeper BS-840-1), covering and centered at . Images were acquired with pixels at frames per second, which results in an acquisition rate of 117 volumes per second and corresponds to A-scan rate and voxel rate.
We first reconstructed the acquired data using standard OCT processing (see Methods). Most importantly, a Fourier transform of the acquired data along the wavenumber axis reconstructed the sample volume. Afterwards computational corrections of axial motion maximized image quality; this was inevitable, even at these acquisition rates. The resulting image volumes were coherent and contained the correct phases, but still suffered from reduced quality due to a limited focal depth and wavefront aberrations.
2 Principle of aberrations and their correction
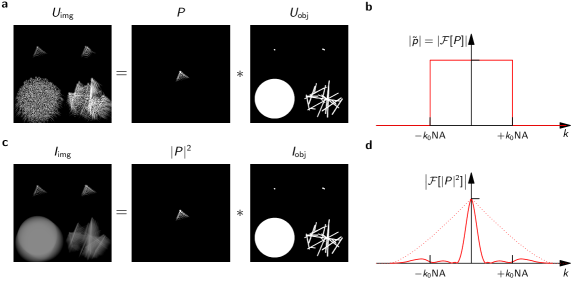
Image formation of a single depth layer in a coherent OCT volume is described by coherent imaging theory (see e.g. [19]). It is assumed that the detected complex wave field in the image plane is a convolution of the wave field in the object plane and the aberrated complex point spread function (PSF)
| (1) |
where is the lateral position in the respective plane when neglecting magnification. In general a limited aperture or aberrations will broaden or distort the PSF. The convolution with this PSF not only degrades the resolution of , but also causes artificial structures by interference of the aberrated image points, which eventually introduces speckle noise if the object structures cannot be resolved (Fig. 2a).
The effect of aberrations on coherent imaging systems is even better visible in the frequency domain. If the phase of is recorded correctly, the convolution theorem can be applied to the coherent imaging equation (1). It then translates to
| (2) |
with being the Fourier conjugate variable of , indicating the respective Fourier transforms of , and being the coherent amplitude transfer function of the imaging system, i.e., the Fourier transform of . Within the aperture the coherent amplitude transfer function only has a phase component,
| (3) |
with being the (center) wavenumber of the light and being a suitable phase function; outside the aperture, the amplitude transfer function is as no light is transmitted (Fig. 2b), and hence, the multiplication with in equation (2) effectively low-pass filters the image . Aberrations of the imaging system including defocus will only change the phase of , and consequently its effect on the image is completely reversed by multiplication of with the conjugate complex of , which corresponds to a deconvolution of equation (1). Since the signal energy at all transmitted spatial frequencies is not attenuated, i.e., the absolute value of is not decreased within the aperture, the reconstruction is lossless, even in the presence of noise. However, to achieve this needs to be known.
The corresponding incoherent process illustrates the difference to a deconvolution in standard image processing. With an incoherent light source, only the convolution of the scattering intensities with the squared absolute value of the PSF is detected in the image ,
During incoherent imaging, defocus and aberrations only cause a loss of contrast for small structures (Fig. 2c), no additional interference and no speckle noise occur. However, the optical transfer function, i.e., the Fourier transform of , is in general complex, and may contain small or even zero values (Fig. 2d). Hence the effect of aberrations on image quality cannot be inverted without loosing information or increasing noise. In this context, it is remarkably that a simple multiplication with the complex conjugate of inverts the coherent process, despite of speckle noise.
The theory of coherent imaging also applies to the signal formation in FD-OCT. Here, is a function of the spectral wavenumber , and the Fourier conjugate to is the depth. Shape and width of are given by the spectrum of the light source, which also determines the axial PSF and thus the resolution. Similar to coherent aberrations, an additional phase term is introduced if reference and sample arm have a group velocity dispersion mismatch or, which is relevant for FF-SS-OCT, if the sample moves axially [20]. As for aberrations, this is corrected losslessly by multiplication of the spectra with the conjugated phase term, if it is known.
3 Aberration detection
To computationally correct aberrations in coherent imaging, it is crucial to determine the aberration-related phase function first and various approaches have been developed to determine it. One approach uses single points in the image data as guide stars [21, 8], which is the numerical equivalent to a direct aberration measurement with a wavefront sensor. Although photoreceptors can be used as guide stars in not too severely aberrated retinal imaging [13], a guide star is usually not available in other retinal layers or other tissue. A second approach cross-correlates low-resolution reconstructions of the aberrated image from different sub-apertures to estimate the phase front. It worked fairly well in digital holography [22], in FF-SS-OCT [23], and as a rough first estimation for in vivo photoreceptor imaging [13], and also to correct dispersion and axial motion in FF-SS-OCT [20]. However, these low-resolution images of scattering structures show usually independent speckle patterns, which carry no information on the aberrations and which limit the precision of the phase front determination. Additionally, the uncertainty relation couples spatial resolution and accuracy of the resulting ; increasing resolution decreases accuracy of the phase , and vice versa.
Here, we iteratively optimized the image quality to obtain the correcting phase, which provided very good results. Although it is computationally expensive, this idea was already applied to Digital Holography [24], synthetic aperture radar (SAR, [25, 18]), and also scanning OCT to correct aberrations [7] and dispersion mismatch [26]. In this approach, a wavefront is assumed, and equation (2) is inverted by multiplying with . After an inverse Fourier transform a corrected image is obtained, which can be evaluated for image quality. The task is to find the that gives the best quality and thus corrects aberrations.
For this approach, a metric describing image-sharpness, a parameterization of the phase error , and finally, an optimization algorithm are required, and their choice influences quality of the results and performance of the approach. The metric needs to be minimal (or maximal) for the aberration-free and focused image, even in the presence of speckle noise. A parametrization of the phase front keeps the dimensionality of the problem low and thus prevents over-fitting; still, it needs to describe all relevant aberrations. Finally, a robust optimization technique must find the global minimum of the metric without getting stuck in local minima. As the number of free parameters increases with higher aberration order, the global optimization becomes more difficult and increasingly time consuming; the algorithm performance is therefore crucial.
A variety of metrics and image-sharpness criteria have been used in previous research for coherent and incoherent imaging [27, 28, 25, 18, 5]. For a normalized complex image given by at pixel , a special class of metrics [5] only depends on the sum of transformed image intensities (see also Methods):
| (4) |
Here, we used the Shannon entropy given by [25], although we observed similar performance when choosing with a [27]. When these metrics were minimal, we observed good image quality, despite of speckle dominated data.
As parametrization, the phase function was expressed in Zernike polynomials. These are established in the description of optical aberrations including defocus, and their use gave good results and performance during optimization. Zernike polynomials up to \nth8 radial degree were used, excluding piston, tip, and tilt, which results in degrees of freedom.
The optimization has to find the Zernike coefficients describing that give the absolute minimum of the metric for the acquired data. To achieve this, we used a two-step approach. At first a simplex-downhill algorithm was applied [29]. This algorithm follows the global trend of the metric function and is thereby insensitive to local minima. Once being close to the global minimum, a gradient-based algorithm was used, which significantly boosted performance. Here, we used the conjugate gradient method [30]. A useful property of metrics described by equation (4) is that their complete gradient with respect to the Zernike coefficients can be computed efficiently; it requires only a single additional Fourier transform (see [18, 5] and Methods).
If aberrations were too strong and the degrees of freedom too large the optimal phase front could not be determined in this way. Instead the optimization was first performed with a computationally reduced numerical aperture, which gave robust results with reduced lateral resolution. Afterwards, the optimization was repeated several times while increasing the NA. This way even large aberrations including all 42 degrees of freedom could be corrected.
In general the assumption of a laterally invariant PSF is not valid, and equation (1) only holds for small volumes. The entire data were therefore divided into sufficiently small regions (see Methods), which were then corrected independently. By stitching these, aberration-free data for the complete recorded volume were obtained.
4 Results
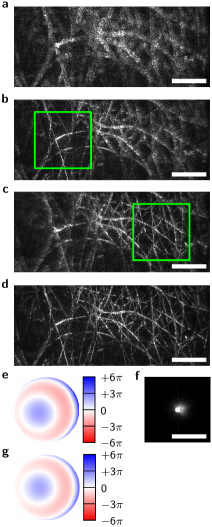
To demonstrate the accuracy of the algorithms, we first imaged lens cleaning tissue with a simple achromatic lens at an NA of 0.15, which introduced significant spherical aberrations (Fig. 3). Before correction en face images were severely blurred (Fig. 3a), but the optimization restored the fiber structures of the lens tissue in a certain field of view. Since the aberrations were not translation invariant, different sub-images were corrected independently (Fig. 3b and c), and by stitching these the entire image field was obtained (Fig. 3d).
Wavefront and PSF resulting from the aberration determination of Fig. 3c are shown in Figs. 3e and f, respectively. The obtained wavefront was compared to a raytracing simulation (Zemax, Fig. 3g) with almost identical results. A slight lateral misalignment of the imaging optics explains remaining differences.
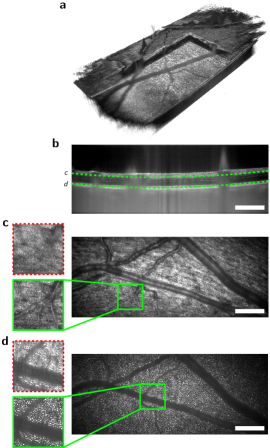
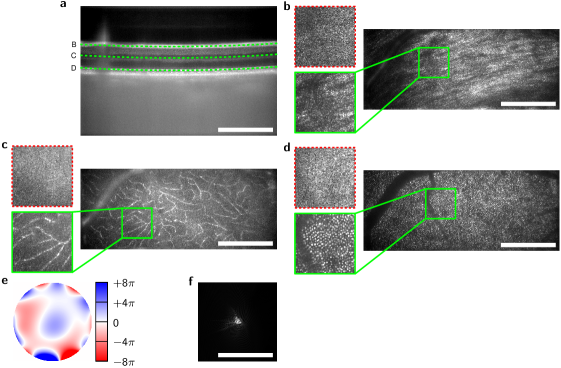
We then imaged the retina of a young healthy volunteer in vivo. Two datasets were acquired, first at periphery and NA 0.1 (Fig. 4), and later at and 0.2 NA corresponding to diameter of the maximally dilated pupil (Fig. 5). Without the aberration correction the volumes are laterally blurred in all layers of the retina with image degradation being significantly stronger in the high NA data, where hardly any lateral structures were visible at first. Several of the layers were aberration corrected, including the nerve fiber layer (NFL, Figs. 4c, 5b), small capillaries (Fig. 5c), and the photoreceptor layer (Figs. 4d, 5d). The optimization algorithm improved image quality nearly to diffraction limit, showing otherwise invisible structures. In particular, the structure of the nerve fiber layer and small capillaries became visible and single photoreceptor cells were identified.
However, the sectional images (B-scans) in Figs. 4b and 5a also show a disadvantage of the FF-SS-OCT technology. In the choroid of the imaged retina, barely any structures are visible, which is caused by multiple scattered photons [31, 32]. In addition, artifacts in the larger vessels, caused by the Doppler effect, decrease overall image quality.
The applied method for determination of the phase function was robust on scattering structures and gave good results correcting the aberrations induced by the eye. The computation time with the current implementation depended on the size of the region taken into account. For a small area of a single volume the computation time ranged from a few seconds to a less than a minute on a standard desktop CPU but can certainly be further reduced.
5 Discussion and conclusion
For the first time, completely phase-stable volumetric data of human retina were acquired in vivo. This was possible by a currently unmatched A-scan rate reaching , corresponding to volumes per second with million voxels per volume. This phase-stable data allowed us to correct aberrations and to remove the effects of a limited focal depth. The demonstrated image quality optimization worked in retinal imaging to correct the nerve fiber layer, small capillaries and the photoreceptor cells and is largely independent of the imaged structure. Only specular reflections not filling the aperture, or the complete absence of any signal disturbs the correction. This way, in only a single measurement all retinal layers were obtained with diffraction limited resolution.
Currently, the pixel number of the camera that can be used at the required acquisition rate, and the tuning range of the laser limit the system capabilities. The former restricts the field of view, the latter results in a low axial resolution of approximately in tissue, especially when compared to the diffraction-limited lateral resolution of at 0.2 NA. However, we expect that both limitations will be addressed by future technological advances.
Compared to scanning systems, disadvantages of FF-SS-OCT are Doppler artifacts and a higher sensitivity to multiple scattered photons, although the latter was not as severe as we anticipated. On the other hand, system complexity is reduced significantly and no moving parts are involved. Our setup profits from a recently available high-speed CMOS camera, which is its most advanced and expensive component. As its technology matures, availability might increase making FF-SS-OCT a cost-effective alternative to complex OCT systems that implement adaptive optics (AO-OCT. e.g. [17]) with deformable mirrors and wavefront sensors. Partially due to this complexity, AO-OCT has not yet found wide spread use in neither clinics nor clinical research.
However, fully coherent high-speed tomography not only visualizes dynamic processes with diffraction limited resolution, but will also provide new contrast mechanisms that rely on fast and small changes of scattering properties or of optical pathlengths. Hence FF-SS-OCT can contribute to numerous areas, e.g., measure tissue responses to photocoagulation [33], detect heart-beat-induced pressure waves in order to probe vascular status [34, 35], or obtain data for optophysiology [36].
6 Methods
Setup
A simple Mach-Zehnder interferometer setup was used for full-field OCT imaging of the retina (Fig. 1). Light from a tunable light source was split by a fiber coupler into reference and sample arm. The light in the reference arm was collimated and brought onto the camera through a beam splitter cube. Light from the sample arm illuminated the retina through the same beam splitter cube and the imaging optics with a parallel beam. The backscattered light from the retina was imaged onto the camera with numerical apertures (NA) ranging from to , the latter corresponding to the maximum aperture of the human eye () which was only achieved during mydriasis. The illuminated field on the retina was imaged onto the area-of-interest of the camera, maximizing light efficiency. Polarization of both arms was matched to enhance interference contrast and sensitivity.
The light source (Superlum BroadSweeper BS-840) was tunable over with a central wavelength of , which resulted in about axial resolution in tissue. In combination with a semiconductor amplifier approximately were coupled into the interferometer, illuminating the extended area on the retina with approximately . The high speed CMOS camera (Photron FASTCAM SA-Z) achieved a frame rate of at a resolution of . For each volume images were acquired, each at a different wavenumber in the tuning range of the light source. The acquisition speed is thus equivalent to A-scan rate. For each measurement volumes were imaged.
Reconstruction
At first a coherent average of the 50 acquired volumes was computed and the resulting mean was subtracted from all volumes. This removed fixed and phase stable artifacts in the images, while leaving the signals of the moving retina intact. Afterwards, in analogy to FD-OCT signal processing, the OCT volumes were reconstructed by Fourier transforming the acquired images along the wavenumber axis giving the depth information at each pixel of the image.
The data was then corrected for group velocity dispersion mismatch in reference and sample arm and slight axial bulk motion. This was done using the same optimization approach that was used for aberration correction by approximating the dispersion phase function by a polynomial of order 16. The resulting volumes were axially and laterally shifted to maximize the correlation of their absolute values by using the Fourier shift theorem. This ensured that the layers of the retina were at identical depth positions and made selection of the input regions for the aberration correction easier. Finally, after aberration correction, this correlation maximization was repeated giving more precise results due to the smaller lateral structures. This ensured that structures were in the same place so that absolute values of the data could be averaged. Finally, 2 to 6 layers of the respective retinal structures were averaged giving the presented en face images.
Aberration Correction
Complex en face images, i.e. slices at a certain depth given by at pixel , were taken as input for the aberration removal step. In general multiple layers were used to improve the overall signal of the metric. Small sub-volumes of about pixels with 6 to 10 layers turned out to be sufficient to correct aberrations for the low NA retinal image. For the high NA retinal images sub-volume size was about pixels with 4 to 10 layers. At first all volumes were corrected individually choosing a central region to determine the aberrations up to \nth8 radial degree (42 degrees of freedom). Afterwards the entire data were stitched together of small sub-volumes, each corrected individually. For this last step only aberrations to \nth5 radial degree were taken into account and the metric was averaged over all 50 volumes.
The aberration correction itself is similar to a process that was previously shown for SAR imaging by Fienup [18, 5]. For a given phase front , where describe pixels in lateral frequency space, the phase front was evaluated by
with being the Zernike polynomials, being coefficients describing the phase front, and enumerating the different Zernike polynomials. The image was then reconstructed by
where denotes the two-dimensional discrete Fourier transform of and is the discrete Fourier matrix. The sum can be performed by a fast Fourier transform (FFT).
The image quality or sharpness of the en face images was evaluated with the help of the normalized image intensity by the Shannon entropy given by
| (5) |
which is supposed to be minimized for optimal imaging quality [25]. In analogy to the demonstration by Fienup [18], the gradient could be efficiently evaluated by
7 Acknowledgements
This research was sponsored by the German Federal Ministry of Education and Research (Innovative Imaging & Intervention in early AMD, contract numbers 98729873C and 98729873E).
8 Author contributions
D.H. contributed theoretical and mathematical basics, worked on the optical setup, wrote the manuscript, analyzed the data, and helped to obtain funding. H.Sp. and G.F. worked on the optical setup, collected data and reviewed the manuscript. C.H., H.Su., and C.P. worked on the optical setup and collected data. C.W. performed Zemax simulations. G.H. contributed to the theoretical basics, partly wrote, reviewed and edited the manuscript, as well as obtained funding.
9 Competing financial interests
D.H. and C.W. are working for Thorlabs GmbH, which produces and sells OCT systems. D.H. and G.H. are listed as inventors on a related patent application (application no. PCT/EP2012/001639).
References
- [1] Fercher, A., Hitzenberger, C., Kamp, G. & El-Zaiat, S. Measurement of intraocular distances by backscattering spectral interferometry. Opt. Commun. 117, 43–48 (1995).
- [2] Chinn, S. R., Swanson, E. A. & Fujimoto, J. G. Optical coherence tomography using a frequency-tunable optical source. Opt. Lett. 22, 340–342 (1997).
- [3] Häusler, G. & Lindner, M. W. "Coherence radar" and "Spectral radar" – new tools for dermatological diagnosis. J. Biomed. Opt. 3, 21–31 (1998).
- [4] Stadelmaier, A. & Massig, J. H. Compensation of lens aberrations in digital holography. Opt. Lett. 25, 1630–1632 (2000).
- [5] Fienup, J. R. & Miller, J. J. Aberration correction by maximizing generalized sharpness metrics. J. Opt. Soc. Am. A 20, 609–620 (2003).
- [6] Ralston, T. S., Marks, D. L., Scott Carney, P. & Boppart, S. A. Interferometric synthetic aperture microscopy. Nature Phys. 3, 129–134 (2007).
- [7] Adie, S. G., Graf, B. W., Ahmad, A., Carney, P. S. & Boppart, S. A. Computational adaptive optics for broadband optical interferometric tomography of biological tissue. Proc. Natl. Acad. Sci. U.S.A. 109, 7175–7180 (2012).
- [8] Adie, S. G. et al. Guide-star-based computational adaptive optics for broadband interferometric tomography. Appl. Phys. Lett. 101, 221117 (2012).
- [9] Ahmad, A. et al. Real-time in vivo computed optical interferometric tomography. Nature Photon. 7, 444–448 (2013).
- [10] Shemonski, N. D. et al. Stability in computed optical interferometric tomography (Part I): Stability requirements. Opt. Express 22, 19183–19197 (2014).
- [11] Shemonski, N. D. et al. Stability in computed optical interferometric tomography (Part II): in vivo stability assessment. Opt. Express 22, 19314–19326 (2014).
- [12] Shemonski, N. D. et al. Three-dimensional motion correction using speckle and phase for in vivo computed optical interferometric tomography. Biomed. Opt. Express 5, 4131–4143 (2014).
- [13] Shemonski, N. D. et al. Computational high-resolution optical imaging of the living human retina. Nature Photon. 9, 440–443 (2015).
- [14] Považay, B. et al. Full-field time-encoded frequency-domain optical coherence tomography. Opt. Express 14, 7661–7669 (2006).
- [15] Bonin, T., Franke, G., Hagen-Eggert, M., Koch, P. & Hüttmann, G. In vivo Fourier-domain full-field OCT of the human retina with 1.5 million A-lines/s. Opt. Lett. 35, 3432–3434 (2010).
- [16] Klein, T. et al. Multi-MHz retinal OCT. Biomed. Opt. Express 4, 1890–1908 (2013).
- [17] Kocaoglu, O. P., Turner, T. L., Liu, Z. & Miller, D. T. Adaptive optics optical coherence tomography at 1 MHz. Biomed. Opt. Express 5, 4186–4200 (2014).
- [18] Fienup, J. R. Synthetic-aperture radar autofocus by maximizing sharpness. Opt. Lett. 25, 221–223 (2000).
- [19] Goodman, J. W. Introduction to Fourier optics (Roberts & Company, Englewood, CO, 2005).
- [20] Hillmann, D. et al. Common approach for compensation of axial motion artifacts in swept-source OCT and dispersion in Fourier-domain OCT. Opt. Express 20, 6761–6776 (2012).
- [21] Liu, C., Yu, X. & Kim, M. K. Phase aberration correction by correlation in digital holographic adaptive optics. Appl. Opt. 52, 2940–2949 (2013).
- [22] Tippie, A. E. & Fienup, J. R. Sub-aperture techniques applied to phase-error correction in digital holography. In Digital Holography and Three-Dimensional Imaging, DMA4 (Optical Society of America, 2011).
- [23] Kumar, A., Drexler, W. & Leitgeb, R. A. Subaperture correlation based digital adaptive optics for full field optical coherence tomography. Opt. Express 21, 10850–10866 (2013).
- [24] Thurman, S. T. & Fienup, J. R. Phase-error correction in digital holography. J. Opt. Soc. Am. A 25, 983–994 (2008).
- [25] Flores, B. C. Robust method for the motion compensation of ISAR imagery. Proc. SPIE 1607, 512–517 (1992).
- [26] Wojtkowski, M. et al. Ultrahigh-resolution, high-speed, Fourier domain optical coherence tomography and methods for dispersion compensation. Opt. Express 12, 2404–2422 (2004).
- [27] Muller, R. A. & Buffington, A. Real-time correction of atmospherically degraded telescope images through image sharpening. J. Opt. Soc. Am. 64, 1200–1210 (1974).
- [28] Paxman, R. G. & Marron, J. C. Aberration correction of speckled imagery with an image-sharpness criterion. Proc. SPIE 0976, 37–47 (1988).
- [29] Nelder, J. A. & Mead, R. A simplex method for function minimization. Comput. J. 7, 308–313 (1965).
- [30] Hestenes, M. R. & Stiefel, E. Methods of conjugate gradients for solving linear systems. J. Res. Nat. Bur. Stand. 49, 409–436 (1952).
- [31] Karamata, B. et al. Multiple scattering in optical coherence tomography. I. Investigation and modeling. J. Opt. Soc. Am. A 22, 1369–1379 (2005).
- [32] Karamata, B. et al. Multiple scattering in optical coherence tomography. II. Experimental and theoretical investigation of cross talk in wide-field optical coherence tomography. J. Opt. Soc. Am. A 22, 1380–1388 (2005).
- [33] Müller, H. H. et al. Imaging thermal expansion and retinal tissue changes during photocoagulation by high speed OCT. Biomed. Opt. Express 3, 1025–1046 (2012).
- [34] Kotliar, K. et al. Retinal pulse wave velocity in young male normotensive and mildly hypertensive subjects. Microcirculation 20, 405–15 (2013).
- [35] Spahr, H. et al. Imaging vascular dynamics in human retina using full-field swept-source optical coherence tomography. Submitted to Opt. Letters (2015).
- [36] Bizheva, K. et al. Optophysiology: depth-resolved probing of retinal physiology with functional ultrahigh-resolution optical coherence tomography. Proc. Natl. Acad. Sci. U. S. A. 103, 5066–5071 (2006).