Sub-vector Extraction and Cascade Post-Processing for Speaker Verification Using MLLR Super-vectors
Abstract
In this paper, we propose a speaker-verification system based on maximum likelihood linear regression (MLLR) super-vectors, for which speakers are characterized by m-vectors. These vectors are obtained by a uniform segmentation of the speaker MLLR super-vector using an overlapped sliding window. We consider three approaches for MLLR transformation, based on the conventional -best automatic transcription, on the lattice word transcription, or on a simple global universal background model (UBM). Session variability compensation is performed in a post-processing module with probabilistic linear discriminant analysis (PLDA) or the eigen factor radial (EFR). Alternatively, we propose a cascade post-processing for the MLLR super-vector based speaker-verification system. In this case, the m-vectors or MLLR super-vectors are first projected onto a lower-dimensional vector space generated by linear discriminant analysis (LDA). Next, PLDA session variability compensation and scoring is applied to the reduced-dimensional vectors. This approach combines the advantages of both techniques and makes the estimation of PLDA parameters easier. Experimental results on telephone conversations of the NIST 2008 and 2010 speaker recognition evaluation (SRE) indicate that the proposed m-vector system performs significantly better than the conventional system based on the full MLLR super-vectors. Cascade post-processing further reduces the error rate in all cases. Finally, we present the results of fusion with a standard i-vector system in the feature, as well as in the score domain, demonstrating that the m-vector system is both competitive and complementary with it.
Index Terms:
m-Vector, Lattice/-best MLLR, MLLR super-vector, PLDA, Speaker VerificationI Introduction
Most state-of-the-art text-independent speaker-verification systems currently rely on the i-vector approach, where a universal background model (UBM) gaussian mixture model (GMM) representing a generic model of speakers is adapted to each target speaker by the maximum a posteriori (MAP) adaptation [1]; a super-vector of the model means is further projected to a lower-dimension space, resulting in a compact i-vector representative of the target speaker [2]. Alternatively, maximum likelihood linear regression (MLLR) super-vectors were introduced for speaker verification in a support vector machine (SVM) framework by Stolcke et al. [3], followed by several variants [4]. This was found to be both competitive and complementary with the approach of gaussian means super-vector associated with an SVM classifier [5]. More recently, only a few studies have further explored MLLR super-vectors for speaker verification [6, 7, 8].
Our aim in this paper is to explore a new representation of the speakers by their MLLR super-vectors We propose an MLLR-based speaker-verification system, where speakers are characterized by vectors called m-vectors by analogy with i-vectors, following and extending our preliminary work [9, 10]. These vectors are obtained by a uniform segmentation of the speaker MLLR super-vector using an overlapped sliding window. The smaller dimension of the m-vectors compared to the entire MLLR super-vector limits the sparsity of the data and makes session-variability compensation easier. The experiments in [9] were performed with m-vectors extracted from a UBM-based MLLR transformation, i.e., using a single, global model, not considering the phonetic information. In this work, we consider both a UBM-based MLLR transformation as well as phonetic class-based MLLR transformations; the latter is estimated either from the conventional -best automatic speech recognition (ASR) transcription or from the lattice word transcription. The lattice is indeed able to account for the ASR transcription errors, resulting in a more robust estimation of the MLLR transformations.
Second, we propose a two-stage post-processing method for the MLLR super-vector-based speaker-verification system, similar to the i-vector framework. In this case, the MLLR-based super-vectors are first projected onto a lower-dimensional discriminant or dominant vector space, which is generated by linear discriminant analysis (LDA) or principle component analysis (PCA). Then, probabilistic linear discriminant analysis (PLDA) session-variability compensation and scoring is applied to the reduced-dimensional vectors. This combines the advantages of both techniques and also helps the estimation of the PLDA parameters by reducing the dimension of the representation space.
Finally, we present the fusion of the proposed m-vector technique with a standard i-vector system in the feature as well as the score domain, showing the complementarity of the approaches. The experimental results are presented for a standard task of the NIST 2008 and 2010 speaker recognition evaluation (SRE) core condition with English telephone conversations [11, 12].
The paper is organized as follows: Section II presents a description of MLLR and its application to speaker recognition in the m-vector framework. We describe the reference systems and the post-processing common to all systems in Sections III. Section IV focuses on our proposed m-vector based systems. The experimental setup is described in Section V. Section VI reports the experimental results and discusses the performances. Finally, Section VII summarizes the work and draws several conclusions.
II MLLR-Based Speaker Modeling
MLLR is a speaker-adaptation technique that is mostly used in the ASR system to obtain the adapted speaker models for a given speech dataset. The speech signal is first decoded using a speaker-independent model, and then an MLLR transformation is estimated using either the -best or the lattice phonetic transcription. However, in speaker recognition, the MLLR transformation parameters are generally used in the form of a super-vector instead of forming a speaker-adapted model. In this section, we describe the estimation of the MLLR transformations, the formation of the MLLR super-vector and, finally, their transformation into m-vectors for speaker verification.
II-A MLLR transformation
MLLR [13] is commonly used for the speaker adaptation of speaker-independent (SI) hidden markov model (HMM)-based ASR systems, by estimating the affine transformations expressed as
| (1) |
where (, ) and represent the gaussian mean and covariance matrix of the state in the SI and adapted model, respectively. is called the MLLR transformation. MLLR transforms are usually estimated across a set of gaussians that share identical transformation parameters. In the context of an ASR system, these classes can be defined thanks to the phonetic similarities of the acoustic models and may represent phonetic classes. Therefore, each of the regression classes results in a separate MLLR transform.
Furthermore, automatic transcriptions of telephone conversations present typical word-error rates (WER) in the range of –. Therefore, MLLR transformation estimated based on the -best hypothesis often misses the correct acoustic model. To account for the transcription errors, lattice-based MLLR transforms [14, 15] are estimated using the word-lattice output of an ASR system obtained by first-pass decoding, which is converted into a model-level graph using the pronunciation variants in the lexicon. Details about the use of the lattice MLLR approach for speaker verification can be found in [16].
II-B m-vectors extraction
An MLLR super-vector [3] is formed by stacking the elements of the MLLR transformation matrix , e.g., row-wise. The bias did not provide any significant gain in our experiments and is not considered further.
The m-vector technique has been recently proposed for speaker verification [10]. In this approach, the speakers are characterized by a set of m-vectors, which are extracted from their MLLR super-vectors by a uniform segmentation using overlapping, sliding windows, as shown in Fig. 1. The following assumptions motivate the m-vector technique. Each row of the MLLR transformation is associated with a particular dimension of the feature vectors. Hence, each m-vector will capture the speaker-relevant information related to a subset of the features in a more compact way than the full MLLR super-vector. Furthermore, the overlap between the adjacent m-vectors limits the impact of the segmentation process. In contrast to the full super-vector, m-vectors have a smaller dimension, and hence, the parameter estimation of the post-processing step is less likely to be affected by the data sparsity.

A speaker is represented by several m-vectors that are processed separately and thus constitute several sub-systems, as illustrated on Fig. 1. The window size and the overlap control the actual number of m-vectors extracted from an MLLR super-vector. When the size of the MLLR super-vector is not a multiple of the window size, an additional m-vector is extracted by placing a window at the end point of the super-vector, to cover all elements of the super-vector.
III Reference Systems and Post-Processing
In this section, we describe a set of baseline MLLR systems and a state-of-the-art i-vector system used for comparisons, and we consider various post-processing techniques for dimension reduction and session-variability compensation.
III-A i-vector system
The i-vector system is based on the state-of-the-art technique for speaker-verification [2], in which speakers or speech segments are characterized by a vector called an i-vector. i-vectors are estimated by projecting the speaker data onto a total variability space, . This is generally expressed as,:
| (2) |
where denotes an i-vector. and are the GMM super-vectors of the speaker-dependent and speaker-independent (i.e., UBM) model, respectively. is a low-rank matrix representing the sub-space of the GMM super-vector domain, assuming that the speaker and channel variabilities are concentrated.
The i-vector framework greatly simplifies the speaker-recognition problem, because the similarity between the utterances from two different speakers may be simply computed using a Mahalanobis distance, instead of computing a log-likelihood ratio between the models given the data. The simplicity and efficiency of this approach led to applications into various domains, e.g., for the representation of HMM states for clusteringor the classification of segments for speaker segmentation [17]. This approach was also used for modeling the prosodic information [18] and the phonotactic information [19] for language recognition. The impact of the training segment duration for the i-vectors was explored in [20],and a method for balancing this effect was proposed in [21].
III-B Baseline MLLR-based systems
We consider several baseline systems based on the full MLLR super-vector, for a fair comparison with the proposed methods derived from the same super-vector. Four configurations for the dimension reduction of the MLLR super-vectors are compared:
-
•
LDA, PCA and PPCA-NAP, in which speakers are characterized by projecting their full MLLR super-vectors in a lower-dimensional space using LDA, PCA or probabilistic PCA with nuisance attribute projection (PPCA-NAP), followed by eigen factor radial (EFR) session-variability compensation and scoring as described below.
-
•
PLDA, where the full MLLR super-vectors are scored in the PLDA space.
In each case, depending on the models and procedure used for the MLLR estimation, three types of systems result, namely full ASR -best system, the full ASR lattice system and the full UBM system.
III-C Eigen factor radial (EFR)
EFR is a session-variability compensation (i.e., post-processing) and scoring technique. It was introduced in [22] to handle the session-variability compensation by iterative length normalization of the i-vector (i.e., ) as:
| (3) |
where and denote the covariance matrix and mean vector of the training i-vectors, respectively, in successive iterations. and are estimated from data collected over many non-target speakers.
During a test, the score between two post-processed i-vectors (e.g., ) is calculated using the Mahalanobis distance:
| (4) |
where denotes the within-class covariance matrix calculated over the non-target speakers data set.
EFR was shown to give better performance than the conventional LDA followed by within class covariance normalization (WCCN) with a cosine angle for speaker verification [22]. Thus, EFR is applied to both the m-vector and the MLLR super-vector systems for session-variability compensation and scoring. In the m-vector case, each sub-system has its own , and . Two iterations of length normalization (i.e., Eq. 3) are considered for all systems presented in the paper using EFR.
III-D Probabilistic linear discriminant analysis (PLDA)
PLDA is also a session-variability compensation and scoring technique. It is basically a generative modeling technique that decomposes the i-vector (i.e., ) into several contributions:
| (5) |
where and represent the eigen-voice and eigen-channel subspaces, respectively. , and are the speaker factor, channel factor and residual noise, respectively.
During a test, the score between two i-vectors (e.g., , ) is calculated as:
| (6) |
where the hypothesis defines that and are from the same speaker, and states that and are from different speakers. In our case, PLDA is also applied on the m-vectors or MLLR super-vectors. For details about the training of the PLDA parameters (), see [23, 24]. As per [25], two iterations of length normalization following Eq. 3 are applied to the data before PLDA.
III-E PPCA-NAP
The PPCA-NAP approach consists of removing an eigen-channel subspace from the full MLLR super-vectors for speaker characterization, similar to eigen-channel compensation on the MLLR super-vectors [6]. MLLR super-vector is decomposed as:
| (7) | |||||
| (8) |
where is the point estimator and is the low-rank intra-speaker variability matrix having prior distribution . The matrix is estimated with iterations of maximum likelihood (ML) estimation. We use EFR-based scoring, which yields better performance in our experiments than the inner product chosen by [6].
III-F Test phase
During the test phase, the m-vector, i-vector or MLLR super-vector of the test utterance is scored against the claimant specific vector, after post-processing of both vectors. For the m-vector systems combining several subsystems, the scores of the subsystems are equally weighted for fusion, i.e.,
| (9) |
where and represent the post-processed m-vectors of the claimant, and test utterance for the subsystem, respectively. denotes the scoring function between the two m-vectors.
IV Proposed Approaches
We propose in this section three variants of m-vector systems, along with a cascade post-processing for reducing the dimension of the MLLR super-vectors.
IV-A m-vector systems
For the ASR -best m-vector system and the ASR lattice m-vector system, MLLR transformations are estimated with respect to an SI HMM using the conventional -best hypothesis or the lattice transcription for a given speech segment, respectively. Then, class-wise MLLR transformations grouped into a super-vector are used for speaker characterization by m-vectors during a training session, as described in Section II-B. In this work, dimensional feature vectors are used and MLLR transformations are estimated with respect to two predefined phonetic classes, vowel and consonants. This results in a -dimensional MLLR super-vector for each phonetic class and finally a dimensional MLLR super-vector for a given speech segment. During the test, the m-vectors of the test utterance are scored against the claimant. Before scoring, the m-vectors are post-processed for session-variability compensation and scoring with PLDA or EFR. In the case of EFR, LDA is first applied on the m-vectors to reduce their dimension and improve the discrimination between the speakers. LDA is implemented independently for each sub-system. Hence, each sub-system has its own LDA projection matrix.
The UBM m-vector system is similar to the ASR -best or lattice m-vector systems. The main difference is that a simple UBM is considered as the SI model. A single-class, global MLLR transformation is estimated with respect to the UBM for a given speaker dataset without any speech transcription or phonetic knowledge. This results in a -dimensional MLLR super-vector.
IV-B Cascade post-processing
PLDA is commonly used in state-of-the-art speaker-verification systems using an i-vector for the session-variability and scoring technique without applying prior PCA, or LDA or PPCA-NAP to the data. In contrast to that of the i-vector, the dimension of the MLLR super-vectors is larger, and a direct estimation of the PLDA parameters may raise estimation issues due to the limited training examples. To reduce this risk, we propose a cascade post-processing, in which the m-vectors or full MLLR super-vectors are first projected onto a discriminant or dominant lower-dimensional vector space generated by LDA or PCA, respectively. Then, PLDA is applied on these reduced-dimensional vectors for session-variability compensation and scoring, as shown in Fig. 2.

V Experimental Setup
All experiments are performed on male speakers of the seventh common condition of interest (all trials involve only English language telephone speech in the training and the test) of NIST SRE 2008 core condition and of the fifth task (telephone-only) of the SRE 2010 core condition [11, 12]. There are and target models in NIST SRE 2008 and 2010, respectively. Each target is provided a single utterance for training its model. The utterances are approximately 5 minutes with minutes of speech on average.
For signal analysis, -dimensional vectors, including the Mel-PLP feature, log-energy and along with their first- and second-order derivatives, are extracted from the speech signal at a -ms frame rate using a -second Hamming window over the - Hz bandwidth. Voice activity detection is applied as a pre-processing step to discard less energetic or silent frames. Finally, the selected frames are normalized to a zero mean and unit variance at the utterance level. Two manually derived phonetic classes, vowels and consonants, are used for the MLLR transformations, estimated on the PLP+F0 features only. Audio segments aligned with the silence model after the decoding are not considered for the MLLR transformation relying on the ASR transcriptions, but are retained for the UBM-based system. All MLLR transformations are estimated with a single iteration.
A male-specific gender-dependent UBM with 512 gaussians and diagonal covariance matrices is trained using data from NIST SRE 2004. The large vocabulary continuous speech recognition (LVCSR) system used for MLLR transforms estimation is similar to the LIMSI RT’04 LVCSR system [26]. The acoustic models are trained using approximately 2000 hours of manually transcribed conversational telephone speech (CTS) data using the PLP+F0 features concatenated with additional MLP features [27]. The model sets cover approximately phone contexts, with tied states and Gaussians per state. Silence is modeled by a single state with Gaussians.
The LDA, PLDA, PCA, PPCA-NAP and EFR algorithm are implemented using data from non-target speakers from NIST -, Switchboard II parts , & , Switchboard cellular parts & , with approximately sessions per speaker. This results in utterances i.e., MLLR super-vectors. This data-set is also used for the training total variability space of the -dimensional i-vector system. In the cases of PCA, PPCA-NAP and LDA, the m-vectors or full MLLR super-vectors are normalized to a zero mean and unit variance. For PLDA, both the speaker- and channel- factor dimensions are varied from the dimension of the initial vector (m-vector, i-vector or full MLLR super-vector) with a step of to determine the optimal performance of the systems. For the SRE 2010 experiments, additional utterances are taken from NIST SRE 2006 and 2008 for T-space, LDA and PLDA implementation.
VI Results and Discussions
For analysis, the speaker-verification performance of the systems are compared in terms of EER on task 7 of NIST SRE 2008 using the EFR post-processing and scoring technique. The comparison between the proposed method and the baseline system are presented for various post-processing techniques on NIST SRE 2008 and on the most similar task of the SRE 2010 core condition.
VI-A Performance of the baseline systems
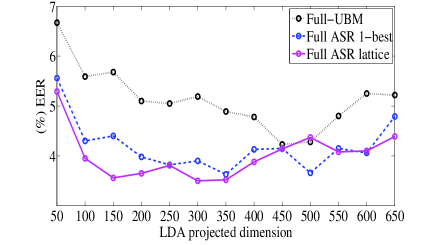
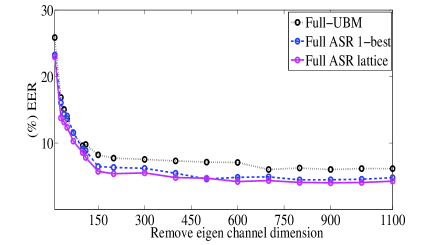
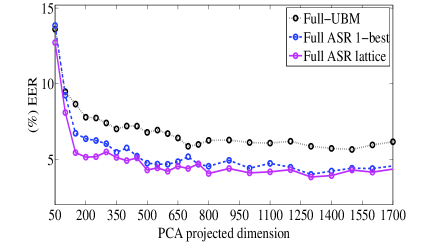
The speaker-verification performance of the baseline systems with PCA, PPCA-NAP and LDA is shown in Fig. 3, and an optimal projection is selected for each case according to the lowest EER. Table I summarizes the performance of the baseline systems for their respective optimal LDA, PPCA-NAP and PCA dimensions as shown in Figure 3. The following observations can be made: LDA-based systems perform better than PPCA-NAP- or PCA-based systems, whereas the performance of the systems based on PCA and PPCA-NAP is comparable. ASR-based systems give better performance than UBM-based systems, because they incorporate the phonetic knowledge available in the speech signal onto the MLLR transformations in contrast to the UBM-based system. As expected, ASR lattice systems perform slightly better than the conventional -best ASR-based systems, with 3.5% EER in the LDA configuration.
| Baseline | MLLR sup | Proj. | Optimal | %EER |
|---|---|---|---|---|
| Systems | vec. dim. | Method | Proj. dim. | |
| Full UBM | 1764 | LDA | 450 | 4.23 |
| PPCA-NAP | 700 | 6.02 | ||
| PCA | 1500 | 5.65 | ||
| Full ASR | 3528 | LDA | 350 | 3.63 |
| 1-best | PPCA-NAP | 800 | 4.47 | |
| PCA | 1300 | 4.00 | ||
| Full ASR | 3528 | LDA | 300 | 3.50 |
| Lattice | PPCA-NAP | 900 | 4.02 | |
| PCA | 1300 | 3.83 |
VI-B Optimal m-vector size
We show the speaker-verification performance for a wide range of m-vector window sizes in terms of the lowest EER for the SRE 2008 common condition 7 in Fig. 4. For simplicity, the optimal LDA projection dimension associated with each system for a particular m-vector dimension is not shown. The lowest EER value is achieved for m-vector dimensions of , and , respectively, in the UBM, ASR -best and ASR lattice m-vector cases. Hence, these optimal m-vector dimensions are selected for the respective systems and considered afterwards in this paper.
| Systems | Optimal | Optimal | %EER |
|---|---|---|---|
| m-vector | LDA proj. | ||
| dim. | dim. | ||
| UBM m-vector | 650 | 400 | 3.81 |
| ASR -best m-vector | 750 | 300 | 2.00 |
| ASR lattice m-vector | 800 | 300 | 1.73 |
| UBM cross m-vector | (650+650) | 250 | 4.02 |
| ASR -best cross m-vector | (750+750) | 450 | 2.02 |
| ASR lattice cross m-vector | (800+800) | 400 | 1.78 |
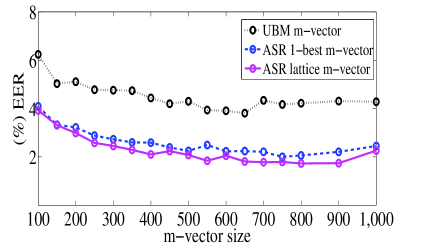
Table II summarizes the speaker-verification performance of the m-vector systems for their optimal m-vector dimensions, as shown in Fig. 4. We can observe that ASR-based m-vector systems perform significantly better than the UBM-based m-vector system, and that the ASR lattice system shows a slightly lower EER value than the -best ASR m-vector system as was already observed for the baseline systems, at 1.73% EER.
In addition, we also present the performance of the systems when the speakers are characterized by the vectors formed by concatenation of two m-vectors as . The motivation of this approach is to see whether the cross-correlation among the m-vectors is able to provide a further gain in the speaker verification. We call this the cross m-vector system. The performance of the cross and conventional m-vector systems given in Table II is comparable, showing that the conventional approach is sufficient to capture the speaker relevant information available in the MLLR super-vector for speaker verification, at least in the framework of linear fusion and transformation. In the remainder of the paper, only conventional m-vector systems are considered.
| System | (a) EFR post-processing | (b) PLDA post-processing | (c) Cascade post-processing | ||||
| Vector | Opt. | Opt. (spkr., | Opt. LDA proj. | ||||
| dim. | LDA proj. | %EER | chan.) factors | %EER | / PLDA factors | %EER | |
| Full-UBM | 1764 | 450 | 4.23 | (1450, 1000) | 4.43 | 450 / (300,350) | 3.87 |
| UBM m-vector | 650 | 400 | 3.81 | (150,500) | 3.50 | 400 / (200,350) | 3.55 |
| Full ASR 1-best | 3528 | 350 | 3.63 | (850,750) | 5.44 | 350 / (350,350) | 3.23 |
| ASR 1-best m-vector | 750 | 300 | 2.00 | (500,500) | 1.91 | 300 / (300,250) | 1.80 |
| Full ASR lattice | 3528 | 300 | 3.50 | (1100,700) | 4.60 | 300 / (200,250) | 2.69 |
| ASR lattice m-vector | 800 | 300 | 1.73 | (250,700) | 1.93 | 300 / (300,300) | 1.62 |
VI-C Comparison of the baseline and the m-vector systems
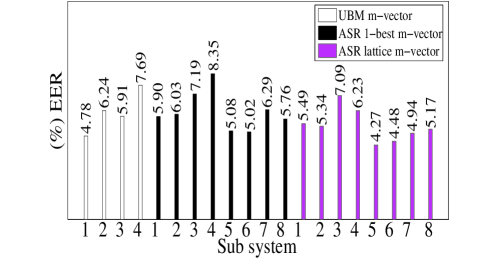
Table III(a)-(b) compares the performances of the optimal baseline systems with the proposed m-vector systems for the best parameter setup as found in earlier sections VI-A and VI-B, respectively, for various post-processing and scoring techniques. The proposed m-vector technique performs better than the baseline systems both with EFR and PLDA scoring, and the improvement is more important with the ASR-based approach (45-65% rel. improvement) than with the UBM-based approach (10-20% rel. improvement); in contrast, the performance with PLDA and EFR is comparable. From Fig. 5, it can be observed that the EER of the individual m-vector sub-systems is much higher than that of the resulting fused system, showing that each sub-system extracts relevant and complementary speaker information from the various parts of the MLLR super-vector.
VI-D Comparison of conventional and cascade post-processing
As shown in Table III(c), the proposed cascade post-processing technique provides a lower EER than the conventional single post-processing (i.e., PLDA or LDA+EFR) for MLLR-based systems in both the full as well as the m-vector cases, except in the UBM m-vector system configuration in which they are comparable. This indicates that LDA as a first step followed by PLDA combines the benefits of both techniques. LDA projects the MLLR super-vectors or the m-vectors onto a low-dimensional discriminant vector space, and PLDA then encounters less data sparsity in the parameter estimation in this reduced-dimensional space, yielding further gains and leading to 1.62% EER for the ASR lattice m-vector configuration.
In the presented cascade systems, PLDA was applied after selecting the optimal LDA projection dimension. Cascade post-processing was also performed with PCA or PPCA-NAP in the first stage and similarly showed an improvement upon the single-step systems, but the cascade system with LDA pre-processing performed the best. Further gains may be possible by optimizing the LDA, PCA or PPCA-NAP and PLDA parameters simultaneously.
| (a) EFR post-processing | (b) PLDA post-processing | ||||||
|---|---|---|---|---|---|---|---|
| System | i-/m-vector | Opt. | Opt. dim | ||||
| dim. | LDA proj. | %EER | MinDCF | (spkr., chan.) | %EER | MinDCF | |
| (A) i-vector | 400 | 300 | 4.02 | 0.0218 | (350,400) | 4.29 | 0.0211 |
| (B) UBM m-vector (cf. Table III) | 650 | 400 | 3.81 | 0.0226 | (150,500) | 3.50 | 0.0205 |
| (C) ASR 1-best m-vector (cf. Table III) | 750 | 300 | 2.00 | 0.0130 | (500,500) | 1.91 | 0.0131 |
| (D) ASR lattice m-vector (cf. Table III) | 800 | 300 | 1.73 | 0.0134 | (250,700) | 1.93 | 0.0134 |
| Late fusion∗ | |||||||
| (A)+(B) | - | - | 3.31 | 0.0199 | - | 3.23 | 0.0166 |
| (A)+(C) | - | - | 2.12 | 0.0122 | - | 1.95 | 0.0128 |
| (A)+(D) | - | - | 1.50 | 0.0122 | - | 1.75 | 0.0121 |
| Early fusion | |||||||
| (A)+(B) | 1050 | 500 | 2.97 | 0.0187 | (800,800) | 2.78 | 0.0177 |
| (A)+(C) | 1150 | 650 | 2.32 | 0.0146 | (750,1000) | 2.97 | 0.0180 |
| (A)+(D) | 1200 | 300 | 2.30 | 0.0145 | (1050,1000) | 2.83 | 0.0159 |
Linear fusion
VI-E Combination of the i-vector and m-vector systems
Table IV compares the i-vector-based speaker-verification system with the proposed m-vector systems and presents the performance for their late fusion in the score domain and early fusion in the vector domain (i.e., concatenation of the i-vector to each m-vector). The ASR-based m-vector performs better than the i-vector system with either EFR or PLDA, and the UBM-based system also shows promising performance. The late fusion system further reduces EER and MinDCF for both EFR and PLDA in most of the cases. As expected, the lattice m-vector-based system shows a slightly lower error rate than the ASR -best system. In the case of the early fusion system involving ASR-based systems, EFR performs better than PLDA for post-processing and scoring. This could be due to the fact that the early fusion systems result in larger dimensional vectors (i.e., m- plus i-vector size) and hence the PLDA system requires more training examples.
In the late fusion case, non-linear fusion of the scores of the various systems or sub-systems, may improve the speaker-verification performance compared to the results obtained with linear fusion. However, this requires additional data for training the parameters, and so it is kept as one of the perspectives of this work.
VI-F Performance on NIST SRE 2010
In this section, we compare the speaker-verification performance of the proposed m-vector systems with the i-vector on task 5 (telephone-telephone) of the NIST SRE 2010 core condition. Only ASR based m-vectors are considered, because they showed significantly better performance than the full-MLLR and UBM-based m-vector systems on SRE 2008. Table V(b) compares the system performance for the various post-processing and scoring techniques proposed. The m-vector size and the parameters used for LDA, PLDA and the cascade technique of the respective systems are the ones that were found to be optimal for the NIST SRE 2008, as presented in Tables III and IV.
| EFR | PLDA | |||
|---|---|---|---|---|
| System | %EER MinDCF∗∗ | %EER MinDCF∗∗ | ||
| (A) i-vector | 3.69 | 0.7648 | 3.09 | 0.7406 |
| (C) ASR 1-best m-vector | 3.06 | 0.3399 | 2.83 | 0.2861 |
| (D) ASR lattice m-vector | 3.44 | 0.5042 | 2.92 | 0.3229 |
| Late fusion∗ | ||||
| (A)+(C) | 2.75 | 0.3172 | 2.29 | 0.3165 |
| (A)+(D) | 2.35 | 0.2832 | 2.72 | 0.3144 |
| Early fusion | ||||
| (A)+(C) | 2.59 | 0.5941 | 2.61 | 0.4589 |
| (A)+(D) | 2.78 | 0.4517 | 2.84 | 0.4411 |
∗ Linear fusion; ∗∗ MinDCF as per NIST SRE 2010
| System | %EER | MinDCF |
|---|---|---|
| i-vector | 3.01 | 0.5977 |
| ASR 1-best m-vector | 2.46 | 0.2776 |
| ASR lattice m-vector | 2.08 | 0.2436 |
The proposed m-vector system yields better performance than the i-vector in terms of both EER and MinDCF for the EFR and PLDA post-processing and scoring techniques, similar to the result on the NIST SRE 2008 in Table III. Further, early fusion in the feature domain as well as late fusion in the score domain of both the m- and i-vectors reduces the EER in all configurations, and also reduces the MinDCF for late fusion in the EFR configuration. This confirms the complementarity between the m- & i-vectors. Additionally, the proposed cascade post-processing technique shows significantly lower EER and MinDCF values compared to the conventional single post-processing (i.e., PLDA or LDA+EFR) of the respective systems. Combining cascade post-processing and fusion between the i- and m-vector systems would be a natural extension of this work.
It is to be noted that on the same dataset (i.e., male speakers trials of the NIST SRE 2010 condition 5), Scheffer et al. reported 0.432 MinDCF and 3.29% EER for their best MLLR configuration [6]. For the male trials of the NIST SRE 2010 extended task with significantly more trials and training data, Cumani et al. reported 0.470 MinDCF and 4.15% EER for a MLLR PLDA system [7]. Our MLLR m-vector systems compare favorably to these results. Both studies [6, 7] also presented a baseline system with NAP-compensated MLLR vectors and an SVM back-end, which stood significantly behind the other systems; and we therefore did not consider an SVM-based system in our work.
VII Conclusions
In this paper, we addressed speaker verification (SV) using m-vectors for speaker representation, in which m-vectors are extracted by a uniform segmentation of the speaker MLLR super-vector using an overlapping window. We compared two main techniques for session-variability compensation and scoring, namely eigen factor radial (EFR) and probabilistic linear discriminant analysis (PLDA), and we proposed a cascade post-processing technique for speaker verification using the m-vector or MLLR super-vector. The system performances were demonstrated for male speakers for a standard task of the SRE 2008 and SRE 2010 core condition.
Our experiments show that the proposed m-vector approach performs significantly better than the baseline approach of directly processing the full MLLR super-vector in all configurations. This indicates that it is able to retrieve more speaker-relevant information from the speaker MLLR super-vector than the conventional approach. The most obvious explanation is related to the data sparsity issue that arises when estimating the LDA or PLDA projection matrices with the full MLLR super-vectors. The m-vector approach may be sub-optimal in the sense that each m-vector only represents a subset of the initial MLLR super-vector. A single m-vector sub-system is indeed less efficient than the baseline system. However, the fusion of the different m-vector sub-systems enables a more precise estimation of the projection space and, finally, a more robust and better-performing system.
The same explanation can be proposed with the cascade post-processing technique, which yields reductions in the SV error rates compared to the standalone PLDA or LDA+EFR systems. In this technique, the m-vector or MLLR super-vector is first projected onto a low-dimensional discriminant vector space generated by LDA. Then, PLDA is applied on the reduced-dimensional vector for session-variability compensation and scoring. This two-stages process combines the advantages of both techniques and reduces the possible data-sparsity problem at the PLDA stage compared to the direct use of the full dimension vector.
As expected, the improvement in the SV performance with ASR-based systems over that of the UBM-based system shows the effectiveness of integrating phonetic knowledge into the MLLR transformation. The ASR lattice-based method performed slightly better than the -best transcription, because it was more robust to transcription errors.
Finally, we compared the performance of the proposed m-vector with a standard i-vector system associated with EFR and PLDA post-processing. The proposed ASR-based m-vector system showed consistently better performance than the i-vector system. We also considered the late fusion in the score domain and the early fusion in the vector domain for m- and i-vector systems. Both fusion cases provided further improvement of the SV performance compared to the individual systems, showing that the m- and i-vectors contain complementary speaker-relevant informations.
Acknowledgments
This work was realized through the QUAERO Program and the QCOMPERE project, which were funded by OSEO (French State agency for innovation, now Bpifrance) and ANR (French national research agency), respectively.
References
- [1] D. A. Reynolds, T. F. Quatieri, and R. B. Dunn, “Speaker Verification using Adapted Gaussian Mixture Models,” Digital Signal Processing, vol. 10, pp. 19–41, 2000.
- [2] N. Dehak, P. J Kenny, R. Dehak, P. Dumouchel, and P. Ouellet, “Front-End Factor Analysis for Speaker Verification,” IEEE Trans. on Audio, Speech and Language Processing, vol. 19, no. 4, pp. 788–798, 2011.
- [3] A. Stolcke, L. Ferrer, S. Kajarekar, E. Shriberg, and A. Venkataraman, “MLLR Transforms as Features in Speaker Recognition,” in Proc. of EUROSPEECH, September 2005, pp. 2425–2428.
- [4] Z. N. Karam and W. M. Campbell, “A Multi-class MLLR Kernel for SVM Speaker Recognition,” in Proc. of ICASSP, 2008, pp. 4117–4120.
- [5] M. Ferras, C.C. Leung, C. Barras, and J.-L. Gauvain, “Comparison of Speaker Adaptation Methods as Feature Extraction for SVM based Speaker Recognition,” IEEE Trans. on Audio, Speech and Language Processing, vol. 18, pp. 1366–1378, 2010.
- [6] Nicolas Scheffer, Yun Lei, and Luciana Ferrer, “Factor Analysis Back Ends for MLLR Transforms in Speaker Recognition,” in Proc. of INTERSPEECH, 2011, pp. 257–260.
- [7] Sandro Cumani, Oldrich Plchot, and Martin Karafi t, “Independent component analysis and MLLR transforms for speaker identification,” in Acoustics, Speech and Signal Processing (ICASSP), 2012 IEEE International Conference on. 2012, p. 4365 4368, IEEE.
- [8] Andreas Stolcke, Arindam Mandal, and Elizabeth Shriberg, “Speaker recognition with region-constrained MLLR transforms,” in Acoustics, Speech and Signal Processing (ICASSP), 2012 IEEE International Conference on. 2012, p. 4397 4400, IEEE.
- [9] A. K. Sarkar, J. F. Bonastre, and D. Matrouf, “Speaker Verification using m-vector Extracted from MLLR Super-vector,” in Proc. of 20th European Signal Processing Conference (EUSIPCO), 2012, pp. 21–25.
- [10] A. K. Sarkar, C. Barras, and V. B. Le, “Lattice MLLR based m-vector System for Speaker Verification,” in Proc. of IEEE Int. Conf. Acoust. Speech Signal Processing (ICASSP), 2013, pp. 7654 – 7658.
- [11] NIST, “The NIST Year 2008 Speaker Recognition Evaluation Plan.,” http://www.itl.nist.gov/iad/mig/tests/sre/2008/sre08_evalplan_release4.pdf, 2008.
- [12] NIST, “The NIST Year 2010 Speaker Recognition Evaluation Plan.,” http://www.itl.nist.gov/iad/mig//tests/sre/2010/NIST_SRE10_evalplan.r6.pdf, 2010.
- [13] C. Leggetter and P. Woodland, “Maximum Likelihood Linear Regression for Speaker Adaptation of HMMs,” Computer Speech and Language, vol. 9, pp. 171–186, 1995.
- [14] M. Padmanabhan, G. Saon, and G. Zweig, “Lattice-Based Unsupervised MLLR for Speaker Adaptation,” in Proc. of the ISCA ITRW ASR2000, 2000, pp. 128–131.
- [15] L.F. Uebel and P.C. Woodland, “Improvements in Linear Tranformation based Speaker Adaptation,” in Proc. of IEEE Int. Conf. Acoust. Speech Signal Processing (ICASSP), 2001, pp. 49–52.
- [16] M. Ferras, C. Barras, and J. L. Gauvain, “Lattice-based MLLR for Speaker Recognition,” in Proc. of ICASSP, 2009, pp. 4537–4540.
- [17] G. Dupuy, M. Rouvier, S. Meignier, and Y. Est ve, “I-vectors and ILP Clustering Adapted to Cross-show Speaker Diarization,” in Proc. of INTERSPEECH, 2012, pp. 2174–2177.
- [18] M. Kockmann, L. Burget, O. Glembek, L. Ferrer, and J. Cernocky, “Prosodic Speaker Verification using Subspace Multinomial Models with Intersession Compensation,” in Proc. of INTERSPEECH, 2010, pp. 1061–1064.
- [19] M. M. Soufifar, L. Burget, O. Plchot, S. Cumani, and J. Cernocky, “Regularized Subspace n-gram Model for Phonotactic I-vector Extraction,” in Proc. of INTERSPEECH, 2013, pp. 74–78.
- [20] A. Larcher, P. Bousquet, K. Lee, D. Matrouf, H. Li, and J. F. Bonastre, “I-vectors in the Context of Phonetically-constrained Short Utterances for Speaker Verification,” in Proc. of IEEE Int. Conf. Acoust. Speech Signal Processing (ICASSP), 2012, pp. 4773–4776.
- [21] T. Hasan, R. Saeidi, J. H. L. Hansen, and D. A. van Leeuwen, “Duration Mismatch Compensation for i-vector based Speaker Recognition System,” in Proc. of IEEE Int. Conf. Acoust. Speech Signal Processing (ICASSP), 2013, pp. 7663 – 7667.
- [22] P. M. Bousquet, D. Matrouf, and J. F. Bonastre, “Intersession Compensation and Scoring Methods in the i-vectors Space for Speaker Recognition,” in Proc. of INTERSPEECH, 2011, pp. 485–488.
- [23] Simon J.D. Prince, “Computer Vision: Models Learning and Inference,” in Cambridge University Press, 2012.
- [24] M. Senoussaoui, P. Kenny, N. Br mmer, E. de Villiers, and P. Dumouchel, “Mixture of PLDA models in i-vector space for gender-independent speaker recognition,” in Proc. of Interspeech, 2011, pp. 25–28.
- [25] P. M. Bousquet, A. Larcher, D. Matrouf, J. F. Bonastre, and O. Plchot, “Variance-Spectra Based Normalization for i-vector Standard and Probabilistic Linear Discriminant Analysis,” in Proc. of Odyssey Speaker and Language Recognition Workshop, 2012.
- [26] R. Prasad et al., “The 2004 BBN/LIMSI 20xRT English Conversational Telephone Speech Recognition System,” in Proc. of INTERSPEECH, 2005, pp. 1645–1648.
- [27] P. Fousek, L. Lamel, and J. L. Gauvain, “Transcribing Broadcast Data using MLP Features,” in Proc. of INTERSPEECH, 2008, pp. 1433–1436.