Hard X-ray Emission from Sh 2–104: A NuSTAR search for Gamma-ray Counterparts
Abstract
We present NuSTAR hard X-ray observations of Sh 2–104, a compact HII region containing several young massive stellar clusters (YMSCs). We have detected distinct hard X-ray sources coincident with localized VERITAS TeV emission recently resolved from the giant gamma-ray complex MGRO J201937 in the Cygnus region. Faint, diffuse X-ray emission coincident with the eastern YMSC in Sh 2–104 is likely the result of colliding winds of component stars. Just outside the radio shell of Sh 2–104 lies 3XMM J201744.7365045 and a nearby nebula NuSTAR J201744.3364812, whose properties are most consistent with extragalactic objects. The combined XMM-Newton and NuSTAR spectrum of 3XMM J201744.7365045 is well-fit to an absorbed power-law model with cm-2 and photon index . Based on possible long-term flux variation and the lack of detected pulsations ( modulation), this object is likely a background AGN rather than a Galactic pulsar. The spectrum of the NuSTAR nebula shows evidence of an emission line at keV suggesting an optically obscured galaxy cluster at ( Mpc) and erg s-1. Follow-up Chandra observations of Sh 2–104 will help identify the nature of the X-ray sources and their relation to MGRO J201937. We also show that the putative VERITAS gamma-ray excess south of Sh 2–104 is most likely associated with the newly discovered Fermi pulsar PSR J20173625 and not the HII region.
Subject headings:
ISM: individual (MGRO J201937, VER J2019368, VER J2016371, 3FGL J2021.13651, 3FGL J2017.93627, 3FGL J2015.63709) — pulsars: individual (PSR J20213651, PSR J20173625) — stars: neutron — supernova remnants1. Introduction
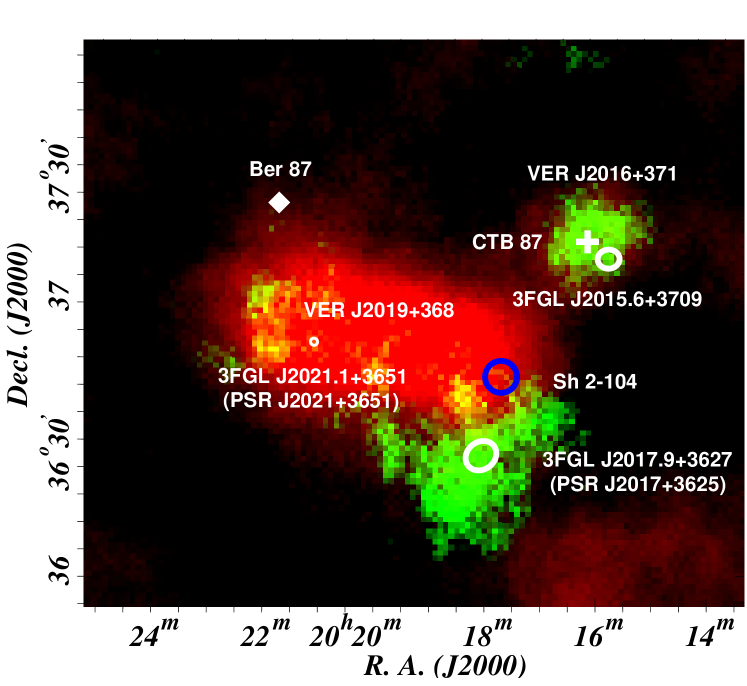
MGRO J201937 is the brightest Milagro gamma-ray source in the Cygnus region, with of the Crab Nebula flux at 20 TeV (Abdo et al., 2007). The origin and nature of MGRO J201937 has long been the subject of debate as its extent overlaps several supernova remnants (SNRs), HII regions, Wolf-Rayet stars, MeV gamma-ray sources, one or more Fermi pulsars and a hard X-ray transient. Recent TeV observations on scales using the VERITAS telescope clearly resolve out the giant gamma-ray complex into at least three distinct TeV emission regions, each coincident with a Fermi source (Aliu et al., 2014). The bulk of the VERITAS emission from MGRO J201937 falls into the elongated (), spectrally distinct (harder) source VER J2019368 (see Figure 1).
Paredes et al. (2009) argues that the Fermi pulsar PSR J20213651 (Roberts et al., 2002) at the eastern edge of VER J2019368 is not sufficiently energetic to power all the gamma-ray flux in the region, based on the time required for electrons to diffuse and fill the large emitting volume relative to their cooling lifetime. Instead, these authors suggest that massive star-forming activity associated with the HII region Sharpless 104 (herein Sh 2–104) can contribute to the gamma-ray flux from VER J2019368, possibly through wind collisions or interactions of protostar jets with the surrounding medium (Torres et al., 2004).
The well-studied Sh 2–104 lies beyond the Cygnus Galactic arm, kpc away, and contains at least two ultra compact massive stellar clusters within its radio diameter (Paredes et al., 2009). The massive CO clouds around the star clusters suggests Sh 2–104 as a prototype of massive-star formation triggered by the expansion of an HII region (Deharveng et al., 2003). An associated H-alpha nebula is clearly resolved in the DSS POSSII-J image, likely powered by a central O6 V star ionizing the region (Lahulla, 1985), and possibly a bright nearby IRAS source.
A serendipitous XMM-Newton observation of the MGRO J201937 field caught the eastern half of the Sh 2–104 radio shell at the edge of the field-of-view. Image analysis by Zabalza et al. (2010) revealed faint emission in this short exposure (20 ks), just above the noise level, that suggested several point sources within the radio shell. Most notably, these include ones overlapping the central star, coincident with a ROSAT source, and the eastern YMSC. Just outside the radio shell lies 3XMM J201744.7365045 and a barely detected nebula in diameter. These results open the possibility of identifying a low energy counterpart to the gamma-ray emission, and help identify its origin.
As part of the NuSTAR Galactic Survey program we have obtained broad band X-ray observations of Sh 2–104. In this paper, we report the detection of hard X-ray emission from the eastern YMSC, and from the XMM-Newton source and the nearby diffuse nebula. We consider the possibility that these sources are related to the star formation regions and/or associated with gamma-ray emission. Alternatively, the latter two sources may have an unrelated extragalactic origin.
2. NuSTAR observations of Sh 2–104
NuSTAR observed the HII region Sh 2–104 on 2014 Oct 21 (ObsId #30001048) followed by a second overlapping observation, offset to the south, on 2014 Nov 13 (ObsId #30001049). NuSTAR consists of two co-aligned X-ray telescopes, with corresponding focal plane modules FPMA and FPMB that provide FWHM imaging resolution over a 3–79 keV X-ray band, with a characteristic spectral resolution of 400 eV FWHM at 10 keV (Harrison et al., 2013). The reconstructed NuSTAR coordinates are accurate to at the 90% confidence level. The relative timing accuracy of NuSTAR is ms rms, after correcting for thermal drift of the on-board clock, with the absolute timescale shown to be better than ms (Mori et al., 2014; Madsen et al., 2015).
The data were processed and analyzed using FTOOLS 24Jan2014_V6.15.1 (NUSTARDAS 09Dec13_v1.3.1) with NuSTAR Calibration Database (CALDB) files of 2013 August 30. The resulting data set provides a total of 80.5 ks and 91.6 ks of net good time for the two pointings, respectively, after removing intervals of high background rates. We also exclude a bright arc of stay light that contaminates the eastern edge of the field-of-view in both detectors during the first observation. The extracted spectra combined data from both FPM detectors, grouped into appropriate spectral fitting channels, and modeled using the XSPEC (v12.8.2) spectral fitting package (Arnaud 1996). All spectral fits use the TBabs absorption model in XSPEC with the wilm Solar abundances (Wilms et al., 2000) and the vern photoionization cross-section (Verner et al., 1996).
2.1. Image analysis
Figure 2 presents the exposure-corrected 3–79 keV NuSTAR images of the Sh 2–104 field, combining data from both FPM detectors. The images are smoothed using a Gaussian kernel and scaled linearly. Most prominently, we detect a hard ( keV) point source just north of the Sh 2–104 complex and a poorly resolved nebula below it, roughly in diameter. These sources clearly correspond to faint X-ray emission seen in a short, 20 ks, 2007 XMM-Newton observation, detected serendipitously, at the very edge of the field-of-view (Zabalza et al., 2010).
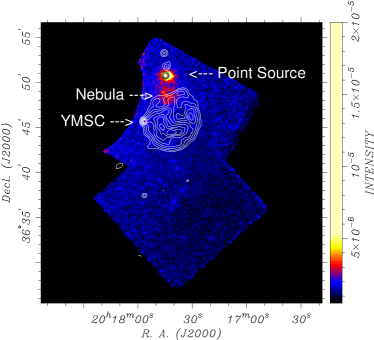
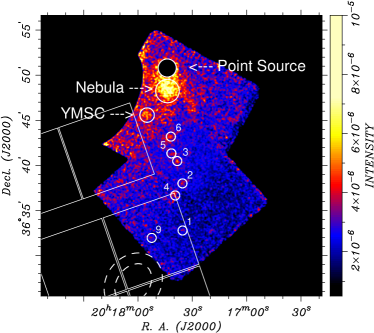
The two bright NuSTAR sources are embedded in enhanced diffuse emission that overlaps, at least in part, with the Sh 2–104 radio nebula. Of particular interest is a faint nebula detected at the radio spur of Sh 2–104, coincident with the eastern YMSC discussed in Paredes et al. (2009). Its spatial extent of , corrected for the PSF, is consistent with the size of the optical cluster. Further south we find evidence of several other faint sources, including a Swift X-ray source obtained as part of the follow-up program of Fermi sources. Table 1 presents the list of detected NuSTAR sources along with the significance of detection computed by wavdetect. The source coordinates are accurate to , registered using 3XMM J201744.7365045, the counterpart to the bright NuSTAR point source. Finally, we note that no hard X-ray counterpart is detected for the ROSAT source at the center of Sh 2–104 (Paredes et al., 2009). This suggest a soft X-ray source, likely thermal emission from the bright star in the central cluster, or a low-temperature colliding wind binary within this cluster.
| # | R.A. | Decl. | Net | Sig. | Comment |
|---|---|---|---|---|---|
| Counts | (Sigma) | ||||
| 1 | 20 17 35.97 | +36 32 45.0 | 4.4 | ||
| 2 | 20 17 36.02 | +36 37 58.5 | 5.2 | Swift source | |
| 3 | 20 17 38.91 | +36 40 27.1 | 3.7 | ||
| 4 | 20 17 40.02 | +36 36 38.3 | 3.1 | ||
| 5 | 20 17 42.13 | +36 41 18.2 | 4.0 | ||
| 6 | 20 17 42.41 | +36 43 09.7 | 4.1 | ||
| 7 | 20 17 44.32 | +36 48 12.9 | 27.0 | Nebula NuSTAR J201744.3364812 | |
| 8 | 20 17 44.42 | +36 50 46.4 | 35.0 | 3XMM J201744.7365045 | |
| 9 | 20 17 53.02 | +36 31 56.0 | 4.9 | ||
| 10 | 20 17 55.57 | +36 45 33.1 | 5.8 | Sh 2–104 stellar cluster / HII region |
Note. — Coordinate system is registered to accuracy using 3XMM J201744.7365045, the counterpart to the bright NuSTAR point source.
2.2. Spectral analysis
To preface our spectral analysis we note that the NuSTAR low-energy response ( keV) is too hard to constrain the absorbing column for a typical source with cm-2. In the following spectral fits using NuSTAR data alone, for definitiveness, we hold the column density fixed to a fiducial value of the Galactic total. Generally, the range of likely column density here is found to have no significant effect on the resulting spectral parameters. We include both a neutral Hydrogen111http://heasarc.gsfc.nasa.gov/cgi-bin/Tools/w3nh/w3nh.pl and a molecular Hydrogen component to the column density, to take into account significant local CO emission (see Dame et al., 2001). We compute a total Galactic column density of cm-2, a value consistent with the results of the combined XMM-Newton and NuSTAR fit to the spectrum of 3XMM J201744.7365045, presented below. In all cases, the quoted spectral uncertainties are at the 90% confidence level for one or two interesting parameter(s) for the one and two component spectral fits, respectively.
The high-energy emission from the eastern YMSC is of great interest, as this source is a natural candidate for the observed gamma-ray emission. We extracted a NuSTAR spectrum from YMSC using a aperture in the usable 3–10 keV range. This yields a total of 680 counts of which 71% are from background contamination, as estimated from counts extracted from an adjacent aperture () on same chip of each FPM. We consider several appropriate spectral models as the quality of the spectrum is not sufficient to distinguish between then. Under the assumption that the X-ray emission is due to colliding winds of component stars in the cluster we fit the raymond thermal plasma model in XSPEC (Raymond & Smith, 1977, and updates). The best-fit temperature is keV with a for 19 degrees-of-freedom (DoF). The 2–10 keV unabsorbed flux is erg cm-2 s-1. We estimate a source luminosity of erg s-1 from the plasma cooling curve (e.g., Maio et al., 2007) and the derived emission measure, computed from the model normalization and a distance of 4 kpc to Sh 2–104. We also consider a non-thermal model that can result from accelerated particles of past supernovae and/or quiescent or faint X-ray binaries. For a simple power-law model, the photon index is with a similar and flux as found for the thermal model.
For 3XMM J201744.7365045, we extracted a high quality NuSTAR spectrum using a source aperture and a background region offset from the source. The source spectrum is found to dominate the background up to 20 keV, but emission is evident to at least 30 keV. The spectrum is well-fitted in the 3–20 keV energy band to an absorbed power-law model with the column density held fixed to the Galactic total. The best fit spectral index is with for 28 DoF. The unabsorbed flux in the 2–10 keV band is erg cm-2 s-1. A blackbody model is excluded by the fit, as is, for lack of line features, thermal plasma models. The spectral results are presented Table 2.


| Parameter | NuSTAR only | XMM-Newton only | NuSTAR + XMM-Newton aaThe listed flux values are for the NuSTAR spectra, while the XMM-Newton spectra are jointly fit with a relative normalization factor to account for the flux variation. |
|---|---|---|---|
| (cm-2) | (fixed) | ||
| (2–10 keV) | |||
| (2–10 keV) | |||
| (dof) | 0.82 (29) | 0.68 (36) | 0.70 (62) |
Note. — Power-law model fits are obtained in the 0.5–10 keV and 3–20 keV energy bands for the XMM-Newton and NuSTAR spectra, respectively. For the joint NuSTAR and XMM-Newton spectral fits, the indexes and column densities are linked. The uncertainties are 90% confidence limits for two interesting parameters, except for the NuSTAR only data, which is for one interesting parameter. The given fluxes are in units of erg cm-2 s-1.
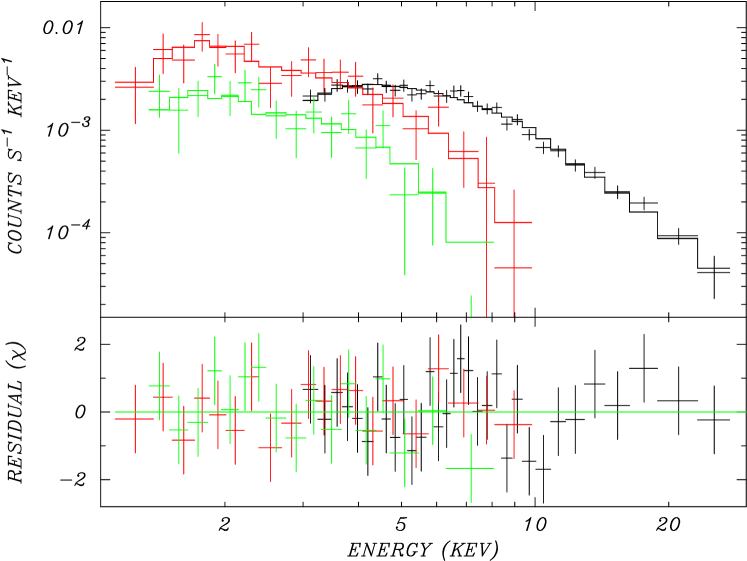
To better estimate the source column density for 3XMM J201744.7365045 we extracted and fit the XMM-Newton spectrum simultaneous with the NuSTAR data, allowing the flux normalization to be independent. This resulted in cm-2 and spectral index (see Figure 3). We note that the measured column is consistent with our estimate of the Galactic total. Compared to the XMM-Newton flux measurements obtained 7 years earlier, the NuSTAR value is lower, formally by a factor of . However, the former flux is not well established due to poor statistics, the high background, and the far off-axis source detection on the edge of the XMM-Newton EPIC instruments, and the relative flux calibration between instruments.
To examine the X-ray nebula NuSTAR J201744.3364812, we extracted spectra using a radius aperture and the background region defined above. This aperture encompassed nearly all the nebula extent to the background level. Of the aperture counts in the 3–20 keV optimal energy band, (42%) are attributed to the background. A fit to the nebula spectrum using an absorbed power-law model in the 3–20 keV band with the total Galactic column density yields a photon index with a for 57 DoF. The 2–10 keV absorbed flux is erg cm-2 s-1 (90% confidence level) and the unabsorbed flux is erg cm-2 s-1.
The poor statistic for this fit is mainly due to a line-like feature around keV (see Figure 4). No similar feature appears in the background or the NuSTAR spectrum of the point source 3XMM J201744.7365045. Introducing a Gaussian line to the fit, to better characterize the continuum, yield a line measured at keV and results in an excellent fit statistic of for 54 DoF. The F-test value of corresponds to a false positive significance of the added spectral line of . However, this significance should be interpreted with care (Protassov et al., 2002). Formally, an analysis of the F-test probability using the XSPEC script simftest confirms a highly significant detection of an emission line feature associated with the source.
As no emission line is known at this energy we consider the possibility of a redshifted Fe line from a galaxy cluster hidden behind the Galactic plane. A spectral fit using the Raymond-Smith model for a thermal plasma produced an excellent fit again, with for 55 DoF, with the column density fixed at the Galactic total. The best-fit parameters give a keV, redshift , and abundance . The 2–10 keV absorbed flux is erg cm-2 s-1 (90% confidence level) and the unabsorbed flux is erg cm-2 s-1. We note that the measured range of is essentially independent of the column density, from zero to cm-2, the point source value. This range yields a measured temperature range of keV, comparable to the uncertainty in obtained using the Galactic column.
For a galaxy cluster at the implied redshift distance of 800 Mpc, the total X-ray luminosity is erg s-1. This is within an order of magnitude of the value derived from the luminosity - temperature relation for clusters (Novicki et al., 2002). Moreover, based on the inferred temperature, the observed nebula size is well predicted for a putative cluster (Mohr et al., 2000). Given the large uncertainties in these relations we take the results as reasonably evidence that the X-ray nebula is due to a background galaxy cluster unrelated to the gamma-ray emission.
2.3. Timing Analysis
The high time resolution of NuSTAR allows a search for pulsations from 3XMM J201744.7365045 down to periods of ms, covering the expected range for a rotation-powered pulsar. For a timing analysis, photon arrival times were converted to barycentric dynamical time (TDB) using the XMM-Newton coordinates. The NuSTAR light curve is found to be stable during the observation on all timescales. A Fast Fourier Transform (FFT) finds no evidence of red noise, indicative of accreting systems in the power spectrum. We also searched for a coherent signal using both the FFT method and the test statistic for , and the H-test, to be sensitive to both broad and narrow pulse profiles. We initially restricted the timing search to photon energies in the 3–25 keV range and used an aperture of to optimize the signal-to-noise ratio. We repeated our search for an additional combination of energy ranges keV, keV and aperture sizes . None of these resulted in a significant detection. After taking into account the estimated background emission, we place an upper limit on the pulse fraction for a sinusoidal signal in the 3–25 keV band for the aperture.
3. Discussion
TeV gamma-ray emission from MGRO J201937 is well-separated into three regions by high-resolution VERITAS observations, each associated with a Fermi source (Aliu et al., 2014). To the north, VER J2016371 is likely associated with Fermi emission from the blazar B2013370 (Kara et al., 2012) and/or the filled-center supernova remnant CTB 87 (Aliu et al., 2014). To the south, localized VERITAS emission, significant at the confidence level, is coincident with the recently discovered Fermi pulsar, PSR J20173627, discussed below. To the east, the large elliptical morphology of the spectrally harder VER J2019368 suggests a blend of two overlapping sources. If the arguments of Paredes et al. (2009) are correct, the Fermi pulsar PSR J20213651 easily accounts for the eastern most TeV emission from VER J2019368, while Sh 2–104 may be responsible for a western component. In the following, we use new X-ray observations to explore possible origins for an eastern component of VER J2019368.
The NuSTAR data reveals faint emission from the eastern YMSC of Sh 2–104, with an inferred luminosity of erg s-1. In other YMSCs, hard 3 keV X-rays have been seen at similar levels from either point sources (Clark et al., 2008) or diffuse emission (Townsley et al., 2011). For the point source case, although it is possible for hard X-rays to be produced by an accreting compact object, a small number of isolated OB supergiants or Wolf-Rayet stars, colliding wind binaries (CWBs), or possibly even a single CWB could produce hard X-ray emission at the levels we observe (Clark et al., 2008; Sugawara et al., 2015). If a thermal model is the correct characterization of the NuSTAR spectrum, then the plasma temperature of 2–3 keV would favor CWBs over isolated massive stars (Bodaghee et al., 2015; Sugawara et al., 2015). Diffuse thermal or non-thermal X-ray emission could come from particles accelerated by past supernova events or continuous acceleration in CWB shocks (Muno et al., 2006; Townsley et al., 2011). Townsley et al. (2011) report non-thermal diffuse emission from NGC 3576 N with a power-law spectrum with 2.5. The power-law fit to Sh 2–104 YMSC gives , which is just barely compatible with NGC 3576 N.
The coincidence of gamma-ray emission near star-forming regions suggests a physical connection between the two – for example, W49A (Brun et al., 2010), Westerlund1 (Luna et al., 2010), and Carina Nebula, although the gamma-rays from the latter is likely dominated by the CWB Carinae (Tavani et al., 2009; Farnier et al., 2011). However, this connection remains far from clear, at least on an individual basis. For the case of the YMSC in Sh 2–104, we can consider several plausible physical mechanisms for generating the associated gamma-rays. As mentioned above, it is unlikely that the massive star binaries and protostars in the YMSC are sufficiently energetic to power a significant fraction of the TeV flux from the Milagro source, that is likely hadronic in nature, if extended. However, the YMSC may contribute gamma-rays to the western compact component of VER J2019+368, via a leponic process. This reduces the required energy budget by about two orders of magnitude (see Paredes et al. 2009).
The YMSC could also host other young and powerful non-thermal sources associated with massive stars, such as high-mass microquasars or massive binaries containing non-accreting pulsars (e.g. Paredes et al., 2013; Dubus, 2013). These sources, potentially hidden in hard X-rays by the dense environment in which they would be embedded, could also contribute to the overall gamma-ray emission from VER J2019+368. Qualitatively, if only a fraction of the source flux came from the YMSC, for exmaple a third, the energetic requirements of the western component of VER J2019+368 would be reduced, and a hadronic mechanism may be plausible. The lack of associated GeV emission from VER J2019+368 could be explained then by hadronic models for which the lower energy emission is suppressed, e.g., proton-proton interactions in the innermost region of the winds of massive O and B stars, as suggested by Torres et al. (2004) (see also Aharonian & Atoyan, 1996; Bosch-Ramon et al., 2005, for scenarios in which the GeV emission is rather low as compared to the TeV emission).
Alternatively, the substantial X-ray emission that lies outside the radio nebula of Sh 2–104 perhaps signals a previously unidentified star cluster responsible for the TeV emission. However, no specific optical or infrared counterpart is known. The coordinates of 3XMM J201744.7365045 are consistent to within with the 20 cm arcsec radio point source G74.8400.660 (FIRST Radio Survey; White et al., 2005), possibly the 327 MHz source WSRTGP 20153641 (Taylor et al., 1996), both nondescript radio objects in these Galactic surveys. A dedicated radio observation of Cygnus at 610 MHz by Paredes et al. (2009) determined a flux density of mJy for GMRT J201744.8365045. Comparing this to the 20 cm flux of 11.15 mJy (White et al., 2005) yields a spectral index of , where .
The combination of the radio and X-ray point source and diffuse emission suggest a pulsar and its wind nebula, perhaps born in the star formation region, which provides a natural source of seed photons for generating upscattered gamma-rays (cf., HESS J1837–069/PSR J1838–0655; Gotthelf & Halpern, 2008). Although the offset between the point source and the nebula is somewhat unusual, PWN systems often show complex X-ray morphology, as revealed by Chandra (e.g., Crab, MSH 1552; see Kargaltsev & Pavlov, 2008).
The X-ray spectrum of 3XMM J201744.7365045 is, however, somewhat steep for a pulsar, more consistent with that of a hidden optical AGN behind the Galactic plane. The radio spectrum also prefers an AGN interpretation over a pulsar. The likely coincidence with a bright point-like radio source, the lack of detected pulsations (), and the possible long term variability, strengthens this interpretation. However it is worth noting that the upper-limit on the modulation for an X-ray pulsar is not strongly constraining.
The origin of the nebula NuSTAR J201744.3364812, and whether it is connected to the point source, remains a mystery. The appearance of a possible spectral line at an unexpected energy suggests that this feature, if astrophysical, is likely a red-shifted Fe line from a galaxy cluster hidden behind the Galactic plane. The estimated luminosity and size of the nebula, based on its implied redshift and temperature, is consistent with this interpretation. The large column in the region (e.g., magnitude of extinction in the V-band) could easily account for the lack of an optical counterpart.
Finally, it is possible that the TeV gamma-ray emission near Sh 2–104 might be associated with the Fermi source 3FGL J2017.93627, to the south of the HII region. A search for pulsations from 3FGL J2017.93627 by the Einstein@Home distributed computing pulsar project (Anderson et al., 2006; Allen et al., 2013) detected a 167 ms signal, consistent with a 2 Myr old rotation-powered pulsar222https://einstein.phys.uwm.edu/gammaraypulsar/ FGRP1_discoveries.html (Clark, C., in prep.). The inferred spin-down power of PSR J2017+3625, erg s-1, suggests that it likely lies at a distance of 450 pc, given its gamma-ray flux of erg s-1 cm-2 (Acero et al., 2015) and a gamma-ray efficiency of , typical for a Fermi pulsar. On the other hand, the lack of significant X-ray detection of a candidate NS in the unpublished 10 ks Chandra observation (ObsID 14699) suggests that the pulsar is further away. For this observation, we estimate a flux limit of erg s-1 cm-2 for a typical pulsar power-law spectrum ( cm-2; ). The predicted distance is then kpc, based on the empirical relation between the X-ray luminosity of pulsars and their spin-down power (Possenti et al., 2002). At this distance, the local TeV emission, estimated to be roughly erg s-1, represents an efficiency of , plausible for a yr pulsar (e.g., see Kargaltsev et al., 2013).
In conclusion, it is possible that PSR J20173625 accounts for most, if not all, of the coincident VERITAS TeV excess and that the harder TeV photons near Sh 2–104 remain unaccounted for. Our analysis of the X-ray data is inconclusive as to the connection between the NuSTAR sources, the Sh 2–104 region, and the overlapping gamma-ray emission. Without further evidence, it is not yet possible to associate the Milagro gamma-ray emission with Sh 2–104. In this regard, it is important to determine the nature of the NuSTAR sources presented in this study. This will require high resolution Chandra observations to allow a comparison between these sources and several overlapping optical/IR stars and an unclassified radio source, that may or may not be related to the X-ray and/or gamma-ray emission.
References
- Abdo et al. (2007) Abdo, A. A., Allen, B., Berley, D., et al. 2007, ApJ, 658, L33
- Acero et al. (2015) Acero, F., Ackermann, M., Ajello, M., et al. 2015, ApJS, 218, 23
- Aharonian & Atoyan (1996) Aharonian, F. A., & Atoyan, A. M. 1996, A&A, 309, 917
- Aliu et al. (2014) Aliu, E., Aune, T., Behera, B., et al. 2014, ApJ, 788, 78
- Allen et al. (2013) Allen, B., Knispel, B., Cordes, J. M., et al. 2013, ApJ, 773, 91
- Anderson et al. (2006) Anderson, D. P., Christensen, C., & Allen, B. 2006, in Proceedings of the 2006 ACM/IEEE Conference on Supercomputing, SC ’06 (New York, NY, USA: ACM)
- Bodaghee et al. (2015) Bodaghee, A., Tomsick, J. A., Fornasini, F., Rahoui, F., & Bauer, F. E. 2015, ApJ, 801, 49
- Bosch-Ramon et al. (2005) Bosch-Ramon, V., Aharonian, F. A., & Paredes, J. M. 2005, A&A, 432, 609
- Brun et al. (2010) Brun, F., de Naurois, M., Hofmann, W., et al. 2010, in 25th Texas Symposium on Relativistic Astrophysics, 201
- Clark et al. (2008) Clark, J. S., Muno, M. P., Negueruela, I., et al. 2008, A&A, 477, 147
- Dame et al. (2001) Dame, T. M., Hartmann, D., & Thaddeus, P. 2001, ApJ, 547, 792
- Deharveng et al. (2003) Deharveng, L., Lefloch, B., Zavagno, A., et al. 2003, A&A, 408, L25
- Dubus (2013) Dubus, G. 2013, A&A Rev., 21, 64
- Farnier et al. (2011) Farnier, C., Walter, R., & Leyder, J.-C. 2011, A&A, 526, A57
- Gotthelf & Halpern (2008) Gotthelf, E. V., & Halpern, J. P. 2008, ApJ, 681, 515
- Harrison et al. (2013) Harrison, F. A., Craig, W. W., Christensen, F. E., et al. 2013, ApJ, 770, 103
- Kara et al. (2012) Kara, E., Errando, M., Max-Moerbeck, W., et al. 2012, ApJ, 746, 159
- Kargaltsev & Pavlov (2008) Kargaltsev, O., & Pavlov, G. G. 2008, in American Institute of Physics Conference Series, Vol. 983, 40 Years of Pulsars: Millisecond Pulsars, Magnetars and More, ed. C. Bassa, Z. Wang, A. Cumming, & V. M. Kaspi, 171–185
- Kargaltsev et al. (2013) Kargaltsev, O., Rangelov, B., & Pavlov, G. G. 2013, ArXiv e-prints, arXiv:1305.2552
- Lahulla (1985) Lahulla, J. F. 1985, A&AS, 61, 537
- Luna et al. (2010) Luna, A., Mayya, Y. D., Carrasco, L., & Bronfman, L. 2010, ApJ, 713, L45
- Madsen et al. (2015) Madsen, K. K., Harrison, F. A., Markwardt, C. B., et al. 2015, ApJS, 220, 8
- Maio et al. (2007) Maio, U., Dolag, K., Ciardi, B., & Tornatore, L. 2007, MNRAS, 379, 963
- Mohr et al. (2000) Mohr, J. J., Reese, E. D., Ellingson, E., Lewis, A. D., & Evrard, A. E. 2000, ApJ, 544, 109
- Mori et al. (2014) Mori, K., Gotthelf, E. V., Dufour, F., et al. 2014, ApJ, 793, 88
- Muno et al. (2006) Muno, M. P., Law, C., Clark, J. S., et al. 2006, ApJ, 650, 203
- Novicki et al. (2002) Novicki, M. C., Sornig, M., & Henry, J. P. 2002, AJ, 124, 2413
- Paredes et al. (2009) Paredes, J. M., Martí, J., Ishwara-Chandra, C. H., et al. 2009, A&A, 507, 241
- Paredes et al. (2013) Paredes, J. M., Bednarek, W., Bordas, P., et al. 2013, Astroparticle Physics, 43, 301
- Possenti et al. (2002) Possenti, A., Cerutti, R., Colpi, M., & Mereghetti, S. 2002, A&A, 387, 993
- Protassov et al. (2002) Protassov, R., van Dyk, D. A., Connors, A., Kashyap, V. L., & Siemiginowska, A. 2002, ApJ, 571, 545
- Raymond & Smith (1977) Raymond, J. C., & Smith, B. W. 1977, ApJS, 35, 419
- Roberts et al. (2002) Roberts, M. S. E., Hessels, J. W. T., Ransom, S. M., et al. 2002, ApJ, 577, L19
- Sugawara et al. (2015) Sugawara, Y., Maeda, Y., Tsuboi, Y., et al. 2015, PASJ, 67, 121
- Tavani et al. (2009) Tavani, M., Sabatini, S., Pian, E., et al. 2009, ApJ, 698, L142
- Taylor et al. (1996) Taylor, A. R., Goss, W. M., Coleman, P. H., van Leeuwen, J., & Wallace, B. J. 1996, ApJS, 107, 239
- Torres et al. (2004) Torres, D. F., Domingo-Santamaría, E., & Romero, G. E. 2004, ApJ, 601, L75
- Townsley et al. (2011) Townsley, L. K., Broos, P. S., Chu, Y.-H., et al. 2011, ApJS, 194, 16
- Verner et al. (1996) Verner, D. A., Ferland, G. J., Korista, K. T., & Yakovlev, D. G. 1996, ApJ, 465, 487
- White et al. (2005) White, R. L., Becker, R. H., & Helfand, D. J. 2005, AJ, 130, 586
- Wilms et al. (2000) Wilms, J., Allen, A., & McCray, R. 2000, ApJ, 542, 914
- Zabalza et al. (2010) Zabalza, V., Paredes, J. M., Martí, J., Sánchez-Sutil, J. R., & Muñoz-Arjonilla, A. J. 2010, in Astronomical Society of the Pacific Conference Series, Vol. 422, High Energy Phenomena in Massive Stars, ed. J. Martí, P. L. Luque-Escamilla, & J. A. Combi, 186