2Departamento de Astronomía, Universidad de Concepción, Av. Esteban Iturra s/n, Distrito Universitario, 160-C, Chile
3Harvard-Smithsonian Center for Astrophysics, Cambridge, MA, 02138, USA
4 Instituto de Radioastronomía y Astrofísica, Universidad Nacional Autónoma de México, Campus Morelia Apartado Postal 3-72, 58090, Morelia, Michoacán, México
5Universität Heidelberg, Zentrum für Astronomie, Institut für Theoretische Astrophysik, Albert-Ueberle-Str. 2, D-69120 Heidelberg, Germany
Fourier-space combination of Planck and Herschel images
Abstract
Context. Herschel has revolutionized our ability to measure column densities (NH) and temperatures (T) of molecular clouds thanks to its far infrared multiwavelength coverage. However, the lack of a well defined background intensity level in the Herschel data limits the accuracy of the NH and T maps.
Aims. We aim to provide a method that corrects the missing Herschel background intensity levels using the Planck model for foreground Galactic thermal dust emission. For the Herschel/PACS data, both the constant–offset as well as the spatial dependence of the missing background must be addressed. For the Herschel/SPIRE data, the constant–offset correction has already been applied to the archival data so we are primarily concerned with the spatial dependence, which is most important at 250 m.
Methods. We present a Fourier method that combines the publicly available Planck model on large angular scales with the Herschel images on smaller angular scales.
Results. We apply our method to two regions spanning a range of Galactic environments: Perseus and the Galactic plane region around (HiGal–11). We post-process the combined dust continuum emission images to generate column density and temperature maps. We compare these to previously adopted constant–offset corrections. We find significant differences (20%) over significant (15%) areas of the maps, at low column densities ( cm-2) and relatively high temperatures ( K). We also apply our method to synthetic observations of a simulated molecular cloud to validate our method.
Conclusions. Our method successfully corrects the Herschel images, including both the constant–offset intensity level and the scale-dependent background variations measured by Planck. Our method improves the previous constant–offset corrections, which did not account for variations in the background emission levels.
Key Words.:
ISM: Clouds, Stars: Formation1 Introduction
The Herschel Space Telescope PACS (Poglitsch et al., 2010) and SPIRE (Griffin et al., 2010) photometers have surveyed large areas of the sky (e.g., André et al., 2010; Gordon et al., 2010; Kramer et al., 2010; Meixner et al., 2010; Molinari et al., 2010; Fritz et al., 2012; Draine et al., 2014; Stutz & Gould, 2016) in the far-infrared (FIR) and sub-millimeter (sub–mm) from 70 to 500 m, measuring the cold dust emission largely inaccessible from the ground. Furthermore, the stability of space-based observations allows for the recovery of extended emission down to much fainter flux levels and over larger scales than those accessible with ground-based sub-mm data. Simultaneously, the Herschel data probe higher column densities at higher resolution than those commonly accessible with near-infrared (NIR) extinction measurements (but see also Stutz et al., 2009; Kainulainen et al., 2011).
However, even given the wealth of information that the Herschel PACS and SPIRE continuum data provide, large portions of these data remain to be fully scientifically exploited. One obstacle to obtaining accurate column density and temperature maps is that the Herschel archive data have not received a full background correction. Obtaining such corrections is not trivial. In the case of the SPIRE images, the archive data have been partially corrected with a Planck–derived (Planck Collaboration et al., 2014b) constant–offset111This procedure is described in detail in the instrument handbook: herschel.esac.esa.int/Docs/SPIRE/spire_ handbook.pdf.. The constant–offset correction for SPIRE assumes average zero–level flux values (a single constant-offset correction over a given map), based on Planck measurements. Similar corrections have also been applied in Bernard et al. (2010) and Lombardi et al. (2014). Furthermore, we also refer to Zari et al. (2016) for a near infrared extinction and Planck based calibration method. All these methods implicitly assume that the corrections to the Herschel intensity are independent of angular scale. We note that comparisons with Planck data show that this is in general a good approach for the SPIRE 350 and 500 m SPIRE data (Bertincourt et al., 2016). In the case of the Herschel archive PACS images no background corrections have been applied.
While the constant-offset corrections partially account for the missing background in the Herschel images, the Planck flux distribution may significantly vary within the image area, especially in cases where the maps are large and at shorter wavelengths. To our knowledge there is no previous demonstration that the constant–offset correction will fully capture the background variations in the PACS and SPIRE 250 m data. Therefore, both PACS and SPIRE images would benefit from a background correction that is capable of grasping the scale dependence of the background emission levels. The knowledge of these background levels are an obvious requirement to estimate the “actual” flux scale measurements in Herschel images.
The Planck all-sky dust model (Planck Collaboration et al., 2014a) is currently the best available option for correcting the Herschel images in the wavelength range 160 m–500 m because of the close match in wavelength coverage. The dust model obtained from Planck was derived using 353 GHz, 545 GHz, 857 GHz, and IRAS 100 m data. The inclusion of the IRAS 100 m data in the Planck model helps to better constrain peak of the dust spectral energy distribution near 160 m. Here we develop a method that uses this Planck model to correct the arbitrary flux scale of the Herschel data. In the case of PACS, this correction includes both constant–offset as well as spatial dependence of the corrections that capture the variations in the Planck fluxes at large scales. In the case of SPIRE, since these data already include the constant–offsets from Planck, the correction addresses the possible spatial variations in the background levels. Thus, this method is specially relevant for the PACS data, but can also be important for SPIRE, and in particular for the 250 m data. In summary, here we essentially combine the Planck and Herschel maps in Fourier space, keeping the information of the former at large scales and the latter at small scales. The transition from large (Planck) to small (Herschel) scales, defined as scale at which Planck and Herschel have similar amplitudes in the Fourier space, is individually estimated for each map.
We apply our method to two fields observed by Herschel that span a wide range of Galactic environments: Perseus, and the Galactic plane region at (HiGal–11, including G11 and W31). We use the new background-calibrated maps to obtain dust column density (NH) and temperature (T) maps. We compare our column density maps to those obtained from Herschel maps corrected with the constant–offset method alone. The data processed in this work are publicly available.
This paper is organized as follows. We describe the data used in Sect. 2. In Sect. 3 we describe our Fourier technique and its application to the Herschel and Planck data. In Sect. 4 we show the flux maps obtained with our methodology and post–process these to obtain column density (NH) and temperature (T) maps. In Sect. 5 we compare our results with previous methods, testing the performance of our method with simulated data in Sect. 6. We present our conclusions in Sect. 7.
| Name | Obs ID | RA (J2000) | DE (J2000) | Map size | Project | Ref |
|---|---|---|---|---|---|---|
| [hh:mm:ss] | [::] | [] | ||||
| Perseus-04 | 1342190326 | 03:29:39 | +30:54:34 | KPGT_ pandre_ 1 | 1 , 2 | |
| HiGal-11 | 1342218966 | 18:09:50 | -19:25:22 | KPOT_ smolinar_ 1 | 5 |
2 Data
In this paper we use public Herschel (Pilbratt et al., 2010) and Planck (Planck Collaboration et al., 2014c) archive data.
2.1 Herschel data
The Herschel data used in this paper were retrieved from the Herschel science archive. We select parallel mode observations carried out with the PACS (Poglitsch et al., 2010) and SPIRE (Griffin et al., 2010) photometers. We use the level 2.5 data products. These data products are optimized for extended emission reconstruction as well as the principle observing mode used for large-scale surveys (i.e., the parallel mode). We therefore focus exclusively on these products in this paper. We use the red (160 m) channel of PACS, and the three wavelengths of SPIRE (250 m, 350 m, and 500 m). These maps have native pixel scales (and beam sizes) of 3.2 (11.8), 6 (18.2), 10 (24.9) and 14 (36.3) respectively. We refer the reader to Table LABEL:tab:obs for further details.
2.2 Planck all-sky foreground dust emission model
The Planck satellite has observed the entire sky at nine different frequencies in the range 30 – 857 GHz (Planck Collaboration et al., 2014c). Since Herschel and Planck instruments do not have similar wavelength coverage, we need to convert the Planck observations into maps directly comparable to Herschel. One of the data products of the Planck mission is an all-sky model of the foreground dust emission, obtained from a modified blackbody (MBB) fit to Planck observations at 353, 545, and 857 GHz, complemented with IRAS 100 m (Beichman et al., 1988) observations (Planck Collaboration et al., 2014a, 2016). This model estimates the dust optical depth, temperature, and spectral index with a resolution of 5 (30 for the spectral index, ). The results of this model should be used only within the frequency range 353–3000 GHz. At shorter wavelengths the dust emission is known to contain a non-thermal component due to stochastically heated grains (e.g. Draine & Li, 2007; Draine, 2011; Planck Collaboration et al., 2014a; Meisner & Finkbeiner, 2015).
We use the Planck all-sky foreground dust emission model to reconstruct a FIR spectral energy distribution (SED) at the observed Herschel wavelengths. This model provides the optical depth at GHz (), the dust temperature (), and the dust spectral index () for each sky pixel based on a MBB fit to the observed fluxes. We obtain the SED following the Planck analysis via
| (1) |
where is the intensity at each frequency, and is the blackbody function at the observed temperature. We convert these SEDs into Herschel simulated observations, integrating them over the respective Herschel filter response functions for extended sources. The Herschel pipeline assumes a flat calibration within each bandpass. We therefore obtain the monochromatic Planck fluxes () as follows:
| (2) |
where is the intensity obtained in Eq. 1, is the spectral response function for each Herschel bandpass, and the effective central frequency of each bandpass (Robitaille et al., 2007). We repeat this step for each pixel of the Planck all-sky dust emission model, obtaining four maps of simulated emission at the targeted Herschel wavelengths. These maps are initially extracted from the Planck healpix data format at a 75″pixel scale. In a later step these images are regrided and rotated to the reference frame of the Herschel images at their respective wavelengths (pixel scales for Herschel data are listed above). For simplicity, we refer to this data cube as the Planck data cube in the reminder of the paper.
For completeness, we investigate how the uncertainties of the parameters , , and propagate into our simulated flux maps. To estimate the effect of uncertainties we use the standard deviations of , , and derived for the whole sky, which are respectively 8%, 8%, and 10% (Planck Collaboration et al., 2014a). We apply these values to a MBB function independently and estimate how much the flux varies at the four wavelengths of interest. In Table LABEL:tab:unc we show the results for the representative fiducial MBB parameters , , and . At every wavelength, the temperature uncertainties dominate on our simulated maps, with the effects being larger at shorter wavelengths. The flux errors caused by the dust spectral index and optical depth uncertainties are within calibration errors of the instruments.

| [m] | |||
|---|---|---|---|
| 160 | 42% | 5% | 10% |
| 250 | 29% | 4% | 10% |
| 350 | 22% | 4% | 10% |
| 500 | 15% | 3% | 10% |
Uncertainties in the model fluxes for fiducial MBB parameters of , , and .
2.3 Initial image processing
In the main step of this method (see below Sect. 3) we combine the Planck and Herschel datasets obtained above in Fourier space (see Sect. 3.2). Fourier Transforms (FTs) are sensitive to any spatial patterns in the maps. As we show in Fig. 1, the original Herschel maps have two main spatial patterns: a “saw” effect in the field edges, and a zero–padding outside of the observed region. Before applying our method, we rotate and crop the Herschel maps in order to avoid possible contamination of the FT amplitudes from the zero padding and the saw edges. Unfortunately, the general field geometry of Herschel data is not well described by a rectangular field. We therefore must find the best combination possible between removing zero-padding and saw effects and keeping the largest image area as possible. The Herschel/SPIRE and Herschel/PACS observations in parallel mode have an intrinsic pointing offset222 See Herschel handbook for further details.. We therefore treat both instruments separately and define different effective regions for each instrument. The following steps are applied to the image products of this initial processing. We address possible effects of these initial processing steps in Sect. 6.
3 Method and implementation
The main goal of this paper is to derive Planck–based multi–scale corrections for the Herschel images at each observed wavelength. Here we combine two single-dish datasets: one with much better resolution (Herschel) than the other (Planck). Therefore, we can make a loose analogy to previous interferometric techniques (e.g., Thompson et al., 1986; Stanimirovic, 2002) aimed at combining data sets that are observed at significantly different angular resolutions. Here Herschel would represent the interferometer data while Planck would represent the lower resolution single-dish data. Furthermore, our method is similar to previous methods combining single dish observations, e.g., Planck and ATLASGAL (Csengeri et al., 2016).
3.1 Cross–calibration and combination of the datasets
Before combining images it is crucial that both have the same or similar flux scales. This step ensures no sharp jumps in intensities that may cause artifacts when combining the data in Fourier space. Due to the linearity of the Fourier transform, the cross–calibration can be done either in the image– or in the uv–plane, where both methods are mathematically equivalent. The procedure to cross–calibrate Planck and Herschel in the image plane consists of applying a linear fit to the Herschel and Planck datasets and apply the constant to the Herschel data (e.g., Bernard et al., 2010; Lombardi et al., 2014; Zari et al., 2016). This is equivalent to correcting the Herschel dataset using only the zeroth Fourier mode. As above, we refer to this image plane correction as the “constant–offset” technique. If a constant–offset would be the only difference between both datasets, this correction would be sufficient. This method has already been applied to the SPIRE data products in the Herschel Science Archive (see above).
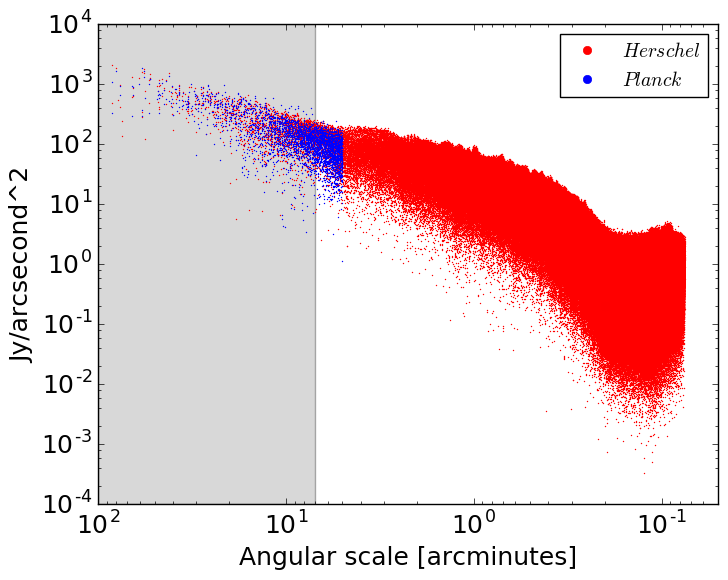
Alternatively, here we take advantage of the overlap of the Herschel and Planck datasets in Fourier space and cross–calibrate the data by comparing their relative Fourier amplitudes in the uv–plane. First, we re–grid the Planck data (75/pixel) to the corresponding Herschel pixel scale. We then Fourier transform both datasets. To be able to compare them, we must convolve the Planck visibilities with the Herschel beam. This convolution is achieved in two steps: i) by first deconvolving the Planck visibilities i.e., dividing them by the Planck beam, assumed to have a FWHM ; ii) convolving (multiplying) the resulting visibilities with the corresponding Herschel beam profile. Note that the convolution of the Planck visibilities implies dividing by an exponential function that approaches zero at small scales, exponentially increasing the noise of the Planck data at small scales. However, we are only interested in the large scales where the noise is not significantly amplified by the beam deconvolution.
The Herschel and Planck visibilities are shown in Figure 2. We compare their visibilities at scales on which the signal–to–noise ratio of both datasets is high enough to obtain the calibration factor to be applied. The high signal–to–noise ratio requirement limits us to compare the visibilities at scales larger than the 5 resolution of Planck. In order to be conservative and avoid the noise contamination generated by the deconvolution of the Planck data, we will define the smallest scale at which we compare the Planck at Herschel visibilities at 7. At these scales, the noise of the deconvolved Planck data is comparable to that of the Herschel data (see Fig. 2). Table LABEL:tab:crossCal shows the cross–calibration factors for each map and wavelength, obtained as the mean of the ratio between the Herschel and Planck visibilities in the shaded region of Fig. 2. The cross–calibration factors are within 20% for every region and wavelength. With both datasets in the same flux scale we can now combine them.
3.2 Combining Planck and Herschel in the Fourier space
In the last step we combine the Planck and Herschel cross–calibrated datasets. We generate the Fourier transforms of the Herschel () and Planck () data and linearly combine them, weighted by their correspondent uv–scale () dependent functions and , thus obtaining the FT of the combined image, :
| (3) |
where is the after being cross–calibrated with Herschel.
Alternatives to the classical interferometric feathering technique that use weighting or interpolation functions different from the beam profiles have been successfully applied when combining single dish data (e.g., Butterworth function by Csengeri et al., 2016). This can be done because of the continuous coverage of the uv–plane by single dish telescopes, which allows to combine the data at any of the overlapping scales, not limited to the telescope beams. In App. A we describe the interpolation function used in the implementation of our method.
We define as the angular scale at which we combine the two datasets. To define we use Eq. 3, to define a for each scale in the range [,). For each scale, we estimate the residuals between the new combined visibilities () and the original Planck and Herschel visibilities, defining as the scale at which the residuals are minimized. We require that , larger than than the Planck beam. The zeroth Fourier mode equivalent to the constant–offset correction occurs at . Our method is therefore a generalization to correct the flux scales of Herschel, with the constant–offset correction arising naturally as a special case of it when . Table LABEL:tab:kappa-eff we list the values for each region and wavelength.
The very last step of our method is straightforward. We inverse Fourier transform the combined visibilities and the modulus of the resulting product will be our final combined image.
| Region | Wavelength | [ m ] | ||
|---|---|---|---|---|
| 160 | 250 | 350 | 500 | |
| HiGal–11 | 1.170.37 | 1.140.33 | 1.110.34 | 1.020.34 |
| Per–04 | 1.190.32 | 1.140.30 | 1.080.31 | 1.040.30 |




| Region | Wavelength | [ m ] | ||
|---|---|---|---|---|
| 160 | 250 | 350 | 500 | |
| HiGal–11 | 29.3 | 23.4 | 25.7 | 35.1 |
| Perseus–04 | 23.4 | 36.2 | 15.1 | 15.1 |
4 Results
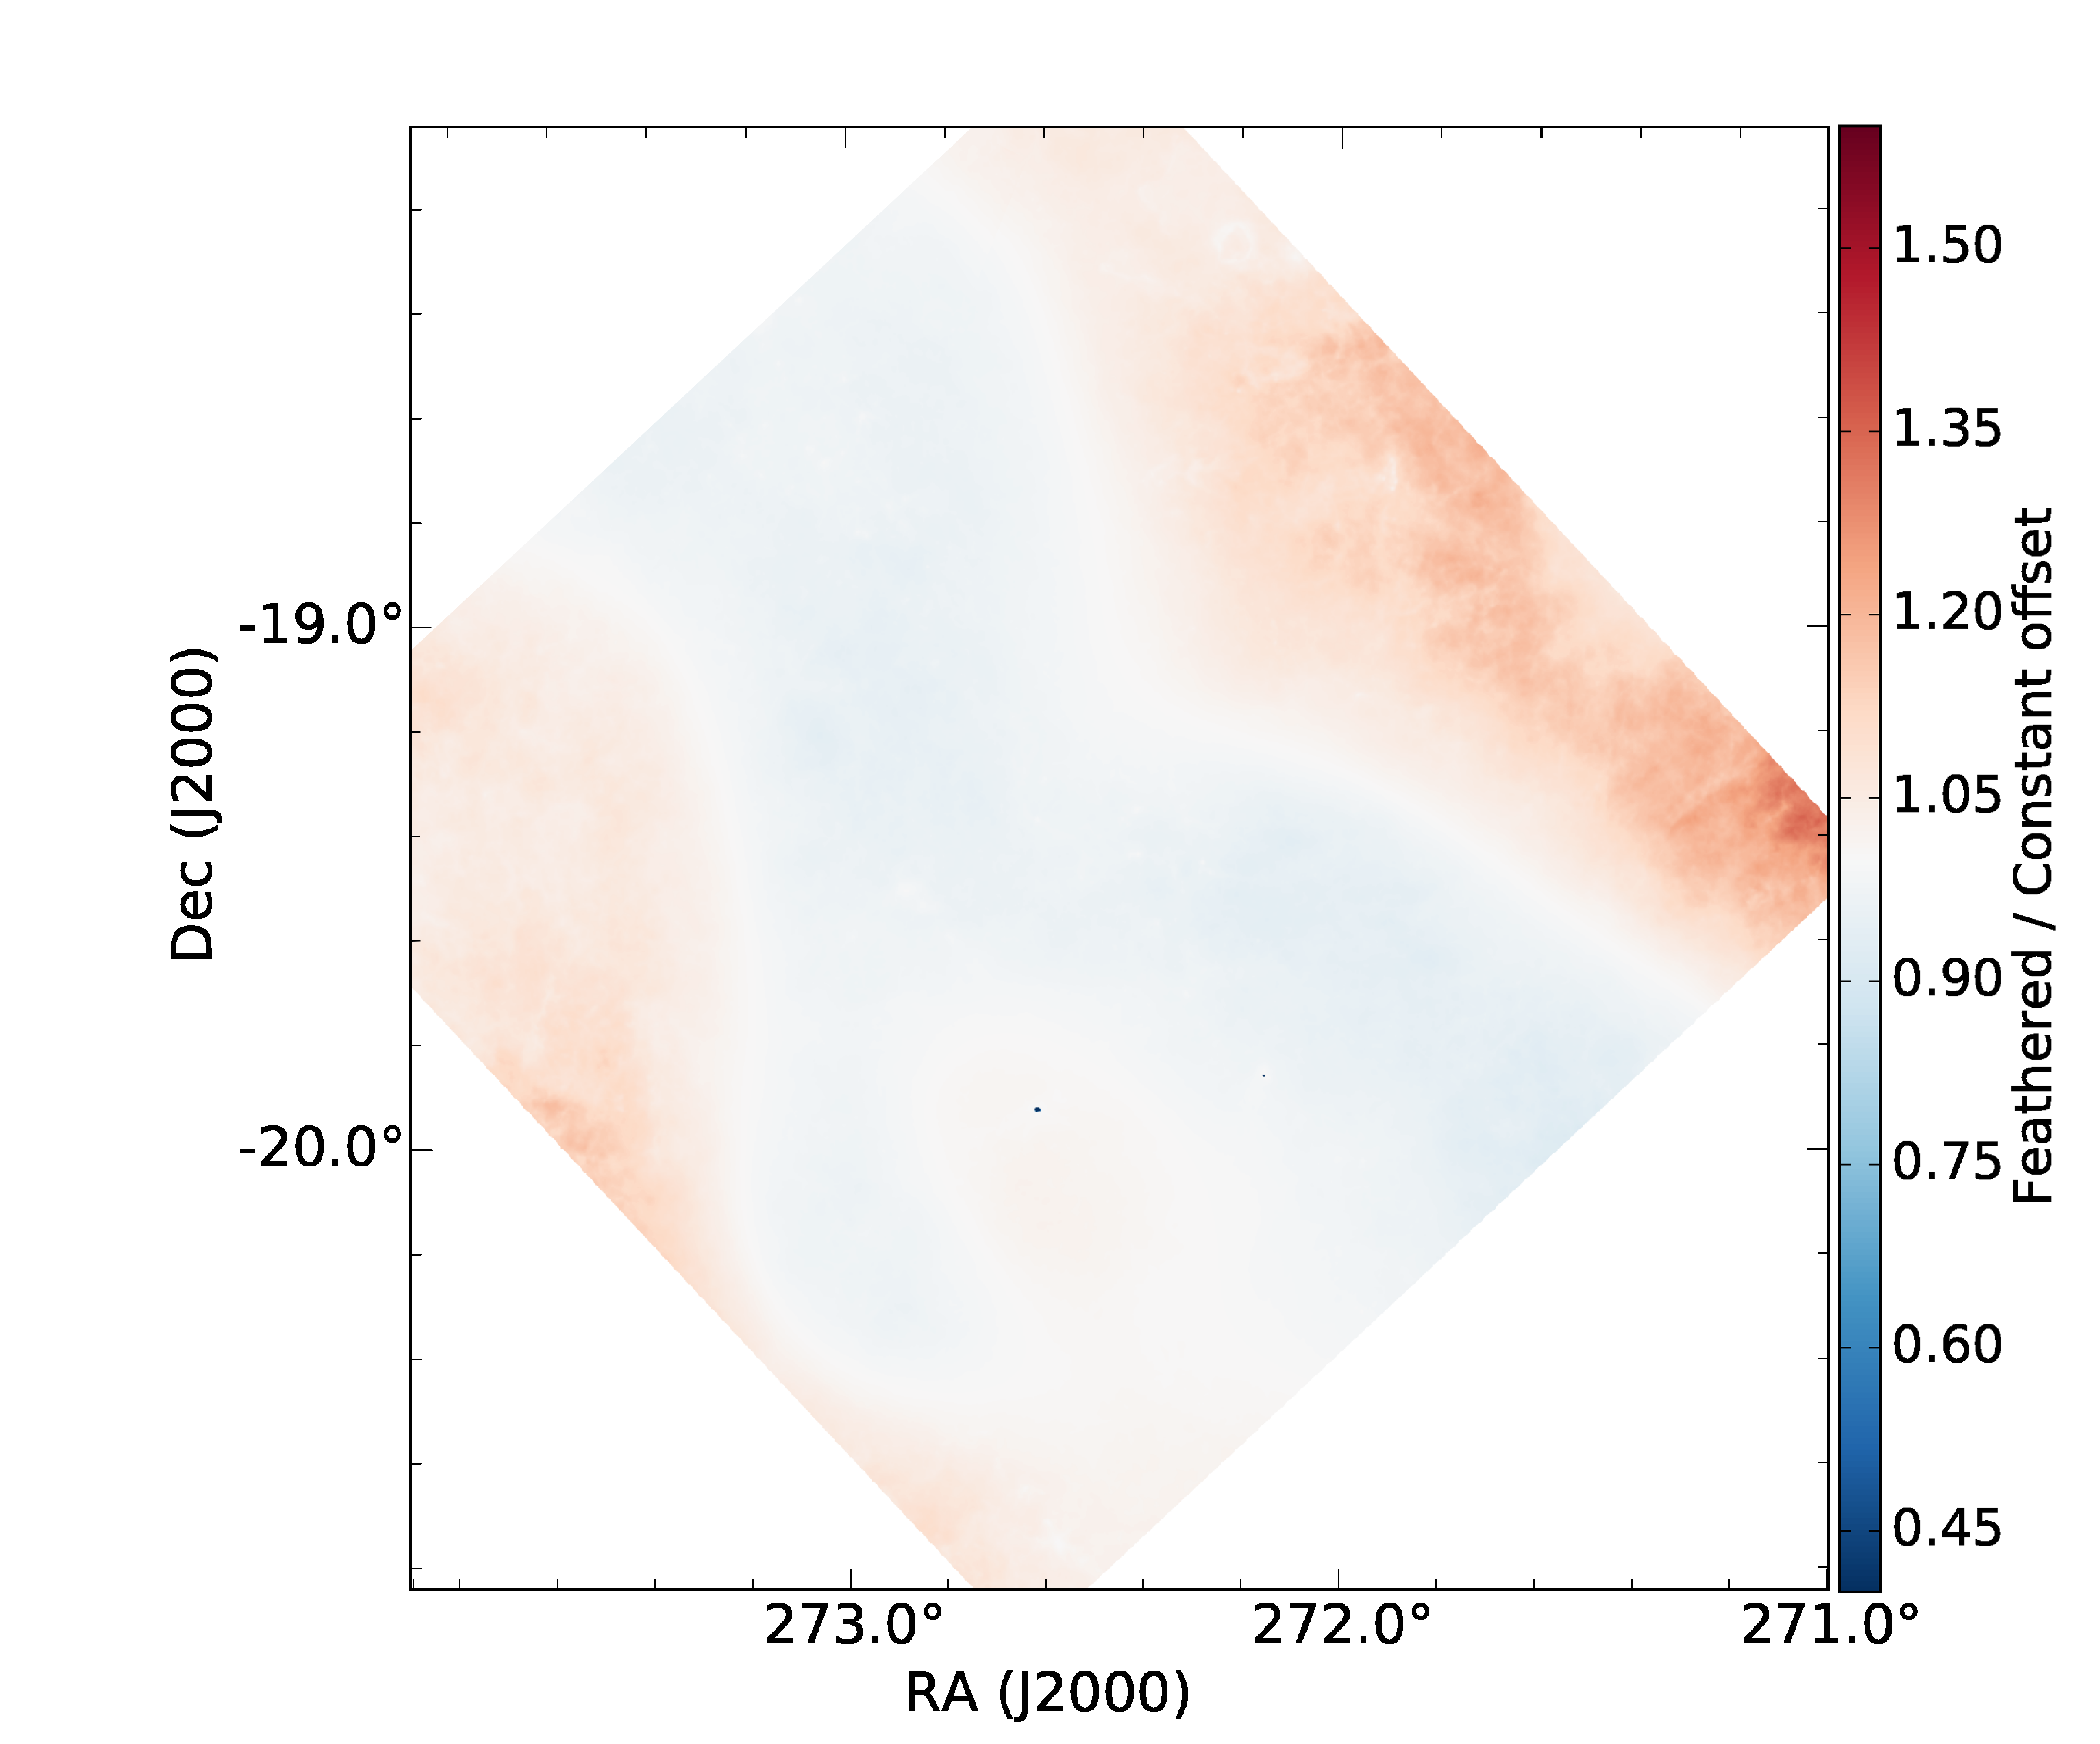
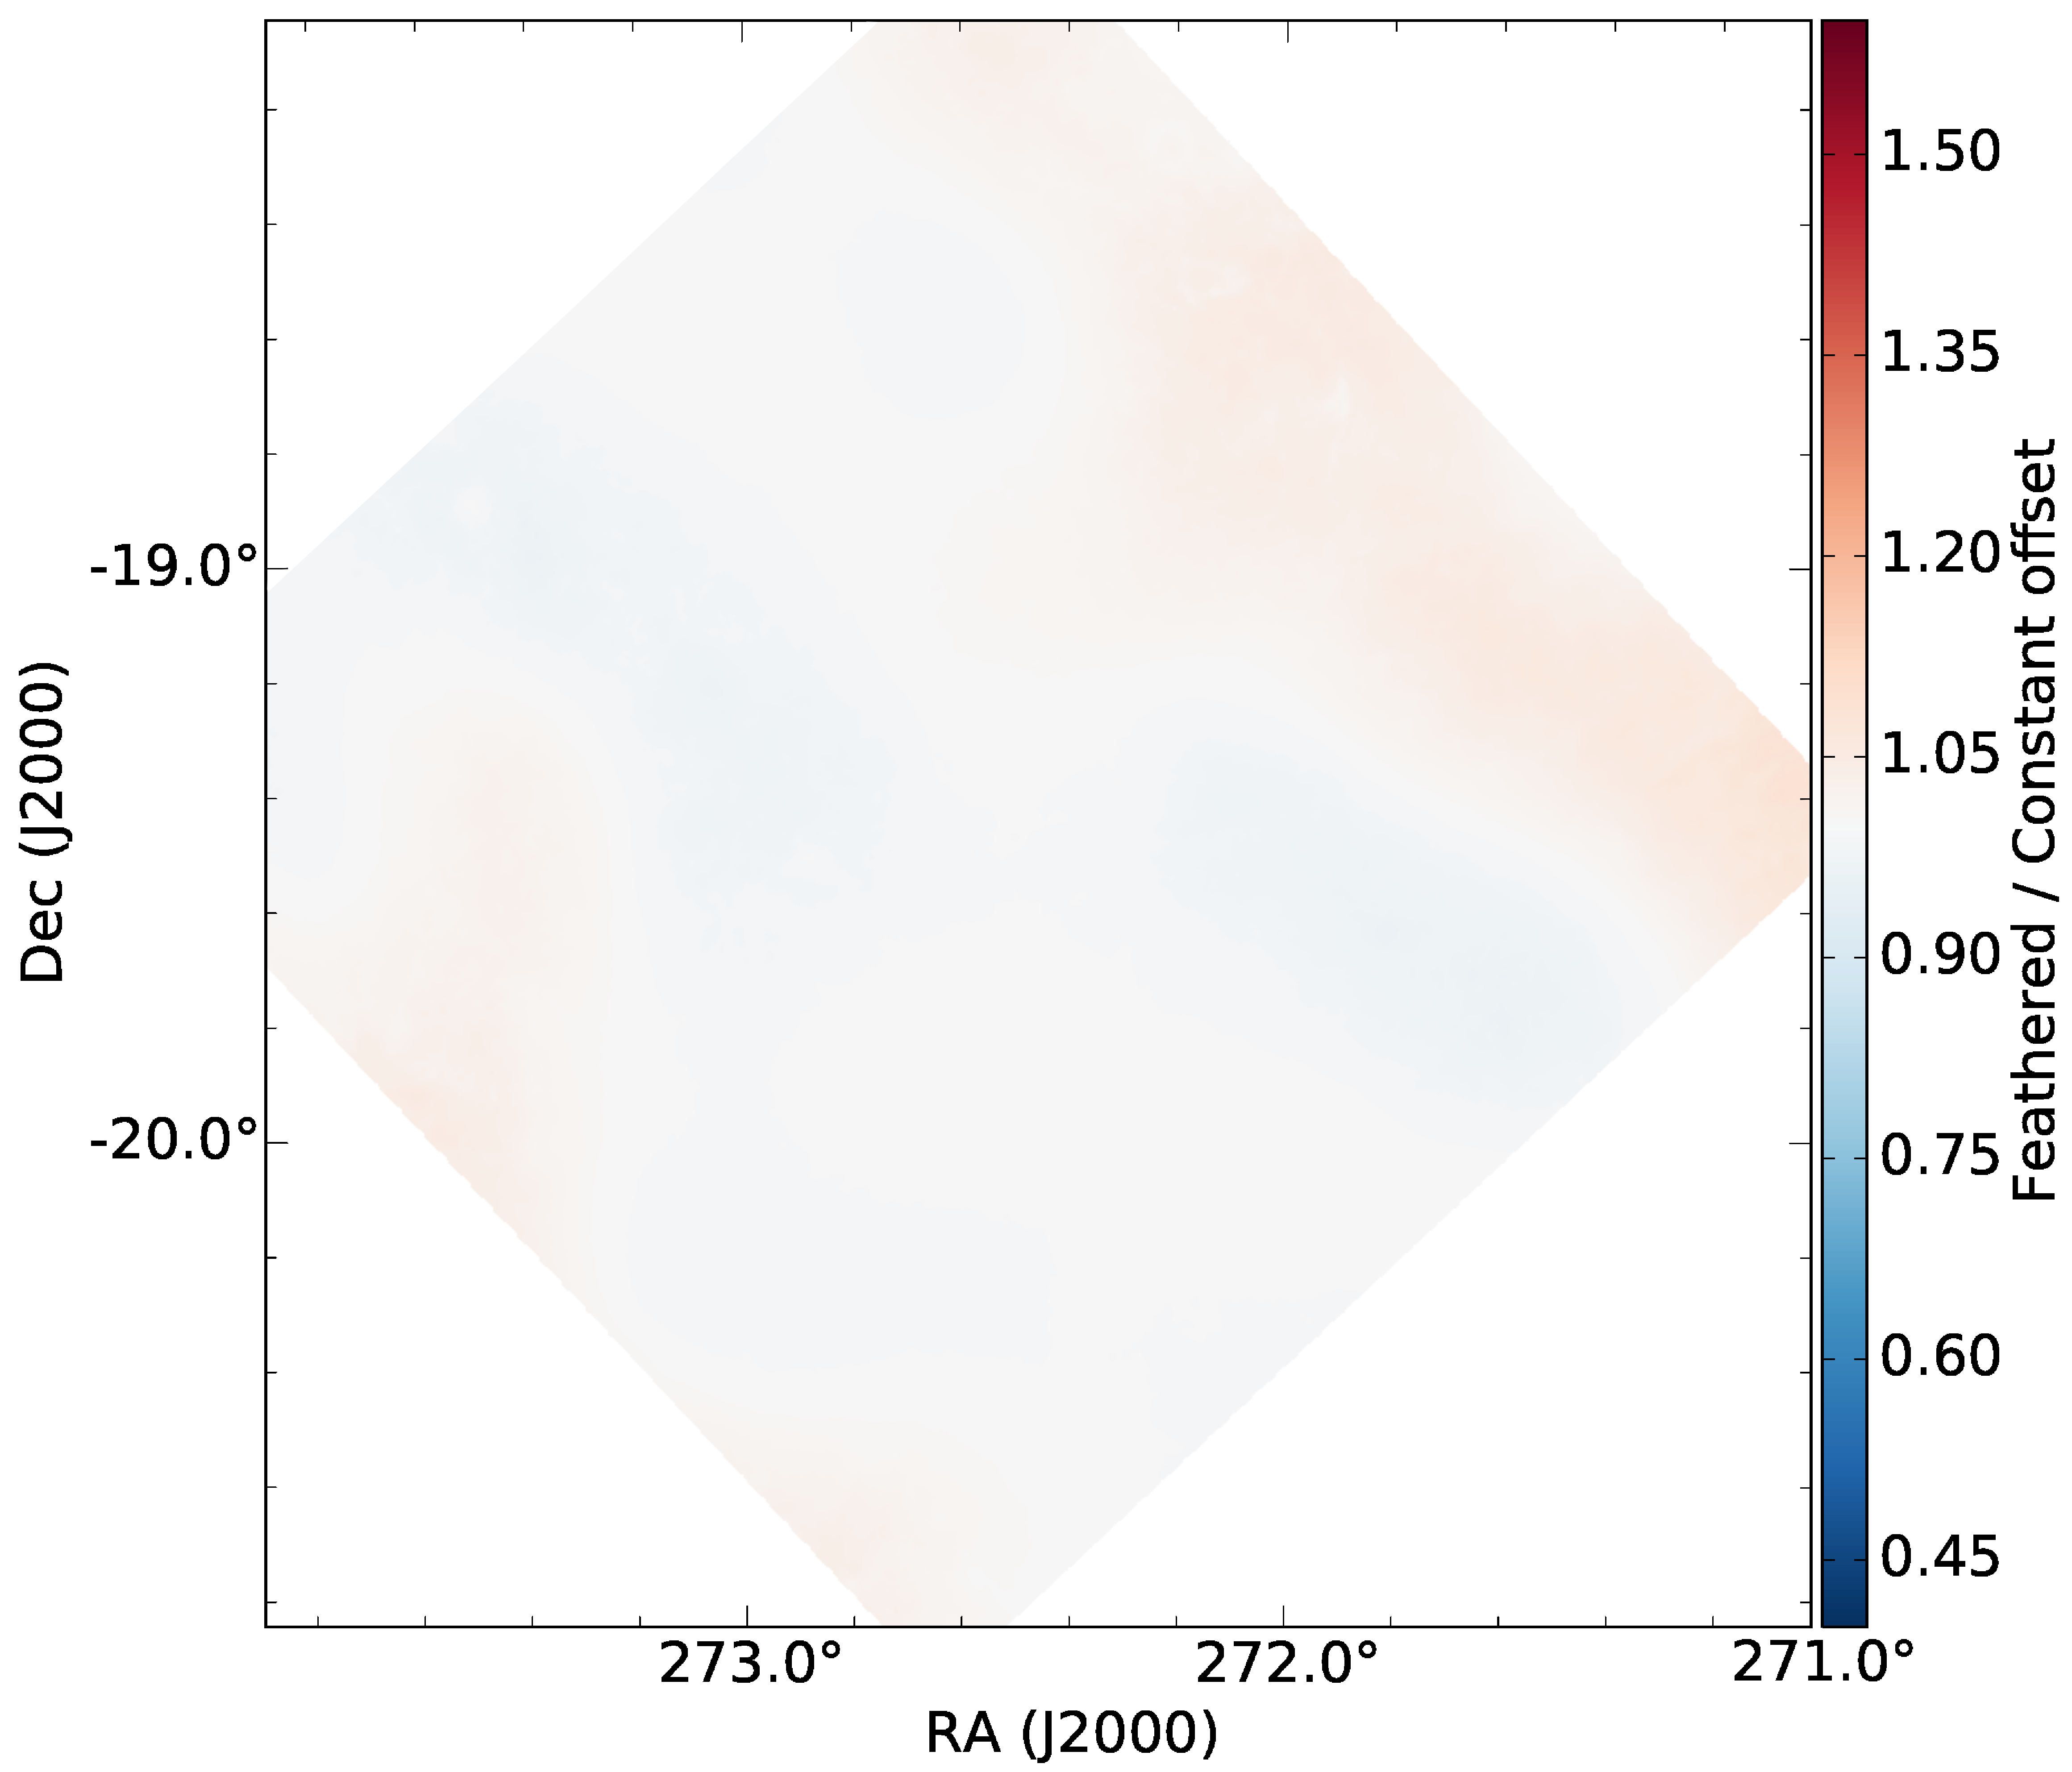
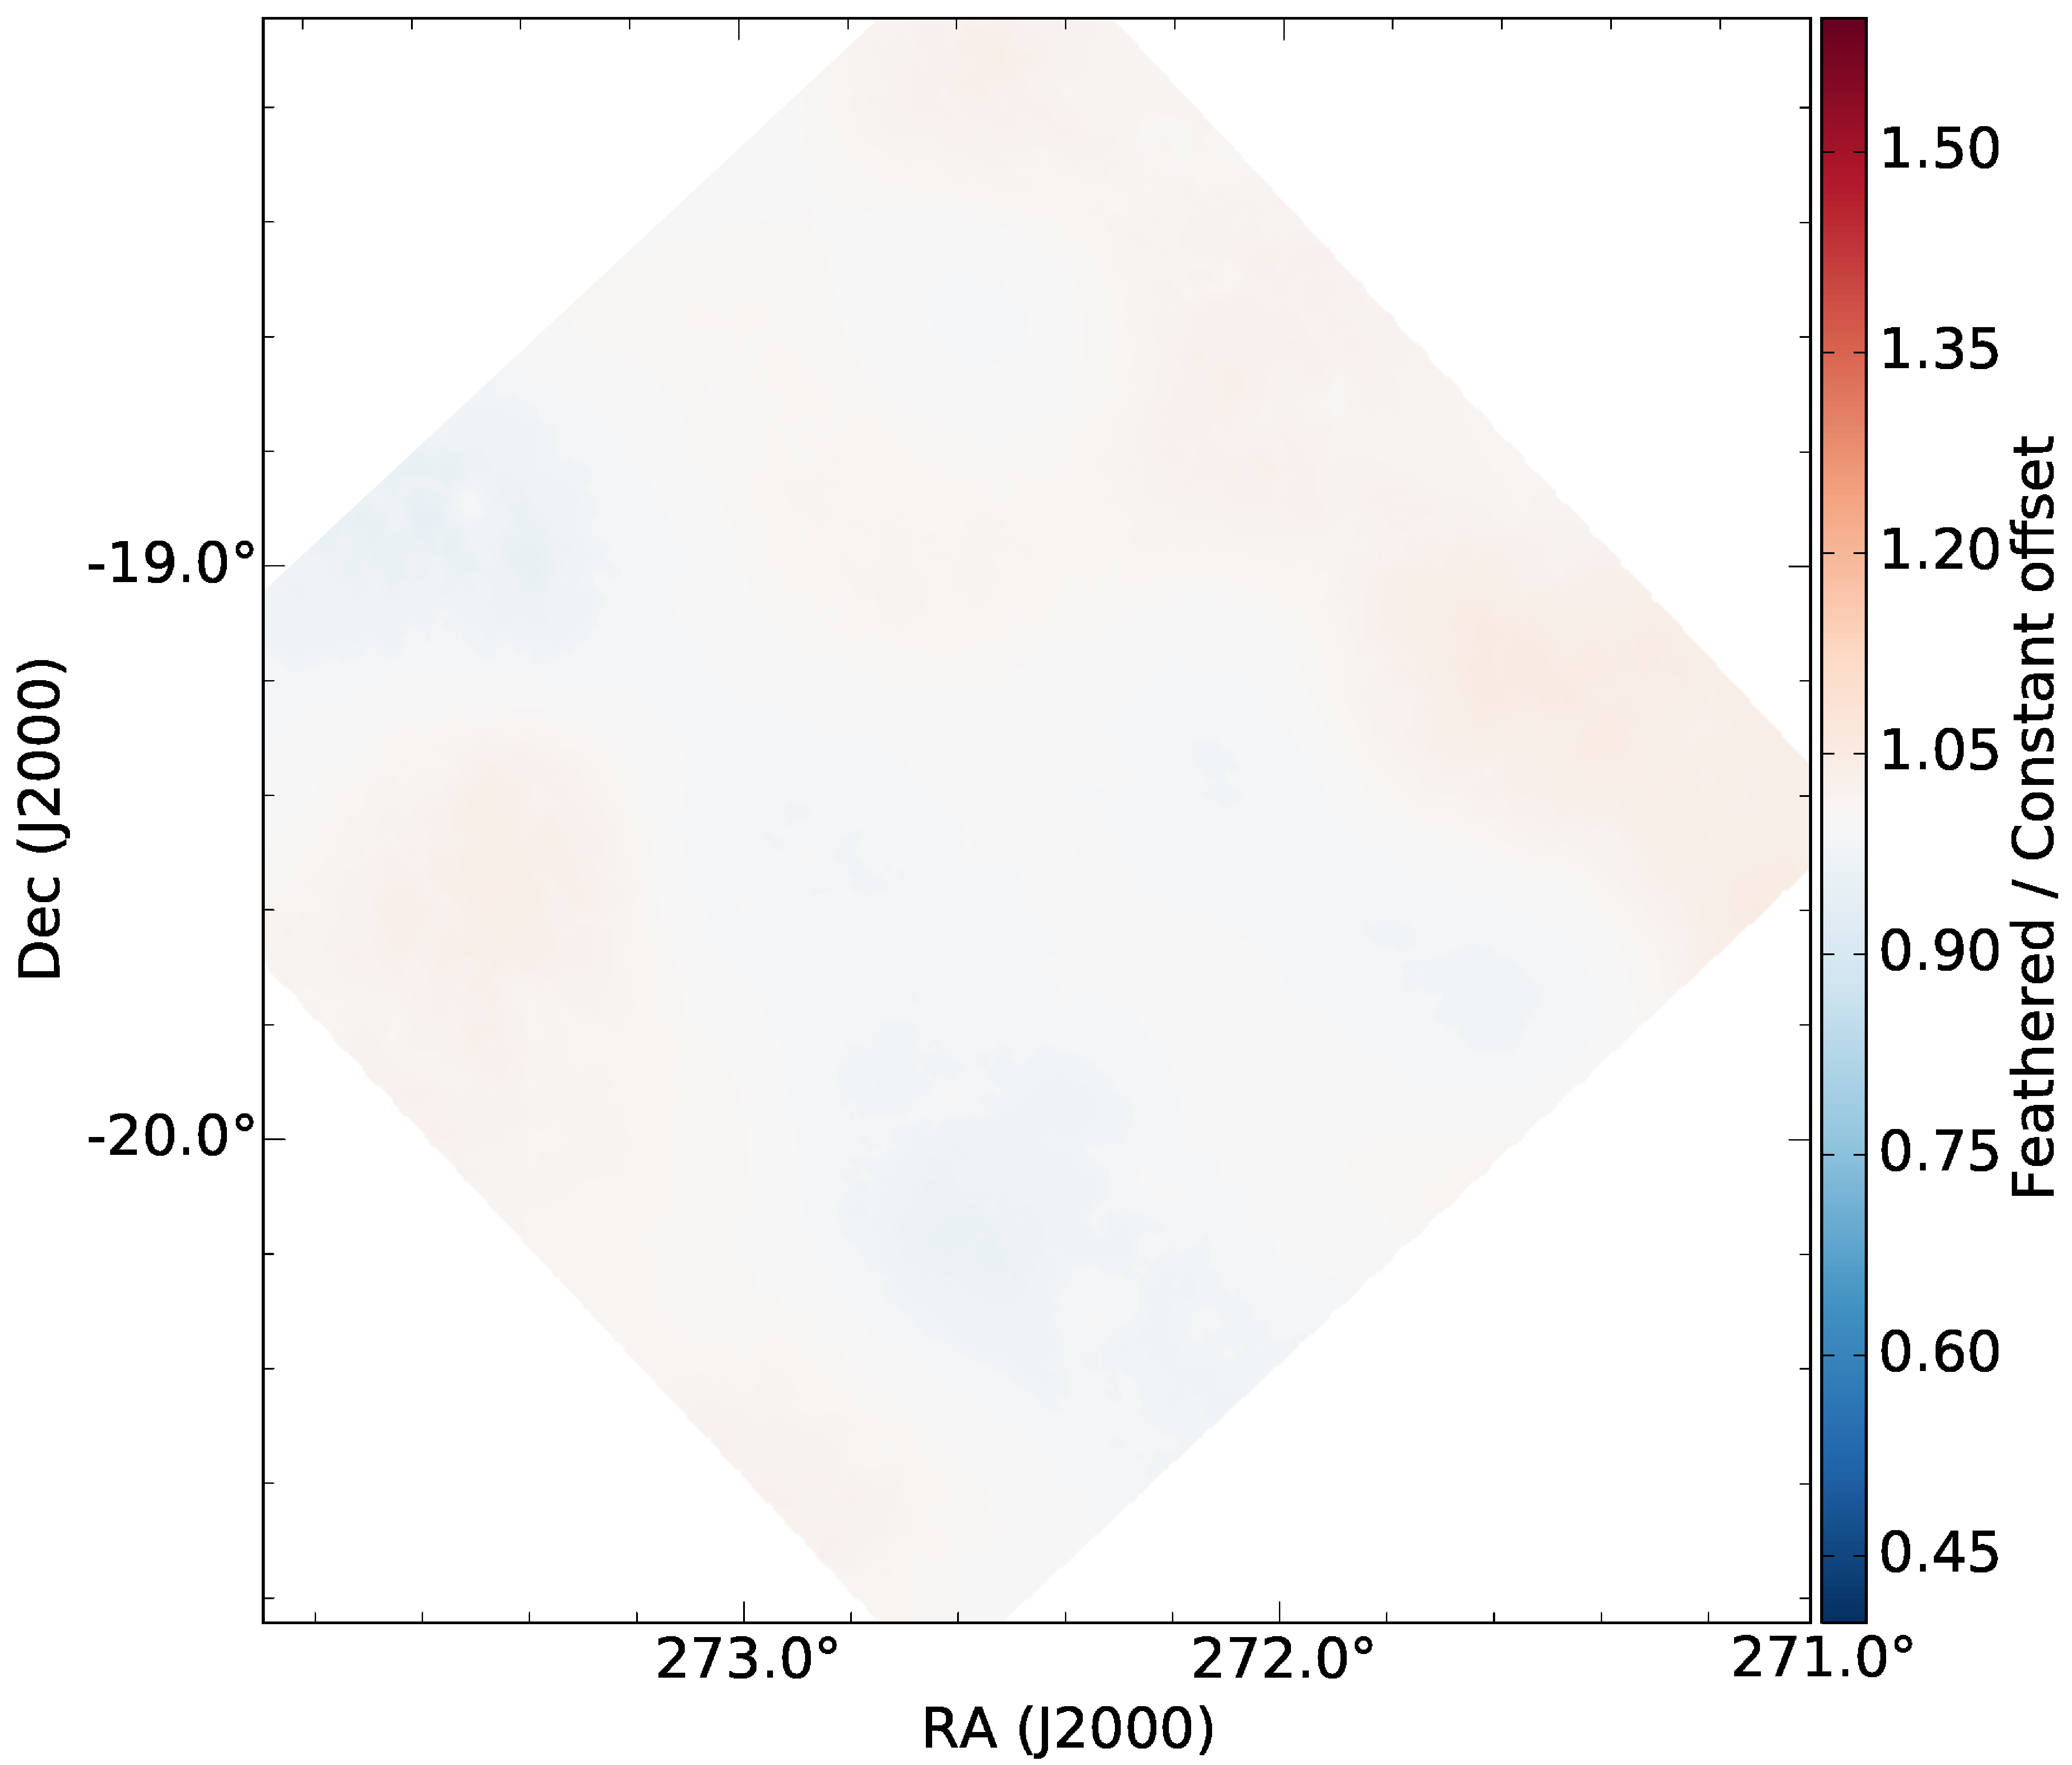
Following the procedure explained in Sect. 3 we obtained the combined flux maps for each region and wavelength. In the remainder, we will refer to these maps as “feathered”. We show in the top row of Fig. 3 the feathered map of HiGal–11 at 160 m on the left side and its comparison to the constant–offset corrected map on the right side. In the bottom line we show the comparison, for the same field, of the feathered and constant–offset corrected maps for 250 m, 350 m, and 500 m respectively. It is clear from the images that the corrections are much more significant in for PACS (160 m), than for the SPIRE data. We describe this result deeper in Sect. 5.1. In Fig. 4 we show the “feathered” 160 m map of Perseus (left) and its comparison to the constant–offset corrected map (right). For simplicity, we only show the 160 m case because, as in HiGal–11, it shows the most significant differences between the “feathered” and constant–offset maps. We note that the existence of strong Planck emitting sources in regions just outside the Herschel mapping area could in some cases introduce artifacts near the edge of the maps. Unfortunately, such effects would be completely random, depending exclusively on the relative orientation between the sources and the Herschel maps. It is beyond the scope of this paper creating a model to quantify these effects.
We further post–processed the feathered flux maps following the procedure in App. B to obtain the feathered column density and temperature maps. The feathered column density map of HiGal–11 (Perseus) is shown in the top left panel of Fig. 5 (Fig. 7). The feathered temperatures of HiGal–11 (Perseus) are shown in the top left panel of Fig. 6 (Fig. 8).
| [ m ] | HiGal–11 | Perseus | ||
|---|---|---|---|---|
| Herschel | Planck | Herschel | Planck | |
| 160 | 1.7e-2 | 3.6e-2 | 2.2e-4 | 1.3e-3 |
| 250 | 2.3e-2 | 2.4e-2 | 1.2e-3 | 1.2e-3 |
| 350 | 1.1e-2 | 1.1e-2 | 7.5e-3 | 7.5e-3 |
| 500 | 3.9e-3 | 3.9e-3 | 3.2e-4 | 3.4e-4 |
5 Discussion
In this section we first compare our feathered flux maps with those obtained using the constant–offset correction. We then compare the feathered and constant–offset column densities and temperatures.
5.1 Feathered vs constant–offset flux maps
We now compare the our feathered flux maps with those obtained via the constant–offset correction applied in previous works (e.g., Bernard et al., 2010; Lombardi et al., 2014; Zari et al., 2016). In Fig. 3 we show the comparison between our feathered HiGal–11 flux maps and the constant–offset maps. The feathered image of HiGal–11 has more emission in the diffuse regions off of the Galactic plane, and the relative differences can exceed 40% (although the absolute differences are similar) over significant areas of the image. Contrary, the feathered image tends to show lower fluxes on the Galactic plane areas. The feathered and constant–offset images agree on compact objects. The map of Perseus exhibits a similar behavior to that of the HiGal–11 field, with the most strong emitting regions having similar fluxes in the feathered and constant–offset maps and the constant offset map over–estimating (under–) the flux at intermediate (low) fluxes (see Fig. 4). These results illustrate non–uniform and scale dependent nature of the signal at large scales, specially significant in the PACS data.
In the bottom row of Fig. 3 we show the comparison between the feathered and constant–offset flux maps for the same region for the SPIRE wavelengths. In general, the feathered and constant–offset agree within calibration errors at these wavelengths, as it can be seen in the predominantly white maps in the bottom row of Fig. 3. Only small parts of the 250 m image show significant differences between the feathered and constant–offset maps. This result agrees with Bertincourt et al. (2016) who study the large scale emission of SPIRE and Planck in several regions finding good agreement between both. For this reason, and to simplify the paper, we do not show the comparison between the feathered and constant–offset corrected maps for Perseus at the SPIRE wavelengths, since the results are similar to those already described.


5.2 Comparing column density and temperature maps to previous methods
We have shown in Sect. 5.1 that the Herschel data corrected with a constant–offset tend to underestimate the fluxes in diffuse regions compared to our flux feathered maps, while both agree well in regions with strong emission. These results are specially significant at 160 m. With these results we would expect that the temperatures in diffuse regions are underestimated by Herschel and therefore the column densities overestimated.
This is exactly what we find in HiGal–11 and Perseus, as it is shown in Fig. 5, Fig. 6, Fig. 7, and Fig. 8. In strong emitting (i.e. dense) regions, the feathered and constant–offset maps agree for both, temperatures and column densities. This is shown shown with the white regions in the ratio map, the similar high column density tails of the histograms, and the surface density points follow the identity at large column densities (and low temperatures). In HiGal–11 constant–offset maps do not measure column densities lower than 1022 cm-2. The inverse effect is seen in temperatures: the constant–offset temperatures below 20 K tend to be significantly lower than our feathered temperatures (see Fig. 6). The map shows discrepancies larger than 30% between both methods over of the area of HiGal–11. In the case of Perseus the temperature difference map shows that in general, the constant–offset and feathered temperatures agree within 2 K in Perseus. The differences in column densities are concentrated on the gas surrounding the NGC 1333 region. These differences account for more than 30% at intermediate (1022 cm-2) column densities.
These results highlight the importance of a proper treatment of the Herschel data, specially in diffuse regions, since the column densities are directly related with the mass of the dust, and therefore the total mass of the molecular clouds, intimately linked to key physical parameters as the gravitational potential.
6 Testing our method on simulations
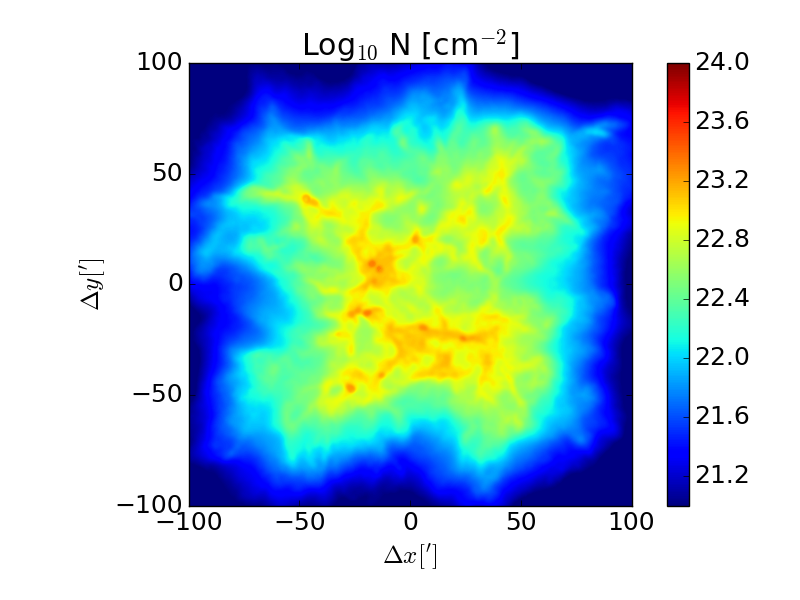
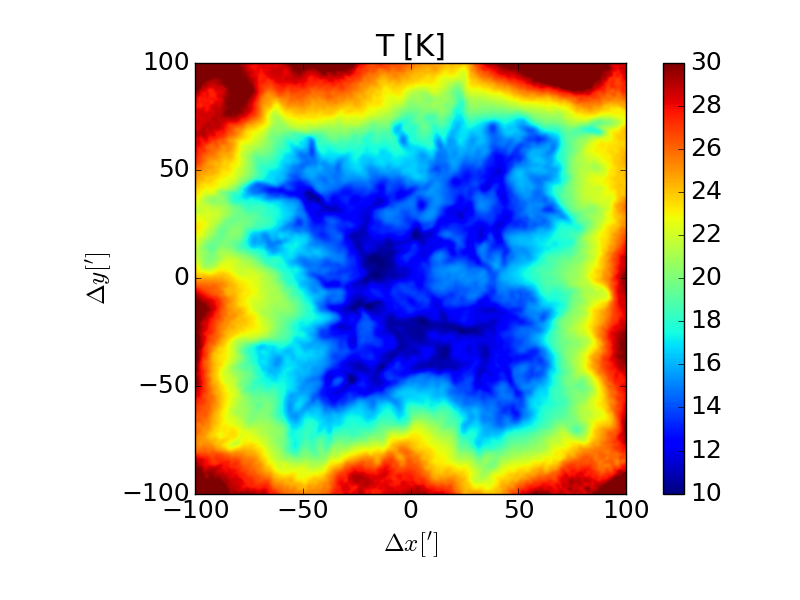
We now test the performance of our method on a simulated molecular cloud, for which the actual column density and temperature distributions are known. We used the Smooth Particle Hydrodyncamics SPH code Gadget 2, with 24 million particles, starting from a uniform density field and turbulent, random initial velocity fluctuation with a rms mach number . For simplicity and speed of the calculations, our simulation was isothermal. However, we assumed a polytropic equation of state to produce a mean temperature map. The internal temperature of the cloud was, thus, given by
| (4) |
where is density and with and if cm-3, and and if cm-3. Such dependency is meant to be representative of the temperature of MCs, which external parts are heated by the diffuse UV radiation of the ISM, while their densest parts start becoming optically thick, the cooling become less efficient, and thus the gas and dust grains become coupled (see, e.g. Jappsen et al., 2005).
To test our method, we need to construct column density and temperature maps with sizes of at least pixels. For this purpose, we computed the total mass and the mean temperature of the SPH particles along each area element. Note that this was performed without taking into account the smoothing length in the simulations. Since 24 million particles distributed over 20482 pixels give a mean of 6 particles per beam, it is clear that, without considering the smoothing length, the map will contain a large amount of small structure noise. By not applying the smoothing length we verify that our algorithm is able to recover structure even in maps containing significant small-scale structure variation. The resulting maps are displayed in the top left panels of Fig. 9 and Fig. 10.
In order to test our method on the simulated clouds we must generate the same data products retrieved from the Herschel and Planck archives. Here we explain the processing steps applied to obtain our Planck and Herschel simulated maps:
-
0.
Rotate the maps: To obtain the most realistic possible test of our method we first rotated the simulated molecular cloud maps 45 degrees. With this step we test possible effects introduced when we crop and rotate the real maps in the first step of our method.
-
1.
Obtaining Planck and Herschel emission maps: With our simulated maps and, for simplicity, assuming a constant dust spectral index, =1.8, consistent with Ossenkopf & Henning (1994), we use Eq. 1 and Eq. 2 to obtain the ideal observations of our simulated clouds for Herschel and Planck, each at their own wavelengths (Sect. 2.1 and Sect. 2.2).
-
2.
Adding realistic noise to the emission maps: The emission maps obtained in step 1 are highly idealized. We therefore add realistic noise to our ideal Planck and Herschel emission maps to test our method under more realistic conditions. We estimate the noise of Planck and Herschel in the Fourier space using the actual HiGal–11 maps for this purpose. We assume that the Fourier amplitudes of Planck and Herschel have two main components: the signal, encoded in the Fourier amplitudes at any given scale, and the noise, which causes scatter in the signal at any given scale. This noise includes observational and “artificial” effects (e.g., gradients) created by image processing pipelines. We use the rms of the Fourier amplitudes to estimate the Herschel and Planck noise. We then convolve this noise with our ideal emission maps. With this method, we include in our simulation artificial effects in Herschel and Planck data (e.g., saturation of the IRAS data in the Planck dust model, artificial gradients in Herschel).
-
3.
Obtaining more realistic data products from the Planck all-sky model of dust emission: As explained in Sect. 2.2, the Planck all sky model of dust emission provides three data products: temperature, optical depth, and dust spectral index. To test our model we used the realistic Planck emission maps obtained in step 2 to generate our temperature, optical depth, and dust spectral index datasets. We use the same procedure followed in Planck Collaboration et al. (2014a). The Planck datasets obtained in this step will be the starting point to apply our method to the simulations.
-
4.
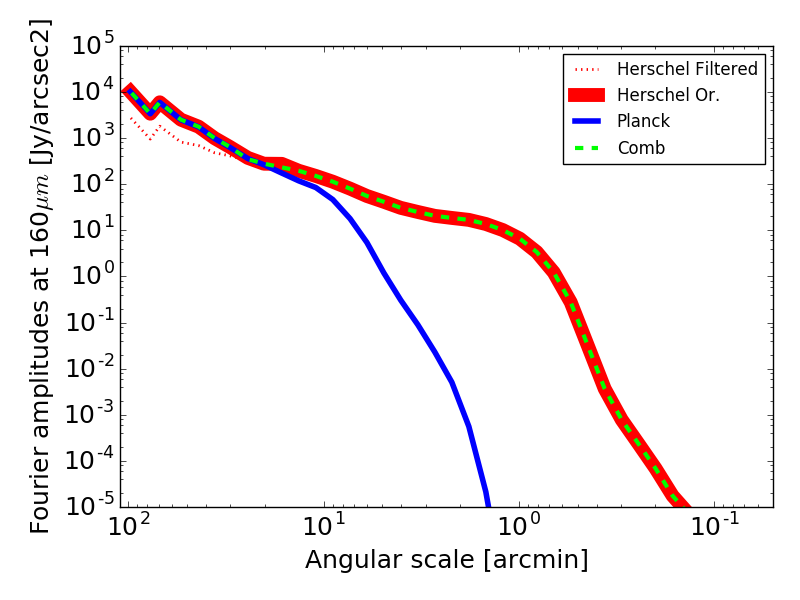
Filtering of the Herschel maps: The goal of our method is to correct the background emission of the Herschel maps applying multi-scale corrections derived from Planck. To test how our method recovers possible large scale variations measured by Planck, we artificially filter the Herschel maps at large scales. We illustrate this procedure, for the case of 160 m, in Fig. 11. This image shows the radial averaged Fourier amplitudes of our Planck and Herschel simulated maps (blue and red solid lines respectively). We then filter the Herschel data at scales larger than 30, resulting in the red dotted line shown in Fig. 11. The green dashed line in Fig. 11 shows the radial averaged Fourier amplitudes of the feathered image resulting of applying our method to the simulated datasets. Note that it follows nicely the red solid line of the original Herschel data, showing that our method achieves the goal of recovering filtered emission in Herschel.
We have now obtained the entire dataset needed to apply our method as it has been done in previous sections to the real data. We run our method as explained in Sect. 3 on the Herschel and Planck simulated datasets obtained in steps 4 and 3 respectively. As in previous sections, the application of our method generates constant–offset (the Herschel maps corrected only with the zeroth Fourier order) and feathered flux maps that we further process to obtain their column densities and temperatures following App. B.
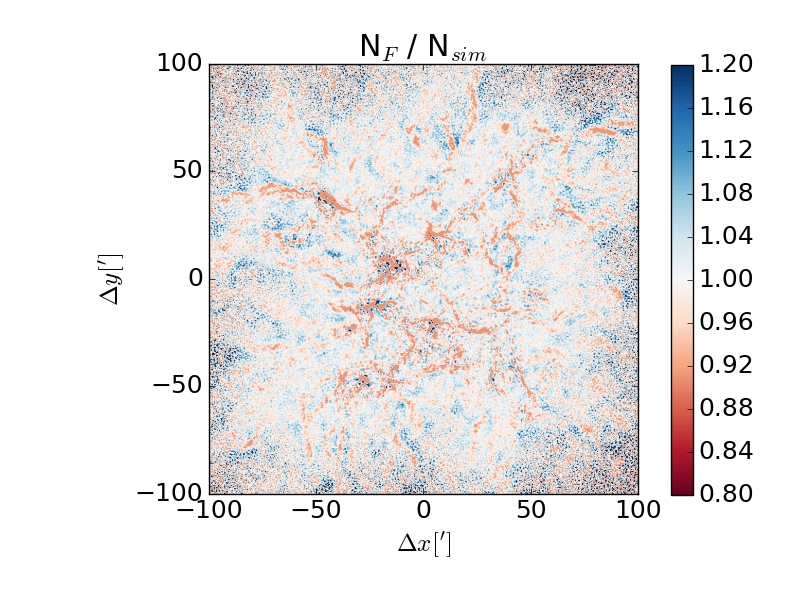
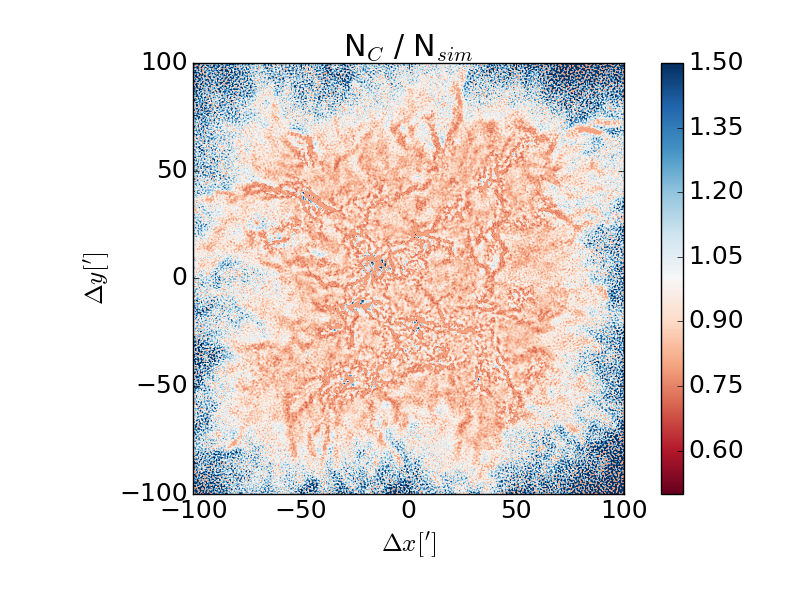
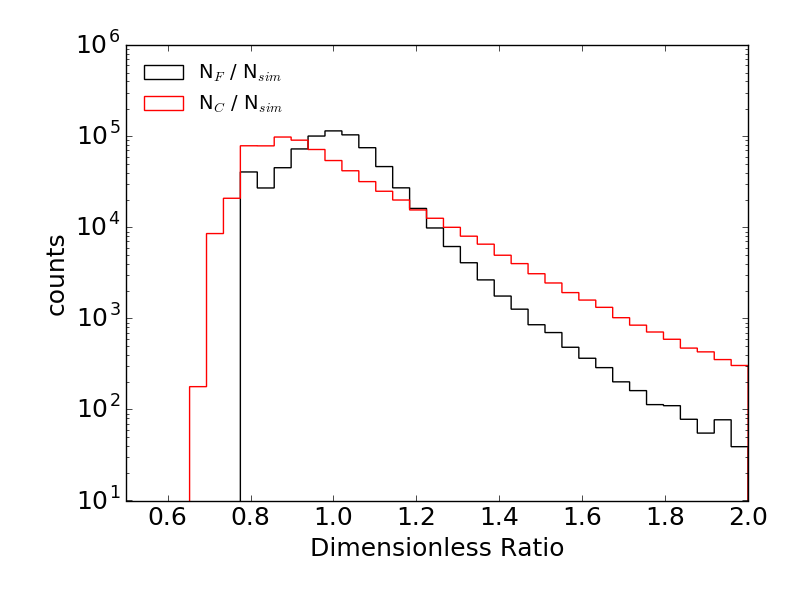
In the top left panel of Fig. 9 we show the column density map of our simulated molecular cloud. In the top right panel of Fig. 9 we compare our feathered column density distribution with that of the simulated cloud. The feathered and simulated column densities agree within 10% in general at large scales. In the densest regions ( cm-2) of the simulated cloud our method tends to systematically underestimate the column densities by values up to 15–20%. This effect is mainly caused by the simplifying assumption of a constant dust spectral index introduced in the step 1. We also note the absence of edge effects in our feathered maps, which demonstrates that cropping and rotating the maps do not generate artifacts in our maps. In the bottom left panel of Fig. 9 we show the comparison between the constant–offset and simulated column densities. These have some features in common with the behavior outlined above for the feathered case: systematically underestimated column densities in the densest parts of the cloud. Most importantly, the constant–offset maps show a bias towards column densities 10% lower than those of the simulated cloud. This is better seen in the histogram at bottom right panel of Fig. 9, that peaks at . In contrast, the histogram peaks at 1. Furthermore, the constant offset method is also more prone to overestimate column densities (specially in the low column density areas of the cloud) than our feathered maps, as shown by the wider distribution of its histogram, compared to that of our feathered maps.
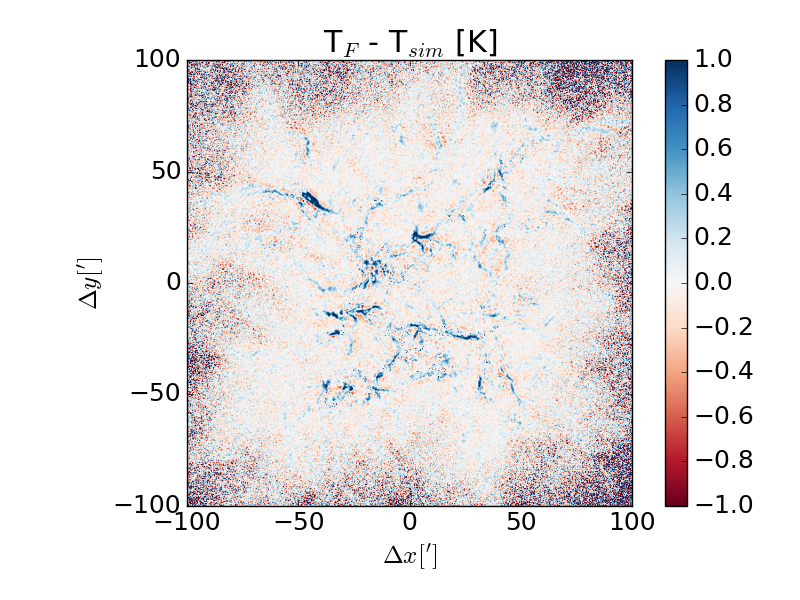
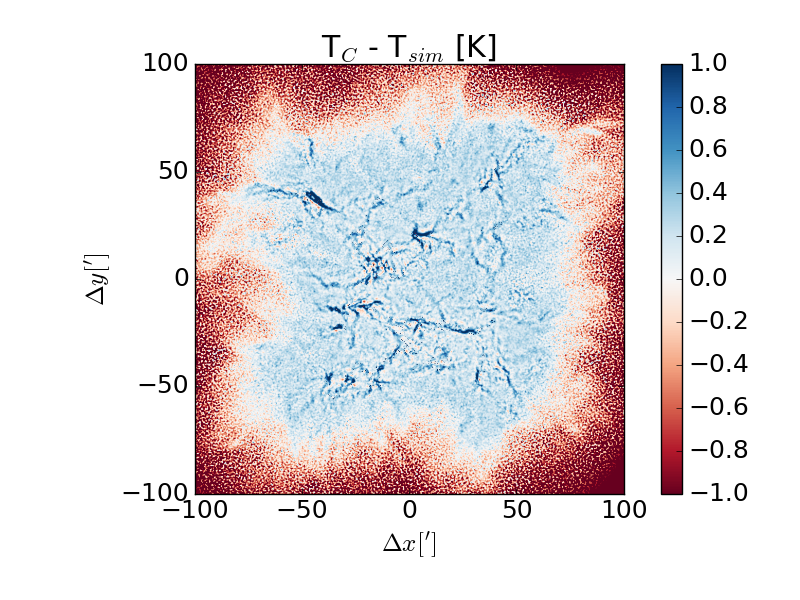
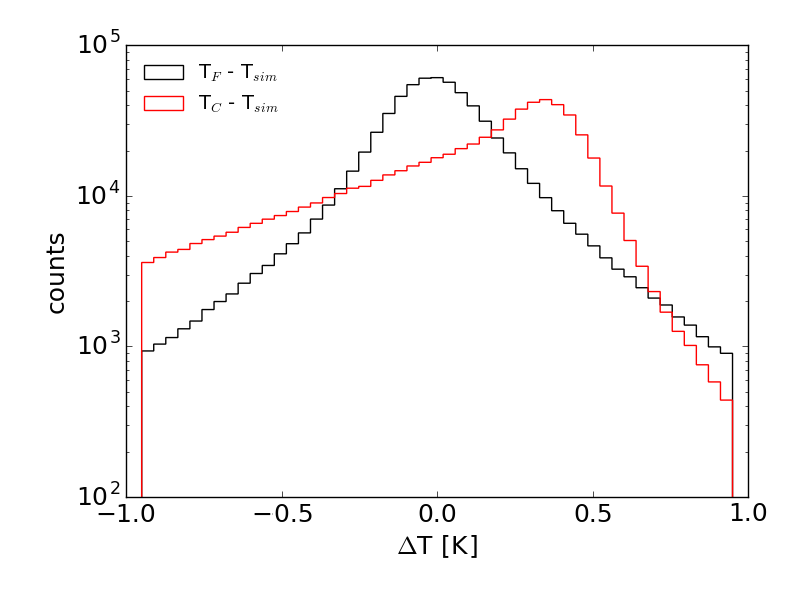
In Fig. 10 we compare the temperature results. In the top left panel of Fig. 10 we show the temperature distribution of the simulated cloud, which is compared to the feathered and constant–offset temperatures in the top right and bottom left panels respectively. As in the case of column densities, there is very good agreement (within half a K) between the simulated and feathered temperatures. The feathered temperatures tend to be higher (up to 1 K) than the simulated temperatures in the coldest regions of molecular clouds. This effect, also seen in the constant-offset temperatures, is likely connected to the assumption of a constant dust spectral index done in the step 1, and is also reflected in the column density maps (see above). The histogram of Fig. 10 shows that the constant–offset temperatures are biased towards higher values of 0.35 K, while the distribution of feathered temperatures peaks at T = 0 K, indicating no bias. Both temperature distributions have, however, large widths (up to 1 K), with the feathered distribution being highly symmetrical, in contrast to the constant–offset distribution.
These results show that our method recovers better the original NH and T information, thanks to the combination of large and small scale information. Furthermore, our method accomplishes this without introducing additional artifacts due to the data treatment.
7 Conclusions
The goal of this paper is to derive Planck–based multi–scale corrections for the Herschel images at 160 m, 250 m, 350 m, and 500 m. We achieve this goal by linearly combining Herschel and Planck data in Fourier space. We test our method in two different star forming molecular cloud regions. We further processed the feathered maps to obtain the column densities and temperatures of the regions studied. We compare our feathered column densities and temperatures with those obtained with previous methods: corrected the flux scale of Herschel images adding a constant–offset value obtained from comparisons with Planck data. We finally demonstrate the performance of our method in simulations. Here we summarize the main results of our paper.
-
•
We combine the Planck and Herschel datasets at an effective scale . This effective scale is calculated separately for each region as the angular scale at which the residuals between the combined image visibilities and the original Herschel and Planck visibilities are minimum. The effective scale has values between the Planck resolution () and . The latter is equivalent to applying only the Fourier zeroth mode correction to Herschel, and is mathematically identical to the previously used constant–offset correction. Our method is therefore a general method to correct the Herschel flux scales with the constant–offset correction arising naturally as a special case.
-
•
Our method can be generically applied to any combination of image estimators containing different angular resolutions.
-
•
In the HiGal–11 field, our feathered column densities exhibit higher (lower) NH values in (out of) the Galactic plane region, compared to the constant–offset method. In general, a similar effect is seen in Perseus in the areas surrounding NGC 1333, which also exhibits higher NH values compared to previous methods. We show that NH values calculated based on the constant–offset method can be discrepant by factors of % or more, but typically span variations of % over significant portions of the images.
-
•
In the two regions shown in this paper our feathered column densities recover more low column material, and the discrepancies with the previous method are most significant at the lower end of the column density distribution, near NH cm-2. Above this value, we find generally acceptable agreement with previous methods. As most molecular cloud mass resides at low NH values, a proper treatment of the column densities and temperatures is needed to better constrain fundamental physical parameters such as the gravitational potential.
-
•
We also apply our method to simulated molecular cloud data, where the actual temperature and column density distributions are known. We simulated the Planck and Herschel observations for the simulated cloud, including noise. We then applied artificial filtering to the simulated Herschel data. The comparison between the input and output NH and T maps reveals that our method successfully recovers the emission filtered out from the Herschel data. Therefore we conclude that our method is accurate and does a better job at reconstructing the missing background emission than a constant–offset correction alone would.
We make the data in this paper publicly available. Furthermore, our technique can be applied to the entire Herschel science archive. This is the goal of a follow up paper.
Acknowledgements.
JA and AS thank the referee for a constructive report whose line of inquiry led to significant improvements to this work. JA and AS thank Andrew Gould for insightful technical discussions that resulted in significant improvements to the method. The work of JA is supported by the Sonderforschungsbereich (SFB) 881 “The Milky Way System ”and the International Max-Planck Research School (IMPRS) at Heidelberg University. AS is thankful for funding from the “Concurso Proyectos Internacionales de Investigación, Convocatoria 2015” (project code PII20150171) and the BASAL Centro de Astrofísica y Tecnologías Afines (CATA) PFB-06/2007. J.B.-P. acknowledges UNAM-PAPIIT grant number IN110816, and to UNAM’s DGAPA-PASPA Sabbatical program. He also is indebted to the Alexander von Humboldt Stiftung for its invaluable support. This paper includes data from Herschel, a European Space Agency (ESA) space observatory with science instruments provided by European–led consortia and with important participation from NASA. This papers makes use of data provided by Planck, a project of the European Space Agency (ESA) with instruments provided by the o scientific consortia funded by ESA member states and led by Principal Investigators from France and Italy, telescope reflectors provided through a collaboration between ESA and a scientific consortium led and funded by Denmark, and additional contributions from NASA (USA). This research made use of Montage. It is funded by the National Science Foundation under Grant Number ACI-1440620, and was previously funded by the National Aeronautics and Space Administration’s Earth Science Technology Office, Computation Technologies Project, under Cooperative Agreement Number NCC5-626 between NASA and the California Institute of Technology.References
- André et al. (2010) André, P., Men’shchikov, A., Bontemps, S., et al. 2010, A&A, 518, L102
- Aniano et al. (2011) Aniano, G., Draine, B. T., Gordon, K. D., & Sandstrom, K. 2011, PASP, 123, 1218
- Beichman et al. (1988) Beichman, C. A., Neugebauer, G., Habing, H. J., Clegg, P. E., & Chester, T. J., eds. 1988, Infrared astronomical satellite (IRAS) catalogs and atlases. Volume 1: Explanatory supplement, Vol. 1
- Bernard et al. (2010) Bernard, J.-P., Paradis, D., Marshall, D. J., et al. 2010, A&A, 518, L88
- Bertincourt et al. (2016) Bertincourt, B., Lagache, G., Martin, P. G., et al. 2016, A&A, 588, A107
- Csengeri et al. (2016) Csengeri, T., Weiss, A., Wyrowski, F., et al. 2016, A&A, 585, A104
- Draine (2011) Draine, B. T. 2011, Physics of the Interstellar and Intergalactic Medium
- Draine et al. (2014) Draine, B. T., Aniano, G., Krause, O., et al. 2014, ApJ, 780, 172
- Draine & Li (2007) Draine, B. T. & Li, A. 2007, ApJ, 657, 810
- Fritz et al. (2012) Fritz, J., Gentile, G., Smith, M. W. L., et al. 2012, A&A, 546, A34
- Gordon et al. (2010) Gordon, K. D., Galliano, F., Hony, S., et al. 2010, A&A, 518, L89
- Griffin et al. (2010) Griffin, M. J., Abergel, A., Abreu, A., et al. 2010, A&A, 518, L3
- Jappsen et al. (2005) Jappsen, A.-K., Klessen, R. S., Larson, R. B., Li, Y., & Mac Low, M.-M. 2005, A&A, 435, 611
- Kainulainen et al. (2011) Kainulainen, J., Alves, J., Beuther, H., Henning, T., & Schuller, F. 2011, A&A, 536, A48
- Kramer et al. (2010) Kramer, C., Buchbender, C., Xilouris, E. M., et al. 2010, A&A, 518, L67
- Launhardt et al. (2013) Launhardt, R., Stutz, A. M., Schmiedeke, A., et al. 2013, A&A, 551, A98
- Lombardi et al. (2014) Lombardi, M., Bouy, H., Alves, J., & Lada, C. J. 2014, A&A, 566, A45
- Meisner & Finkbeiner (2015) Meisner, A. M. & Finkbeiner, D. P. 2015, ApJ, 798, 88
- Meixner et al. (2010) Meixner, M., Galliano, F., Hony, S., et al. 2010, A&A, 518, L71
- Molinari et al. (2010) Molinari, S., Swinyard, B., Bally, J., et al. 2010, A&A, 518, L100
- Motte et al. (2012) Motte, F., Bontemps, S., Hennemann, M., et al. 2012, in SF2A-2012: Proceedings of the Annual meeting of the French Society of Astronomy and Astrophysics, ed. S. Boissier, P. de Laverny, N. Nardetto, R. Samadi, D. Valls-Gabaud, & H. Wozniak, 45–50
- Motte et al. (2010) Motte, F., Zavagno, A., Bontemps, S., et al. 2010, A&A, 518, L77
- Ossenkopf & Henning (1994) Ossenkopf, V. & Henning, T. 1994, A&A, 291, 943
- Pilbratt et al. (2010) Pilbratt, G. L., Riedinger, J. R., Passvogel, T., et al. 2010, A&A, 518, L1
- Planck Collaboration et al. (2014a) Planck Collaboration, Abergel, A., Ade, P. A. R., et al. 2014a, A&A, 571, A11
- Planck Collaboration et al. (2016) Planck Collaboration, Ade, P. A. R., Aghanim, N., et al. 2016, A&A, 586, A132
- Planck Collaboration et al. (2014b) Planck Collaboration, Ade, P. A. R., Aghanim, N., et al. 2014b, A&A, 571, A1
- Planck Collaboration et al. (2014c) Planck Collaboration, Ade, P. A. R., Aghanim, N., et al. 2014c, A&A, 571, A1
- Poglitsch et al. (2010) Poglitsch, A., Waelkens, C., Geis, N., et al. 2010, A&A, 518, L2
- Robitaille et al. (2007) Robitaille, T. P., Whitney, B. A., Indebetouw, R., & Wood, K. 2007, ApJS, 169, 328
- Sadavoy et al. (2013) Sadavoy, S. I., Di Francesco, J., Johnstone, D., et al. 2013, ApJ, 767, 126
- Sodroski et al. (1997) Sodroski, T. J., Odegard, N., Arendt, R. G., et al. 1997, ApJ, 480, 173
- Stanimirovic (2002) Stanimirovic, S. 2002, in Astronomical Society of the Pacific Conference Series, Vol. 278, Single-Dish Radio Astronomy: Techniques and Applications, ed. S. Stanimirovic, D. Altschuler, P. Goldsmith, & C. Salter, 375–396
- Stutz et al. (2010) Stutz, A., Launhardt, R., Linz, H., et al. 2010, A&A, 518, L87
- Stutz & Gould (2016) Stutz, A. M. & Gould, A. 2016, A&A, 590, A2
- Stutz & Kainulainen (2015) Stutz, A. M. & Kainulainen, J. 2015, A&A, 577, L6
- Stutz et al. (2009) Stutz, A. M., Rieke, G. H., Bieging, J. H., et al. 2009, ApJ, 707, 137
- Stutz et al. (2013) Stutz, A. M., Tobin, J. J., Stanke, T., et al. 2013, ApJ, 767, 36
- Thompson et al. (1986) Thompson, A. R., Moran, J. M., & Swenson, G. W. 1986, Interferometry and synthesis in radio astronomy
- Zari et al. (2016) Zari, E., Lombardi, M., Alves, J., Lada, C. J., & Bouy, H. 2016, A&A, 587, A106
Appendix A Our interpolation functions
As shown in Eq. 3, the combination of Planck and Herschel datasets in the Fourier space includes the definition of two –scale dependent interpolation functions, and respectively. In the text we explain that the canonical feathering technique defines both functions as Gaussian, based on the approximation of telescope beam profiles as Gaussian functions. However, Csengeri et al. (2016) have shown that alternative interpolation functions can be successfully used to combine the data of two single dish telescopes in the Fourier space.
Specifically for our method, the interpolation functions must fulfill one condition: they must transition smoothly from the Herschel regime at small uv–scales to the Planck regime at large uv–scales with no loss in flux. To this aim, we decided to define and as:
| (5) |
where is a factor defining the steepness of the interpolation functions in the transition, and is the effective scale at which we combine the Herschel and Planck datasets. Note that Gaussian functions have no equivalent property to . Our interest on controlling the steepness of the interpolation functions responds to the condition of losing no (or negligible) flux when transitioning from Planck to Herschel scales. The interpolation functions to be applied to the Planck data are defined as
| (6) |
filling the requirement for every scale (see Fig 12). Note that in the standard feathering the weights sum to the Gaussian beam of the interferometer. The reason is reducing possible noise at the smallest –scales. However, we want to keep all power of Herschel at small scales. We therefore require that the sum of our interpolation functions is one at all scales. In Fig. 12 we show the comparison between the canonical Gaussian weights used in the feathering for interferometry and those used in our paper. We validate our non standard interpolation functions in the simulations show in Sect. 6 showing that we reproduced properly the distributions.

Appendix B NH and temperature fitting: modified black-body fitting
We provide a brief summary here and refer the reader to Stutz & Kainulainen (2015) and Stutz et al. (2010) for further details.
We convolve the feathered data to the beam of Herschel 500m (FWHM 36″) using convolution kernels from Aniano et al. (2011). We then re–grid the data to a common coordinate system, using an 14″pixel scale. With the surface densities of the four wavelengths we obtain an SED for each pixel. We fit each pixel SED using an MBB function:
| (7) |
where is the beam solid angle, is the Planck function at a dust temperature , and is the optical depth at frequency . We define the optical depth as , where is the total hydrogen column density, the mass of the hydrogen atom, the dust opacity, and the gas–to–dust ratio, assumed to be 110 (Sodroski et al. 1997). We use the dust opacities listed in the column 5 in Table 1 of Ossenkopf & Henning (1994): dust grains with thin ice mantles after years of coagulation time at an assumed gas density of cm-3. The systematic effects introduced when assuming a different dust model are discussed in Stutz et al. (2013) and Launhardt et al. (2013). The choice of dust model, along with the adopted value, likely dominate the systematic uncertainties.
We use a two-step method for applying the color and beam size corrections to the pixel SEDs. We fit the uncorrected fluxes to obtain a first estimate of the temperature. We then use this temperature to apply the corrections as described in the SPIRE and PACS instrument handbooks. We then repeat the fit to the corrected SED.