Low Jets from Compact Stellar Mergers - Candidate Electromagnetic Counterparts to Gravitational Wave Sources
Abstract
Short gamma-ray bursts (GRBs) are believed to be produced by relativistic jets from mergers of neutron-stars (NS) or neutron-stars and black-holes (BH). If the Lorentz-factorsof jets from compact-stellar-mergers follow a similar power-law distribution to those observed for other high-energy astrophysical phenomena (e.g. blazars, AGN), the population of jets would be dominated by low- outflows. These jets will not produce the prompt gamma-rays, but jet energy will be released as x-ray/optical/radio transients when they collide with the ambient medium. Using Monte Carlo simulations, we study the properties of such transients. Approximatelyof merger-jetsMpc result in failed-GRBs if the jetfollows a power-law distribution of index . X-ray/optical transients from failed-GRBs will have broad distributions of their characteristics: light-curves peak days after a merger; flux peaks for x-ray mJy; and optical flux peaks at . X-ray transients are detectable by Swift XRT, and of optical transients will be detectable by telescopes with limiting magnitude , for well localized sources on the sky. X-ray/optical transients are followed by radio transients with peak times narrowly clustered around days, and peak flux of mJy at 10 GHz and mJy at 150 MHz. By considering the all-sky rate of short GRBs within the LIGO/Virgo range, the rate of on-axis orphan afterglows from failed-GRB would be 2.6(26) per year for NS-NS(NS-BH) mergers, respectively. Since merger jets from gravitational-wave (GW) trigger events tend to be directed to us, a significant fraction of GW events could be associated with the on-axis orphan afterglow.
1 Introduction
Gamma-ray bursts (GRBs) are instantaneously the most luminous objects in the Universe, produced by the deceleration of ultra-relativistic outflow (Lorentz factors ). The core-collapse of massive stars are the progenitor of long GRBs, and the merger of binary compact stellar objects such as neutron stars (NS) and black holes (BH) are the possible progenitor of short GRBs (Woosley & Bloom 2006, Nakar 2007, Berger 2014). In both cases accretion onto a compact object is likely to power the relativistic outflow and the same physical processes are involved. The outflow energy is first dissipated by internal shocks (or another form of internal dissipation) which produces the prompt -rays. Later the interaction of the outflow with the ambient medium produces an external shock which expands and produces the subsequent afterglow (e.g. Piran 2004; Zhang & Mészáros 2004).
Relativistic motion is an essential ingredient in the GRB model although the exact outflow formation process is not known. Understanding the nature of the outflow, especially the acceleration, collimation, and energy content is a major focus of international research efforts in the context of GRB and other astrophysical jets. GRB outflows are conventionally assumed to be a baryonic jet (Paczynski 1986; Shemi & Piran 1990), although polarization measurements imply that magnetic fields play a role in the jet acceleration (e.g. Steele et al. 2009; Mundell et al. 2013; Götz et al. 2009; Yonetoku et al. 2011). Relativistic outflows and possibly magnetic acceleration are features that GRBs, active galactic nuclei (AGN), and microquasars have in common. Stellar tidal disruption by a massive BH is also likely to produce a relativistic jet (Bloom et al. 2011; Burrows et al. 2011, Zauderer et al. 2011, Levan et al. 2011, Cenko et al. 2012). By studying and comparing the properties of these objects, we could gain an insight into the processes that govern the formation of relativistic jets (e.g. Marscher 2006a, Nemmen et al. 2012).
In the case of blazars, we can measure apparent superluminal motion (i.e. lower limits of ), where reported apparent velocities are as high as for -ray bright blazars (Jorstad et al. 2005; Lister et al 2009; Piner et al. 2012, Liodakis & Pavlidou 2015). The Lorentz factor for AGN is typically (e.g. Marscher 2006a; Saikia et al. 2016, etc.) or (Lister et al. 2009). Blazars with a high overpopulate centimeter-wave surveys of bright flat-spectrum sources because of beaming bias. Alternatively, a volume-limited sample of radio-loud AGN would be dominated by objects with more mundane jets. A power-law distribution of Lorentz factors for AGN can be assumed, , where population synthesis studies show that a value of between 1.5 and 1.75 provides a good match between a synthetic and observed distribution of apparent velocities (Lister & Marscher 1997; Marscher 2006b). Recent work indicates a value of for blazars (Saikia et al. 2016).
Many observations indicate that GRBs are produced by ultra-relativistic outflows with . However, GRB progenitors might not always eject such a high flow. For example, if the outflow is baryonic, the baryon loading might not always be optimal, resulting in lower Lorentz factors. For an outflow with low , the internal dissipation processes (i.e. -ray production) happen when the outflow is still optically thick. Since we are currently discovering GRB events through wide field monitoring of the -ray sky (e.g. Swift, Fermi, IPN), a population of low outflows might be undiscovered.
Compact stellar mergers are the most promising targets for ground-based gravitational wave (GW) detectors such as advanced LIGO, Virgo and KAGRA. The merger of a binary BH system produced the advanced LIGO detection GW150914, the first direct observation of GW (Abbott et al. 2016b). EM counterparts to BH-BH mergers are not expected, Fermi Gamma-ray Burst Monitor (GBM) however, claimed a 2.9 detection of a weak -ray burst 0.4 seconds after the GW detection (Connaughton et al. 2016), if this burst is associated with GW150914 then an electromagnetic (EM) afterglow would also be present (Yamazaki et al. 2016). To maximize the science returns from further GW detections, the identification of an EM counterpart will be crucial. The -ray emission from short GRBs are an ideal EM counterpart to NS-NS/NS-BH mergers, and potentially BH-BH mergers. However, they occur relatively rarely within the range of GW detectors (300 Mpc for face-on NS-NS mergers), this is possibly because -ray emission is highly collimated, or the mis-match between short GRB peak energies and the Swift detection band can make detection more difficult. Additionally the intrinsic rate of compact object mergers within this volume is relatively low. More isotropic EM components such as macronovae are often discussed to localize a large sample of GW events (e.g. Metzger & Berger 2012; Nakar & Piran 2011; Gao et al. 2013; Kisaka, Ioka & Takami 2015).
In this paper, we discuss the possibility that a significant fraction of compact stellar mergers result in the production of low jets (). If such jets are common, x-ray, optical, and radio transients, i.e. on-axis orphan afterglows (Dermer et al. 2000, Nakar & Piran 2002a, Huang et al. 2002, Rhoads 2003, Cenko et al. 2013, Cenko et al. 2015), would be more frequent than short GRBs. Such low frequency transients would accompany a good fraction of GW events and they allow for the accurate determination of the sky positions of the GW sources. The time lag between GW signals, where we can assume that the jet launch time is coincident with the merging time when the GW amplitude becomes maximal, and EM jet emission will enable us to determine the distribution of jets from compact stellar mergers and it will provide another constraint on the acceleration process of relativistic jets. In 2 we discuss the background of relativistic motion in the standard GRB fireball model and the implications for the prompt -ray emission. 3 the case for a population of low Lorentz factor jets is made. 4 details the assumptions and conditions made by the Monte Carlo model plus the numerical results. 5 highlights the implications for GW rates within the LIGO/Virgo detection volume. In 6 conclusions are given.
2 Relativistic Motion and the Prompt Gamma-Ray Emission
Observed GRBs contain a large fraction of high energy -ray photons, which can produce electron-positron pairs if they interact with lower energy photons. If the optical depth for this process is large, pairs will form rapidly and Compton scatter other photons, resulting in an increased optical depth. The optical depth for the pair creation is very sensitive to the Lorentz factor of the source (e.g. Piran 1999; Lithwick & Sari 2001 for the typical high energy spectral index ). The source becomes optically thin if it is expanding with a Lorentz factor .
If there are baryons in GRB outflows, another limit on can be obtained by considering the scattering of photons by electrons associated with these baryons (e.g. Lithwick & Sari 2001). Note that high polarization results still suggest magnetized baryonic jets, rather than Poynting-flux dominated jets (Steele et al. 2009; Mundell et al. 2013). The optical depth due to these electrons at radius is where is the Thomson cross-section, is the total isotropic explosion energy and proton mass. Outflows become optically thin at the photospheric radius,
| (1) |
where ergs and . On the other hand, the variability timescale in GRBs constrains the radius from which the radiation is emitted,
| (2) |
where seconds. Requiring , we obtain . For outflows with a small Lorentz factor , the internal dissipation happens when the outflow is still optically thick. The photons will remain trapped and the thermal energy will be converted back to the kinetic form (Kobayashi & Sari 2001; Kobayashi et al. 2002), and the prompt -ray emission would be suppressed (i.e. failed GRBs).
Usually outflows are assumed to have a sub-relativistic temperature after the internal dissipation, and the internal energy density is comparable to the mass energy density . If a significant fraction of the internal energy is converted to electron-positron pairs, the number density of the electrons and positrons could be larger by a factor of than that of electrons that accompany baryons, where is the electron mass. A more detailed discussion (Lithwick & Sari 2001) also shows that the scattering of photons by pair-created electrons and positrons is nearly always more important than that by electrons that accompany baryons. Since the lepton pairs create an effective photosphere further out than the baryonic one, the approximation in equation (1) will provide conservative estimates when we discuss failed GRB rates in 4 and 5.
3 On-Axis Orphan Afterglow
Even if a jet does not have a velocity high enough to emit -rays, it eventually collides with the ambient medium to emit at lower frequencies. Such synchrotron shock radiation has been well studied in the context of GRB afterglows (e.g. Mészáros & Rees 1992, 1997; Sari & Piran 1999; Kobayashi et al. 1999).
Because of relativistic beaming, the radiation from a jet can be described by a spherical model when where is the jet half-opening angle. We here consider a relativistic shell with an energy and an initial Lorentz factor expanding into ISM with particle density . The deceleration of the shell happens at,
| (3) |
where protons cm-3, and is measured in the GRB rest frame. The typical frequency and the spectral peak flux of the forward shock emission at the deceleration time are,
| (4) | ||||
| (5) |
(Sari et al. 1998; Granot & Sari 2002) where and are the microscopic parameters, , , and cm (i.e. the LIGO range for face-on NS-NS mergers). The optical emission, assumed to be between the peak frequency and the cooling frequency , is expected to rise as and decay as after the peak .
Self-absorption can significantly reduce synchrotron shock emission at low frequencies. The upper limit can be approximated as black body flux for the forward shock temperature (e.g. Sari & Piran 1999), the limit at is
| (6) |
where GHz and the observable blast-wave size . Equalizing the synchrotron emission and the black body limit, we obtain the self-absorption frequency GHz at the deceleration time . The self-absorption limit initially increases as , and then steepens as after crosses the observational frequency . Considering that the synchrotron flux at also increases as , if at , the synchrotron emission would be reduced by the self-absorption at least until the passage of through the observational band at days. If the jet break happens while the flux is still self-absorbed, the light curve becomes flat const (Sari, Piran & Halpern 1999). However, this estimate is obtained by assuming the rapid lateral expansion (i.e. ). Recently studies show that the sideways expansion is rather slow especially for mildly-relativistic jets (Granot & Piran 2012; van Eerten & MacFadyen 2012). We will assume that the blast-wave emission starts to decay at the jet break,
| (7) |
even if it is in the self-absorption phase. At low frequencies GHz and early times, forward shock emission would be affected by synchrotron self-absorption. However, currently most radio afterglow observations are carried out at higher frequencies (e.g. VLA 8.5 GHz) at which self-absorption is more important for the reverse shock emission.
Just before the deceleration time , a reverse shock propagates through the jet and heats the original ejecta from the central engine. The reverse shock region contains energy comparable to that in the forward shock region. However, it has a lower temperature due to a higher mass (i.e. lower energy per particle). The shock temperature and the typical frequency are lower by a factor of and compared to those of the forward shock (e.g. Kobayashi & Zhang 2003). Although reverse shocks in low- jets could emit photons in the radio band, the self-absorption limit is tighter due to the lower shock temperature; we find that the forward shock emission always dominates. Note that we rarely catch the reverse shock emission even for regular GRBs with detectable -ray emission. We will discuss only the forward shock (i.e. blast wave) emission in this paper.
4 Monte Carlo Model
By using the estimates of Lorentz factors based on long GRB afterglow peak times, Hascoët et al. (2014) demonstrated that an apparent correlation between isotropic -ray luminosity and Lorentz factor can be explained by a lack of bright bursts with low Lorentz factors. They have also predicted the existence of on-axis orphan afterglows of long GRB events. We here extend their argument to short GRBs, and we apply their formalism to cosmological (i.e. -ray satellite range) and local (i.e. GW detector range) events to study the on-axis orphan afterglows of failed short GRBs (i.e. low- events). The following assumptions are made in our simple Monte Carlo simulation of a synthetic population of merger events:
-
1.
The redshift for each event is randomly determined using a distribution with a constant time delay with respect to the star formation rate, where the peak rate is at . The redshift limits of are used for the cosmological sample, and for local sample, i.e advanced LIGO/Virgo detectable range Mpc = 300 Mpc for NS-NS mergers where the factor of 1.5 accounts for the stronger GW signal from face-on mergers (Kochanek & Piran 1993). We use the event rate per unit comoving volume for short GRBs obtained by Wanderman & Piran (2015), which is a function of as
(8) Numerical results for the cosmological cases are insensitive to the value of the maximum as long as it is much larger than unity.
-
2.
A power-law distribution of Lorentz factors is assumed with reasonable limits . Motivated by AGN studies (e.g. Lister & Marscher 1997; Marscher 2006b), we choose as our fiducial value and the cases of and will be briefly discussed.
-
3.
The isotropic -ray luminosity is randomly generated in the limit erg/s erg/s where the limits come from observational constraints and the luminosity distribution follows the form obtained by Wanderman & Piran (2015),
(9) where this luminosity function is logarithmic in the interval d.
For each event, the dissipation radius is evaluated by using a random and the typical pulse width in short GRB light curves sec (Nakar & Piran 2002b). -ray photons are assumed to be emitted at with a random -ray luminosity or equivalently a random isotropic -ray energy where is the duration of short GRBs. We assume sec for all bursts as this is the median value for a log normal distribution of durations for short gamma-ray bursts (Zhang et al. 2012). The spectral peak energy in the spectrum is known to be correlated with (Yonetoku et al. 2004, Ghirlanda et al. 2009). The correlation is consistent for both long and short GRBs (Zhang et al. 2012), and given by
| (10) |
The spectrum is assumed to follow a broken power-law with low-energy index (below ) of (), and a high-energy index of (), where and are the photon number spectral indices. The mean index values for all GRBs are and (Gruber et al. 2014) but as short GRBs are typically harder than average we use the values and . The spectral peak is normalized as the value integrated between 1 keV and 10 MeV giving . If the outflow is optically thin, all the photons released at are radiated away. The event is considered to be detectable if the photon flux at the detector in the Swift band (15-150 keV) is photons s-1 cm-2 (Band 2006). We take into account the redshift of the spectrum when the photon flux is evaluated.
If the optical depth at the dissipation radius is more than unity, or equivalently the photospheric radius is larger than the dissipation radius, the -ray emission would be suppressed where is the explosion energy and is the conversion efficiency from the explosion energy to -rays. We use , this is consistent with theoretical predictions (Kobayashi et al. 1997) and the fiducial value used in other works (Liang et al. 2010; Ghirlanda et al. 2012). The -ray energy injected at is adiabatically cooled, and the photons decouple from the plasma at . Assuming a sharp transition from optically thick to thin regime (see Beloborodov 2011 for the discussion of fuzzy photosphere), we use hydrodynamic scalings to estimate the cooling factor. The internal energy density (photon energy density) decays as and the Lorentz factor is constant for the outflow with a sub-relativistic temperature (Piran et al. 1993). Considering that the internal energy in the outflow shell with width is , the luminosity of photons released at is
| (11) |
where we have assumed no shell spreading const. The spectral peak energy is similarly shifted as . The photons in the coupled plasma undergo pair production and Compton down-scattering that progressively thermalises the distribution (Hascoët et al. 2014). The electron temperature at can be approximated by a black-body temperature where is the radiation constant. The optical depth at is given by . The condition for efficient thermalisation is (Pe’er et al. 2005, Thomson et al. 2007) where is the mass of an electron and the Boltzmann constant. The peak energy for such a case is given by , above which the distribution is exponentially suppressed. For simplicity we assume . If , the photons are not efficiently thermalised. The distribution is then limited by the efficiency of pair production where the maximum energy is keV. The distribution is cut-off above this energy.
4.1 Numerical Results
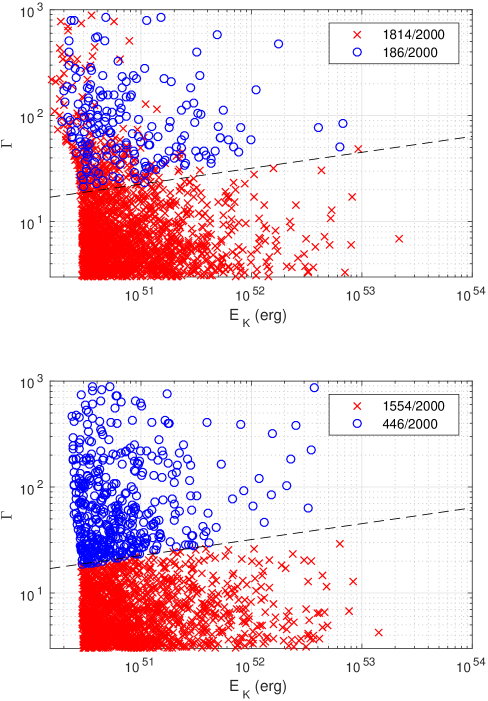
We generate a sample of events and evaluate the -ray flux for each in the Swift band. To allow for clarity without losing the general trend, the results for a population of 2000 events are shown in Figure 1; the blue circles and red crosses show the events detectable and undetectable by Swift, respectively. The isotropic kinetic energy is the energy in the blast wave after deceleration time, , where is the total isotropic explosion energy, and is the isotropic -ray energy at the photospheric radius . The Lorentz factor of an outflow at is shown against this. The top panel shows the results with , where we find a small fraction of the total population and of the events with are detectable by Swift. For the local population , these fractions are higher, at and respectively, due to the proximity (see the bottom panel). The dashed line indicates the lower limit for a successful GRB, events below this line have the prompt -ray emission fully suppressed; the cut-off, with the parameters used, is given by .
In Figure 1, the low-energy limit of is basically set by the Monte-Carlo luminosity distribution (i.e. erg/s. Note that the explosion energy is higher than the -ray energy at the dissipation radius by a factor of ). If we consider the local population (the bottom panel), for the events above the dashed line (i.e. the blue circles) all of the -ray energy is successfully radiated away, whereas for the events below the dashed line (i.e. the red crosses), almost all of the -ray energy is reabsorbed into the outflow. Thus the distribution of for the blue circles has a slightly lower limit. If we consider the cosmological population (the top panel), a fraction of events are distant and intrinsically dim. They are undetectable by Swift even if all gamma-ray energy is successfully radiated away at . This is why there are red crosses above the dashed line for the cosmological population. The fraction of the events detectable by Swift weakly depends on . If we assume erg/s, Swift would be able to detect of the total cosmological population, and of the total local population.
Liang et al. (2010), Ghirlanda et al. (2012) and Tang et al. (2015) report correlations between Lorentz factor and the isotropic luminosity (or the isotropic energy ) for long GRBs: ; ; and , respectively. However, such power-law relations could indicate a lower limit on for observable long GRBs with a given burst energy (Hascoët et al. 2014). In our simulation, we find that the detectable short bursts are always located above a line giving a lower limit relation .
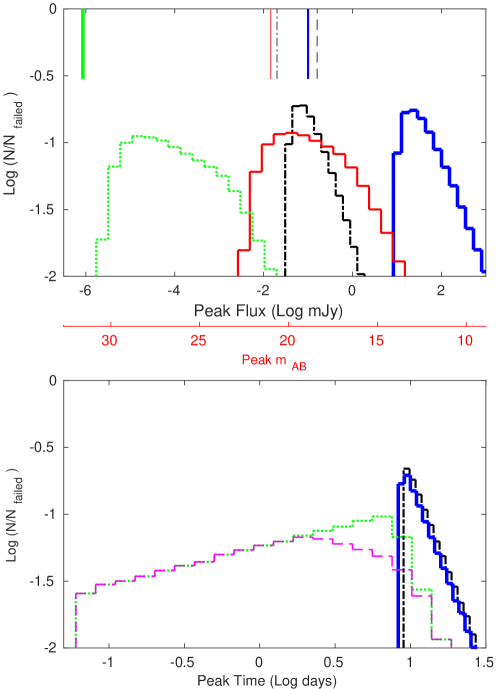
As discussed in section 3, the kinetic energy of the failed GRBs will be released as on-axis orphan afterglows at late times. Figure 2 shows the distributions of the peak flux (the top panel) and peak time (the bottom panel) of such x-ray, optical, and radio transients. To estimate these distributions, we have used the Monte Carlo results for the local sample ( Mpc) with model parameters: protons cm-3 (Berger 2014; Metzger & Berger 2012), , (Panaitescu & Kumar 2002; Yost et al. 2003; Berger 2014), the index of the power-law distribution of random electrons accelerated at shock (Sari, Narayan & Piran 1996; Daigne et al 2011; Metzger & Berger 2012), and the jet half-opening angle ensuring for our sample and is within the limits found by Fong et al. (2015) for short GRB. The jet opening angle plays a role only when we estimate the jet break time.
The dotted green lines (Figure 2) indicate the distribution for x-ray transients. The typical frequency of the blast wave emission is sensitive to the Lorentz factor . Since for the local population the on-axis orphan afterglows are produced by low- jets (), the typical frequency is expected to already be below the x-ray and optical band at the deceleration time . The x-ray and optical light curves should peak at and they have the same peak time distribution. Considering that the deceleration time is mainly determined by , we can roughly estimate the peak-time distribution . For , the distribution is wide and a large fraction of the events have the peak-time around several days after the merger event. If the minimum Lorentz factor is assumed, the peak-time distribution would achieve the peak around a few weeks after the merger event. The distribution of the peak flux for x-ray, where the frequency is above the cooling frequency , is is shown in the top panel. Given good localisation, all of the x-ray peak afterglow flux is above the minimum senstivity of the Swift XRT erg cm-2 s-1 for seconds (the vertical green thick solid line). The x-ray afterglows are below the trigger sensitivities of Swift BAT and MAXI; and too faint to be detectable by the Swift BAT survey.
The solid red line in the top panel and the dotted green line in the bottom panel indicates the distribution for optical (g-band) transients. The AB magnitude mAB axis is added in the top panel to indicate the optical flux. For optical transients, peak flux is , and of the optical orphan afterglows are brighter than (the vertical solid red line indicates this typical limit for mid-sized ( m) telescopes). The peak-time distribution for the bright events () is shown as the the dashed magenta line in the bottom panel. The difference between the dotted green (representing both x-ray and optical in peak time) and dashed magenta line corresponds to the dim event population (). Since these events tend to have low-, their typical frequencies are much lower than the optical band, and they peak at late times.
The solid blue lines give the distribution for radio (10 GHz) transients. The typical frequency is expected to be above 10 GHz at the deceleration time . The light curve peaks when the typical frequency crosses the observational band: . Since the dynamics of the blast wave at depends only on the Sedov length and not on the initial Lorentz factor , the peak-time distribution should be narrowly clustered, compared to the distribution of the optical transients. The Monte Carlo results actually give a narrow peak around 10 days. The peak flux is bright: typically mJy. VLA (the vertical solid blue line) can easily detect the transients.
The dashed-dotted black lines indicate the distribution for radio (150 MHz) transients. As we have discussed, this low frequency emission is suppressed by the self-absorption, and jet break is likely to happen before it becomes optically thin. The peak-time of the light curve is determined by the jet break time . For the fixed , we find that the peak-time distribution is similar to that for 10 GHz transients and it peaks around days. However, since the emission is still suppressed by the self-absorption at the peak time, the peak flux is much lower: mJy. Approximately of the 150 MHz transients are brighter than the sensitivity limit of 48 LOFAR stations (the vertical dashed black line), and all are brighter than the sensitivity limit for SKA1-Low (the vertical dashed-dotted black line).
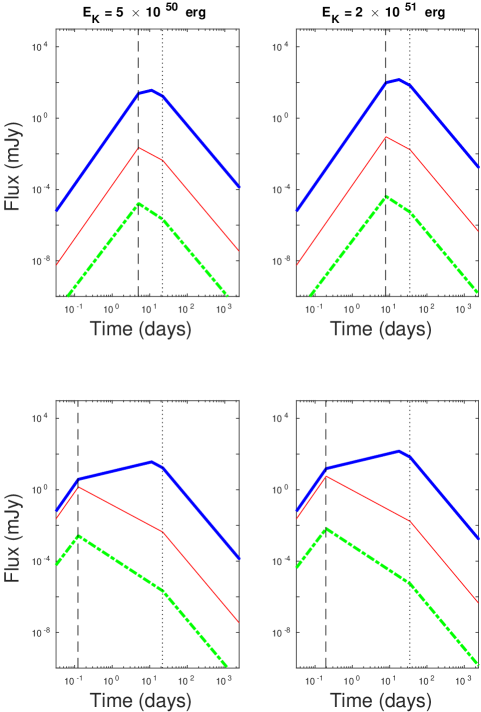
Typical afterglow light curves for a selection of on-axis orphan afterglows are shown in Figure 3. An average luminosity distance for NS-NS GW detectable mergers from our sample is used of 220 Mpc. X-ray, optical, and radio (10 GHz) are shown for 4 combinations of and . The vertical dashed line in each panel represents the deceleration time , as is most sensitive to (see equation 3) the lower Lorentz factor cases (top two panels) have a significantly later deceleration time. The vertical dotted line in each panel represents the jet-break time , a jet half-opening angle is used throughout, for narrower(wider) jet half-opening angles the break time will be at earlier(later) times. The jet-break time is only weakly dependent on the kinetic energy (see equation 7). In all cases the x-ray (green dash-dotted line) and the optical (thin red line) peak at the deceleration time, the 10 GHz (thick blue line) is shown to peak at a later time when the typical frequency crosses the radio frequency. In all cases at times earlier than the flux is , for the x-ray and optical the flux at is . At 10 GHz the flux is at , and after and before . In all cases at the flux is .
5 Event Rates and On-axis Probability
The Swift satellite has been detecting short GRBs at a rate of yr-1 since the launch in 2004, and of the detected events have measured redshifts (Swift GRB catalogue). Unfortunately no Swift short GRB with known redshift has been detected within the advanced LIGO/Virgo range for face-on NS-NS mergers Mpc, and only three (061201, 080905A, and 150101B) have occurred within the face-on NS-BH range Mpc (Abadie et al. 2010). Metzger & Berger (2012) estimate that short GRBs per year, with redshift measurements, are currently being localized by Swift within Mpc (Mpc). Considering that the field of view of the Swift BAT is sr, the all-sky rate of detectable short GRBs with or without redshift information is higher by a factor of .
If the distribution of is described by the power-law , when we consider the rate of jets from mergers regardless of inclination or detectability, the rate for failed GRBs would be higher than the short GRB rate. For local population Mpc, we find that the fraction of failed events is about for , for , and for (the same rates are obtained for a population of Mpc). If (), the failed GRB rate is higher by a factor of (6.7) than the short GRB rate (i.e. the ratio of failed to successful GRBs). The all-sky rate of the failed GRBs with or without redshift information is about 2.6(5.1) per year for the NS-NS range and 26(51) per year for the NS-BH range. Here we assumed the jet opening angle distribution does not depend on the Lorentz factor of the jets (i.e. GRB and failed GRB jets have the same opening angle).
The jet half-opening angle is not well constrained for short GRB jets (the median value for 248 long GRBs is ; Fong et al. 2015). Using four short GRBs which have temporal steepenings on timescale of days, the median value is estimated as (Fong et al. 2015). However, the majority of short GRBs do not have detected jet break, the inclusion of these bursts is essential in understanding the true opening angle distribution. Based on a probability argument, Fong et al. (2015) obtain the median value 16∘ and 33∘ if the maximum possible angle is 30∘ and 90∘, respectively.
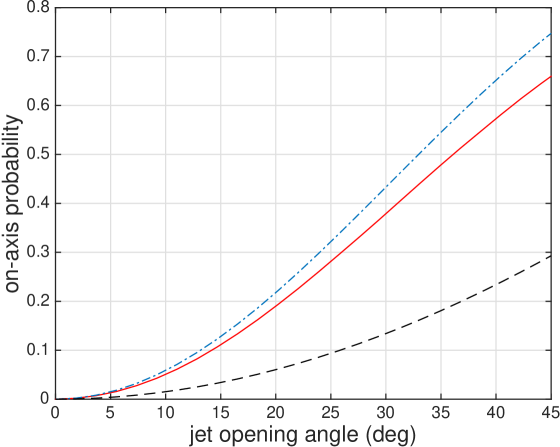
If the typical jet half-opening angle of short GRBs is , the beaming factor is where , only a small fraction of short GRB jets point toward us (see the black dashed line in Figure 4). However, since the GW polarization components and depend on the inclination angle of the binary, mergers emit GWs much more strongly along the polar axis than in the orbital plane. Considering that the jets from the mergers are also likely to be directed along the polar axis, Kochanek & Piran (1993) show that when a GRB is associated, the GW amplitude is stronger by a factor of than the amplitude averaged over the sky (as seen from the source). The distances out to which GW detectors could detect the binary increases by a factor of if the jet points toward us (we define an on-axis event as any jet where the inclination is within the half-opening angle, ).
When we consider a sample of merger GW events detected by a GW detector with sensitivity , their jets would tend to be directed to us. This is because on-axis events are detectable at a larger distance. The on-axis probability could be higher by roughly the volume factor of (the blue dashed-dotted line, figure 4) than the simple geometric estimate (i.e. our line-of-sight falls within the opening angle of the jet with a higher probability). We also conduct a Monte Carlo simulation to estimate the on-axis probability. In the simulation, mergers are uniformly distributed in space, with a random inclination angle, and they emit GWs with amplitude . After selecting the events detectable by a GW detector: , we evaluate the fraction of the events which have an inclination angle smaller than a given jet half-opening angle ; we assume uniform jets with a top hat distribution throughout111If the property of the jet depends on the angle from the jet symmetry axis (e.g. outside of some core angle), only the central part could have Lorentz factors high enough to produce -rays. Although the detailed study is beyond the scope of this paper, the failed GRB rate could be even higher for structured jets.. The result (the red solid line) does not depend on the detector sensitivity as long as the merger distribution is homogeneous. If we consider GW trigger events, the on-axis probability (the red solid line; and for and 33∘, respectively) is much higher than the beaming factor (the black dashed line). Although isotropic EM counterparts such as macronovae could be ideal to localize a large sample of GW events, of GW events would still be associated with the on-axis orphan afterglow of failed GRBs especially when they have wider jet opening angles compared to short GRB jets. For long GRB jets, observational results indicate such a correlation with (Panaitescu & Kumar 2002; Salmonson & Galama 2002; Kobayashi et al. 2002; Ghirlanda et al. 2013). The failed GRB rates could be higher than those discussed at the beginning of this section.
6 Conclusions
We have shown that failed GRBs are much more frequent than short GRBs when the Lorentz factors of jets from compact stellar mergers follow a similar power-law distribution as those observed for AGN. For most events the internal dissipation process happens when the jet is still optically thick, and the photons produced by the dissipation process will be converted back to the kinetic energy of the jet. By using a simple Monte Carlo model, we have shown that even for the local merger population within the LIGO/Virgo range, the -ray emission from jets with will not be detected by -ray satellites (e.g. Swift). For a power-law distribution of the jet Lorentz factors , 78% of compact object mergers that have jets result in a failed GRB. The failed GRB events will produce on-axis orphan afterglow at late times. Using the local short GRB rate as normalization, the all-sky rate of the on-axis orphan afterglow is about 2.6 and 26 per year for the NS-NS range (300 Mpc) and NS-BH range (600 Mpc), respectively. The opening angle of jets for long GRBs was found to be a function of (e.g. Ghirlanda et al. 2013), if low- jets from compact-binary mergers have wider half-opening angles than those of short GRBs then the real rate would be higher than these.
We have evaluated the peak time and peak luminosity of the on-axis orphan afterglows in x-ray, optical, and radio bands. Although it is usually difficult to model observational data for orphan afterglow candidates when the explosion time is unknown (i.e. the issue). For GW trigger events, GW signals will provide the explosion time . The peak time distribution in the x-ray and optical band is rather wide days after the GW signals. Although the sky localization of sources by GW detectors is not accurate enough for follow-up observations by most conventional telescopes (Abbott et al. 2016a), 85% of the on-axis orphan afterglows are brighter than . The current and upcoming optical transient search (e.g. iPTF/ZTF, Pan-STARRS, GOTO, BlackGEM, Kiso, SkyMapper, Subaru HSC, LSST) should be able to detect the optical transients. The x-ray and/or optical detection can be followed by radio observations (e.g. VLA), also several radio instruments have the potential to be leading transient detectors due to their large FoV (e.g. SKA, LOFAR, APERTIF, MWA). Radio emission is expected to peak around days after the merger events. Optical and radio observations will constrain the opening angle of low- jets (and high -jets).
Since merger jets from GW trigger events tend to be directed to us, the on-axis probability (e.g. 13% and 44% for and 33∘, respectively) is much higher than the beaming factor . A significant fraction of GW events could be associated with on-axis orphan afterglows. Observations of on-axis orphan afterglows and GRB afterglows will enable us to determine the distribution of jets (e.g. clustered at high-, a power-law distribution, a lognormal, or multiple populations), and it will provide constraints on the acceleration process of relativistic jets.
We thank the anonymous referee and Phil James for their constructive comments. This research was supported by STFC grants.
References
- (1) Abadie, J. et al. 2010, Class. Quantum Grav., 27, 173001.
- (2) Abbott, B. P. et al. 2016a, Living Reviews in Relativity, 19, 1
- (3) Abbott, B. P. et al. 2016b, Phys. Rev. Lett., 116, 06112.
- (4) Band, D. L. 2006, ApJ, 644, 378.
- (5) Beloborodov, A.M. 2011, ApJ, 737, 68.
- (6) Berger, E. 2014, Annu. Rev. Astron. Astrophys., 52, 43.
- (7) Bloom, J.S. et al. 2011, Science, 333, 203.
- (8) Burrows, D.N. et al. 2011, Nature, 476, 421.
- (9) Cenko, S.B. 2012, ApJ, 753, 77.
- (10) Cenko, S.B. et al. 2015, ApJ, 803, 24.
- (11) Cenko, S.B. et al. 2013, ApJ, 769, 130.
- (12) Connaughton, V. et al. 2016, arXiv: 1602.03920.
- (13) Daigne, F. et al. 2011, A&A, 526, 13.
- (14) Dermer, C. D. et al. 2000, ApJ, 537, 785-795.
- (15) Fong, W. et al. 2015, arXiv:1509.02922
- (16) Gao,H et al. 2013, ApJ, 771, 86.
- (17) Ghirlanda, G. et al. 2009, A&A, 496, 585.
- (18) Ghirlanda, G. et al. 2012, MNRAS, 420, 483.
- (19) Ghirlanda, G. et al. 2013, MNRAS, 428, 1410-1423.
- (20) Granot, J. & Sari, R. 2002, ApJ, 568, 820.
- (21) Granot, J. & Piran, T. 2012, MNRAS, 421, 570.
- (22) Gruber, D. et al. 2014, ApJS, 211, 27.
- (23) Götz, D. et al. 2009, ApJL, 695, L208.
- (24) Hascoët, R. et al. 2014, ApJ, 782, 5.
- (25) Huang, Y. F. et al. 2002, MNRAS, 332, 735.
- (26) Jorstad, S.G. et al. 2005, AJ, 130, 1418.
- (27) Kisaka, S., Ioka, K. & Takami,H. 2015, ApJ, 802, 119.
- (28) Kobayashi, S. Piran, T. & Sari, R. 1997, ApJ, 490, 92.
- (29) Kobayashi, S., Piran, T., & Sari,R. 1999, ApJ 513, 669.
- (30) Kobayashi, S. & Sari, R. 2001, ApJ 551, 934.
- (31) Kobayashi, S., Ryde, F. & MacFadyen,A. 2002, ApJ 577, 302.
- (32) Kobayashi, S. & Zhang, B. 2003, ApJ 582, L75.
- (33) Kochanek, C & Piran, T. 1993, ApJ, 417, L17.
- (34) Levan, A.J. et al. 2011, Sci, 333, 199.
- (35) Liang, E. et al. 2010, ApJ, 725, 2209.
- (36) Lister, M. et al. 2009, ApJ, 138, 1874.
- (37) Lister, M. & Marscher, A.P. 1997, ApJ, 476, 572.
- (38) Lithwick, Y. & Sari, R. 2001, ApJ, 555, 540.
- (39) Liodakis, I. & Pavlidou, V. 2015, MNRAS, 451, 2434.
- (40) Marscher, A.P. 2006a, in RELATIVISTIC JETS: The Common Physics of AGN, Microquasars, and Gamma-Ray Bursts, ed. P.H. Hughes & J.N. Bregman, AIP Conf. Proc. 856, 1.
- (41) Marscher, A.P. 2006b, PoS, Proceedings of the VI Microquasar Workshop: Microquasars and Beyond.
- (42) Metzger, B. D. & Berger, E. 2012, ApJ, 746, 48.
- (43) Mészáros, P. & Rees, M. 1992, MNRAS 258, 41.
- (44) Mészáros, P. & Rees, M. 1997, ApJ 476, 232.
- (45) Mundell, C. et al. 2013, Nature, 504, 119.
- (46) Nakar, E. & Piran, T. 2002a, New Ast., 8, 141-153.
- (47) Nakar, E. & Piran, T. 2002b, MNRAS, 330, 920.
- (48) Nakar, E. 2007 Phys. Rept., 442, 166-236.
- (49) Nakar, E. & Piran, T. 2011, Nature, 478, 82.
- (50) Nemmen, R. S. 2012, Science, 338, 1445.
- (51) Paczyński, B. 1986, ApJ, 308, L43.
- (52) Panaitescu,A.& Kumar, P. 2002, ApJ, 571, 779.
- (53) Pe’er, A. et al. 2005, ApJ, 635, 476-480.
- (54) Piner, B.G. et al. 2012, ApJ, 758, 84.
- (55) Piran, T. et al. 1993, MNRAS, 263, 861-867.
- (56) Piran, T. 1999, Phys. Rept., 314, 575
- (57) Piran, T. 2004, Rev. Mod. Phys., 76, 1143.
- (58) Rhoads, J. E. 2003, ApJ, 591, 1097.
- (59) Saikia, P., Elmar, K. & Falcke, H. 2016, MNRAS, 978.
- (60) Salmonson,J.D. & Galama,T.J. 2002, ApJ, 569, 682.
- (61) Sari, R., Narayan, R. & Piran, T. 1996, ApJ, 473, 204.
- (62) Sari, R. & Piran, T. 1999, ApJ 520, 641.
- (63) Sari, R., Piran, T. & Halpern, J.P. 1999, ApJL 519, L17.
- (64) Sari, R., Piran, T. & Narayan, R. 1998, ApJL 497, L17.
- (65) Shemi, A. & Piran, T. 1990, ApJ 365, L55.
- (66) Steele, I et al. 2009, Nature, 462, 767.
- (67) Tang, Q. W. et al. 2015, ApJ, 806, 194.
- (68) Thomson, C. 2007, ApJ, 666, 1012-1023.
- (69) van Eerten, H. J. & MacFadyen, A. I. 2012, ApJ, 751, 155.
- (70) Wanderman, D. & Piran, T. 2015, MNRAS, 448, 3026.
- (71) Woosley, S. E. & Bloom, J. S. 2006, Annu. Rev. Astron. Astrophys., 44, 1.
- (72) Yamazaki, R. et al. 2016, arXiv: 1602.05050.
- (73) Yonetoku, D. et al. 2004, ApJ, 609, 935.
- (74) Yonetoku, D. et al. 2011, ApJL, 743, L30.
- (75) Yost, S. et al. 2003, ApJ, 597, 459-473.
- (76) Zauderer, B. A. et al. 2011, Nature, 476, 425-428.
- (77) Zhang, B. & Mészáros, P. 2004, Int. Mod. Phys. 19, 2385.
- (78) Zhang, F. et al. 2012, ApJ, 750, 11.