The environment and star formation of HII region Sh2-163: a multi-wavelength study
Abstract
In order to investigate the environment of HII region Sh2-163 and search for evidence of triggered star formations in this region, we performed a multi-wavelength study of this HII region. Most of our data were taken from large-scale surveys: 2MASS, CGPS, MSX and SCUBA. We also made CO molecular line observations, using the 13.7m telescope. The ionized region of Sh2-163 is detected both by the optical and radio continuum observations. Sh2-163 is partially bordered by an arc-like photodissociation region (PDR), which is coincident with the strongest optical and radio emissions, indicating interactions between the HII region and the surrounding interstellar medium (ISM). Two molecular clouds were discovered on the border of PDR. The morphology of these two clouds suggests they are compressed by the expansion of Sh2-163. In cloud A, we found two molecular clumps. And it seems star formation in clump A2 is much more active than in clump A1. In cloud B, we found new outflow activities and massive star(s) are forming inside. Using 2MASS photometry, we tried to search for embedded young stellar object (YSO) candidates in this region. The very good relations between CO emission, infrared shell and YSOs suggest that it is probably a triggered star formation region by the expansion of Sh2-163. We also found the most likely massive protostar related to IRAS 23314+6033.
keywords:
HII regions - ISM: molecules - ISM: outflows - stars: formation - stars: protostars1 Introduction
A lot of research has been done in astrophysics to understand the formation of massive stars and the feedback to their surrounding ISM (e.g. Zinnecker et al. 2007; Deharveng et al. 2010, and references therein). However, many questions are still unclear. Multi-wavelength observations are essential to deeply understand how the triggered star formation processes impact on the massive star formation process. Young massive stars tend to form in clusters or groups. The formation of massive stars has an immense impact on their environment through ionizing radiation, heating of dust and expansions of their HII regions. These processes may trigger next generation of star formation by compressing neighboring molecular clouds to the point of gravitational instability. Massive stars also have powerful winds which sweep up the surrounding gas, creating interstellar bubbles (e.g. Weaver et al. 1977; Churchwell et al. 2006). In the case of OB associations, the released intense ultraviolet radiation may ionize the surrounding ISM within tens of parsecs. A number of observations demonstrate HII regions can strongly affect star formation nearby. Sugitani et al. (1989) showed the ratios of luminosity of the protostar to core mass in bright-rimmed clouds are much higher than those in dark globules. Dobashi et al. (2001) also showed that protostars associated with HII regions are more luminous than those in molecular clouds away from them, indicating HII regions favour massive stars or cluster formation in neighboring molecular clouds. Moreover, in the HII region of W5, Karr and Martin (2003) found the number of star-formation events per unit CO covering area within the influence zone is 4.8 higher than outside. However, the role of expanding HII regions in triggering star formation is still poorly understood. For example, Dale et al. (2007a,b) argue that the main effect of an expanding HII region may simply be to expose stars that would have formed anyway.
Several mechanisms by which massive stars can affect the subsequent star formation in an HII region have been proposed. Two of the most studied processes are known as “radiatively driven implosion” (RDI) (e.g. Lefloch & Lazareff 1994; Miao et al.2006; Miao et al. 2009 ) and “collect and collapse” (C&C) (e.g. Elmegreen & Lada 1977; Osterbrock 1989). According to the model of “RDI”, the expanding ionization fronts caused by the UV radiations impact into pre-existing molecular clouds, leading to the formation of a cometary globule, where new stars may finally be born (Larosa 1983). The “C&C” model invokes the standard picture of a slow moving D type ionization front with associated shock front that precedes the ionization front (Osterbrock 1989). Dense gas may pile up between the two fronts. On a long time the compressed shocked layer becomes gravitationally unstable and then star formation will take place inside. Observational evidence of both processes has been proposed in a number of HII regions (e.g. Deharveng & Zavagno 2008; Cichowolski et al. 2009; Paron et al. 2011). In this paper, we made a multi-wavelength study of Sh2-163 to find out whether second-generation clusters are forming around. We also discussed the physical mechanisms which may trigger star formation in this region.
Sh2-163 is an optically visible HII region centered on R.A. (2000) = 23h32m57.9s and Dec. (2000) = 60∘48′01′′ with a mean diameter of about 10′ (Sharpless 1959). The distance to Sh2-163 has been estimated by several authors, using different methods. CO observations by Blitz et al. (1982) shows it has a velocity of -44.9 3.8 km/s (the local standard of rest velocity), corresponding to a kinematic distance of 2.3 0.7 kpc (Brand & Blitz 1993). A spectrophotometric distance of 2.7 0.9 kpc was derived by Georgelin (1975). According to Russeil et al. (2007), Sh2-163 belongs to the complex 114.0 - 0.7, which is composed of Sh2-163, Sh2-164, and Sh2-166. All of the three HII regions are located on the Norma-Cygnus arm. Based on spectroscopic and UBV photometric observations, Russeil et al. (2007) found Sh2-163 is ionized by an O9V star (R.A. (2000) = 23h33m36.9s, Dec. (2000) = 60∘45′06.8′′) and an O8V star (R.A. (2000) = 23h33m32.7s, Dec. (2000) = 60∘47′32.1′′). And the two ionizing stars have a mean distance of 3.3 0.3 kpc. Thus, the distance of Sh2-163 is in the range of 2.3 to 3.3 kpc. We take a distance of 2.8 0.5 kpc in the following discussions.
2 Data Sets and Observations
The Canadian Galactic Plane Survey (CGPS) is a project combining radio, millimeter, and infrared surveys of the Galactic plane. The radio surveys were carried out at the Dominion Radio Astrophysical Observatory (DRAO), covering the region 74. ∘2 147. ∘3, with Galactic latitude extent -3. ∘6 +5.∘6 at 1420 MHz (Taylor et al. 2003), resolving features as small as 1 arcminute. In order to match the DRAO images, the CGPS data base also comprises other data sets, such as the Five College Radio Astronomical Observatory (FCRAO) CO(1-0) Survey of the Outer Galaxy (Heyer et al. 1998).
Mid-IR data were taken from the Midcourse Space Experiment (MSX) Galactic Plane Survey (Price et al. 2001). The MSX Band A includes the unidentified infrared bands (UIBs) at 7.7 m and 8.6 m with an angular resolution of about 18′′. And near-IR data were obtained from the Two Micron All Sky Survey (2MASS) Point Source Catalog (Skrutskie et al. 2006).
The SCUBA Legacy Catalogues (Di Francesco et al. 2008) provide two comprehensive sets of continuum maps (and catalogs), using data at 850 and 450 m obtained with the Submillimetre Common User Bolometer Array (SCUBA), with angular resolutions of 19′′ and 11′′ respectively. The data was reduced with the “matrix inversion” method described by Johnstone et al. (2000). Objects are named by their respective J2000.0 position of the peak 850m intensity. The catalogues also provide for each object the respective maximum 850 m intensity, estimates of total 850 m flux and size, and tentative identifications from the SIMBAD Database.
On the May of 2014, we performed CO observations using the 13.7 m millimeter telescope of Qinghai Station at the Purple Mountain Observatory at Delingha, China. On-the-fly (OTF) observing mode was applied, with nine-pixel array receiver separated by 180′′. The receiver was operated in the sideband separation of single sideband mode, which allows for simultaneous observations of three CO isotope transitions, with 12CO (1-0) in the upper sideband (USB) and 13CO (1-0) and C18O (1-0) in the lower sideband (LSB). The typical system temperature is between 132 K and 221 K during the observations. The angular resolution of the telescope is about 58′′, with beam efficiency between 0.44 at 115GHz and 0.51 at 110 GHz. The mapping step is 30′′ and the pointing accuracy is better than 5′′. A fast Fourier transform (FFT) spectrometer was used as the back end with a total bandwidth of 1 GHz and 16384 channels. The velocity resolution is about 0.16 km s-1 at 110 GHz. The spectral data were reduced and analyzed with CLASS and GREG software.
3 Results and analysis
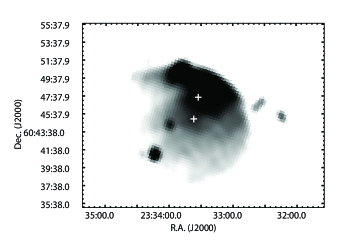
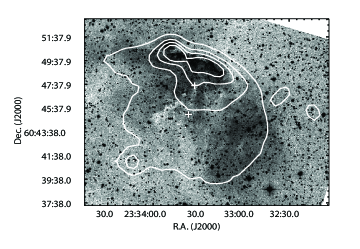
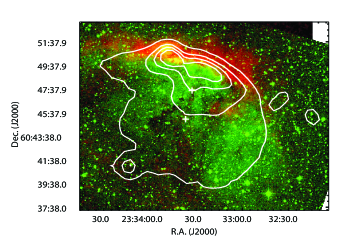
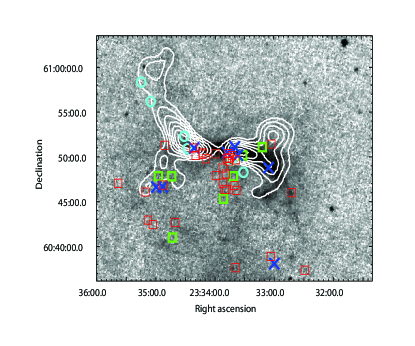
Fig.1 displays the images of Sh2-163 at different wavelengthes. The upper panel shows the radio continuum emission at 1420 MHz from the CGPS. An arc of strong radio continuum emission overlaying an extended diffuse emission can be noted. From north to south, the radio emission decreases. One of the two ionizing stars found by Russeil et al. (2007) is very close to the center, and the other is close to the peak of the radio emission. The middle panel shows an overlay of the emission at 1420 MHz (line contours) and the optical image (grey-scale). We can see that the arc-like structure of radio continuum emission is coincidental with the brightest optical region. The ionized region of Sh2-163 is detected both by the optical and radio continuum observations. However, inside the ionized region, the optical emission is weak near the location of R.A. (2000) = 23h33m17.8s and Dec. (2000) = 60∘46′07.7′′. Interstellar dust in a foreground cloud may be responsible for the observed optical absorption feature. We did find a CO cloud which is spatially coincident with the area lacking optical emission, using the data from FCRAO CO Survey of the Outer Galaxy (Heyer et al. 1998). The bottom panel shows a two-color image of Sh2-163: DSS-R image (green) and MSX band A image (red). An arc-like structure of enhanced mid-infrared emission is evident on the north side, which is also just outside the enhanced optical emission. Like those observed in many other HII regions, the polycyclic aromatic hydrocarbons (PAHs) may be responsible for the emission detected at 8.3 m, suggesting the existence of a PDR on the border of Sh2-173. The radio emission seems to penetrate into the PDR, indicating the interactions between the HII region and the mid-infrared shell.
| Cloud | Emissions | rms | FWHM | ||
| (km s-1) | (K) | (k) | (km s-1) | ||
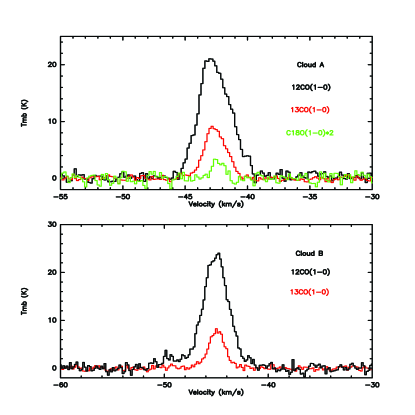
| A | 12CO (1-0) | -42.7 | 20.7 | 0.52 | 3.0 |
| 13CO (1-0) | -42.6 | 9.0 | 0.31 | 2.1 | |
| C18O (1-0) | -42.4 | 3.2 | 0.36 | 1.1 | |
| B | 12CO (1-0) | -45.0 | 23.3 | 0.66 | 2.9 |
| 13CO (1-0) | -45.0 | 7.8 | 0.33 | 1.8 |
3.1 CO emissions
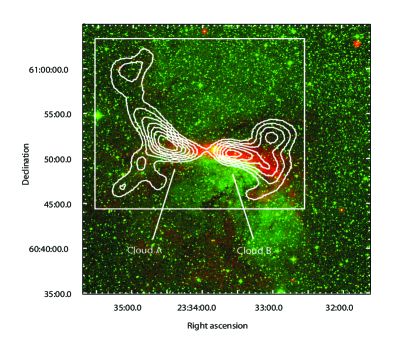
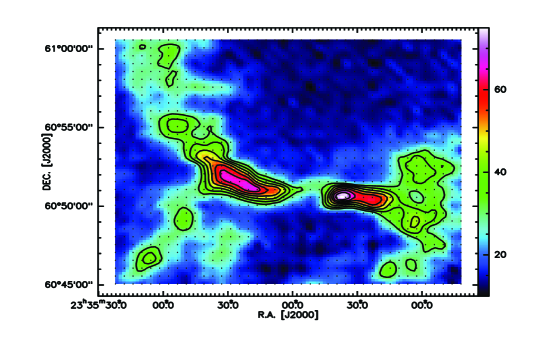
We first inspected the molecular gas around Sh2-163 from the CGPS data in the whole velocity range and found an interesting feature around -45 km s-1. Fig.2 displays the integrated intensity of 12CO (1-0) between -39 and -52 km s-1 superimposed on the MSX band A and DSS-R images. On the border of Sh2-163, two molecular clouds were found with an arc-like morphology, indicating they are compressed by the expanding HII region. The main peak of each cloud is also consistent with the mid-infrared emission. We further performed CO observations using the 13.7 m telescope to make a detail study of these clouds. The resolution of 13.7 m telescope is a little higher than that of the FCRAO 14m telescope (58′′ vs. 100′′). In addition, by studying the more optically thin lines of 13CO and C18O (if detected), we suppose to inspect the inner region of these clouds.
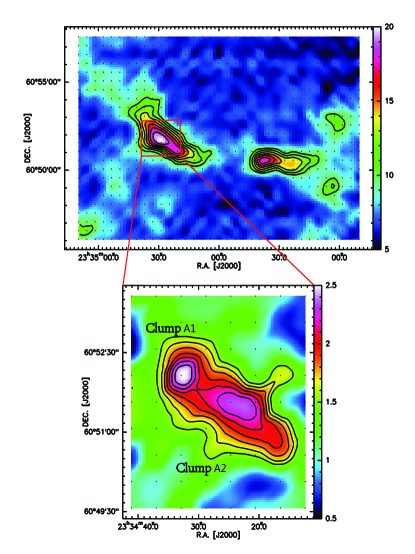
Fig.3 shows the CO isotope transitions at the peaks of molecular cloud A and B. C18O emission in cloud B was not detected. By fitting the C13O lines with gaussian functions, we obtained the peak velocities and FWHM (table 1). The derived Vlsr of cloud A and B is -42.6 km/s and -45.0 km/s, respectively. Fig.4 displays the integrated intensities of 12CO, 13CO and C18O lines. The morphology of two clouds is consistent with that detected by FCRAO. Moreover, in cloud A we found two molecular clumps (noted by clump A1 and clump A2 in figure 4) by C18O emissions. Detail study of the two clouds will be discussed in section 3.3.
| Cloud | R.A. | Dec. | Mass | ||
|---|---|---|---|---|---|
| (J2000) | (J2000) | (K) | (cm-2) | () | |
| A | 23h34m29s | 60∘51′40′′ | 24.1 | 8.4 1021 | 1341 |
| B | 23h33m35s | 60∘50′34′′ | 27.0 | 7.9 1021 | 591 |
We now try to estimate the molecular column densities and hence the masses of the two clouds from the 12CO and 13CO observations. Under the assumptions of local thermodynamic equilibrium (LTE) and 12CO to be optically thick, the excitation temperature (Tex) can be obtained through each peak brightness temperature of 12CO, via:
| (1) |
The excitation temperature of clouds A and B is 24.1 K and 27.0 K, respectively. The total column densities of 13CO can be obtained assuming that the 13CO emission is optically thin given by (Rohlfs Wilson 2004):
| (2) |
and
| (3) |
where Tbg is the temperature of the background radiation (2.73 K). The column densities of H2 could be obtained by adopting typical abundance ratios [H2]/[12CO] = 104, and [12CO]/[13CO] [12C]/[13C]. We adopted the Galactocentric distance-dependent [12C]/[13C] ratio from Wilson Rood (1994):
| (4) |
Using = mH we obtain the masses for cloud A and B, where is the H2 column density calculated through the above equations, = 2.8 kpc is the distance, is the area of the clouds (within 50 of each peak emission), and mH is the hydrogen atom mass. We adopt a mean molecular weight per H2 molecule of = 2.72 to include helium. The derived parameters are listed in table 2.
3.2 2MASS YSO candidates
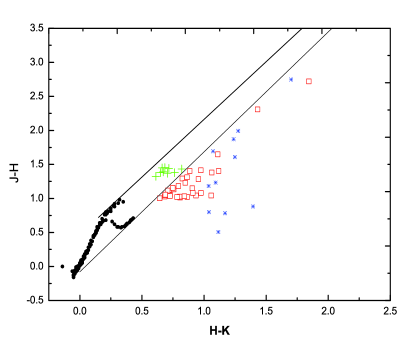
Both observations and theories indicate expanding HII regions may trigger next generation of stars (e.g. Osterbrock 1989; Cichowolski et al. 2009; Miao et al. 2009; Panwar et al. 2014 ). To look for evidence of triggered star formation, we searched for young stars in this region. We have adopted the criteria developed by Kerton et al. (2008) and converted this criteria to the distance of Sh2-163 and the visual absorption in this direction. From the classical relations, / = 5.8 1021 particles cm-2 (Bohlin et al. 1978) and = 3.1, we obtain 5.34 10-22 4.3 mag. According to different photometric qualities of 2MASS, we divided their YSO candidates into four groups (P1, P1+, P2, P3). P1 sources should have the valid photometry in all three bands (i.e. ph-qual values = A, B, C or D). For sources in group P1, the color criteria are (J-H)0.872 and (J-H)-1.7(H-K)+0.0830. It selects stars lying below the reddening vector associated with an O6V star. P1+ sources also have the valid photometry in all three bands. The color criteria of group P1+ are 1.172(J-H)1.472, (J-H)-1.7(H-K)+0.0830, (J-H)-1.7(H-K)-0.37970, and K14.5. It selects YSO candidates lying in the overlapping region of T Tauri and main sequence stars. Sources in group P2 have not been detected in the J band. Thus the actual positions of P2 sources in the (J-H) axe should be towards higher values. The color criteria of group P2 are (J-H)-1.7(H-K)+0.0830 and (H-K)0.918. Sources belonging to P3 group have J and H magnitudes that are lower limits so their color (J-H) can not be considered. The P3 color criteria is (H-K)0.918. Following such criteria, we searched for tracers of stellar formation activity in the 2MASS catalogue. Fig.5 shows the color-color diagram (CCD) of the selected YSO candidates. The two parallel lines are reddening vectors, assuming the interstellar reddening law of Rieke & Lebofsky (1985) (AJ / AV = 0.282; AH / AV = 0. 175; AK / AV = 0.112). Fig.6 shows the locations of the YSO candidates.
We now discuss the likelihood of triggering star formation in Sh2-163. It can be noted the presence of a group of these sources right upon the north side of Sh2-163. For the two molecular clouds we discussed above, there is a very good relationship between CO emission, infrared shell and YSO candidates. Almost no YSO candidates was found outside the shell, even though there are still strong CO emissions. Such phenomenon suggest triggered star formation may be taking place in this region by the expansion of Sh2-163. The morphology of these clouds detected by CO emissions could not be purely explained by the “collect and collapse” model, as the CO emission distribution suggests the presence of pre-existing molecular clouds in the border of the HII region. The DSS-R image of Figure 1 neither displays cometary morphology. We thus discard the so-called “RDI” and “C&C” processes. Another possibility is that the shocked expanding layer, prior to the beginning of the instability, collides with these pre-existing molecular clouds (A and B). Star formation would take place at the interface between the layer and the cloud clumps. Sh2-163 is not the only object; HII regions like Sh2- 235 (Kirsanova et al. 2008), Sh2-217 and Sh2-219 (Deharveng et al. 2003) also show such physical processes of sequential star formation.
| Shift | Integrated range | N (CO) | Mout | Pout | Eout |
|---|---|---|---|---|---|
| (km s-1) | ( 1016 cm-2) | () | ( km s-1) | (M⊙ [km s-1]2) | |
| red | (-43.5, -39) | 1.9 | 7.6 | 46 | 137 |
| blue | (-46.5, -51) | 2.7 | 14.2 | 85 | 255 |
3.3 Star formation in cloud A and B
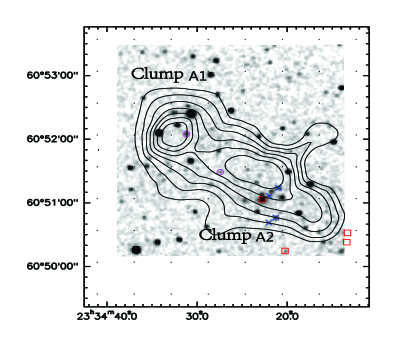
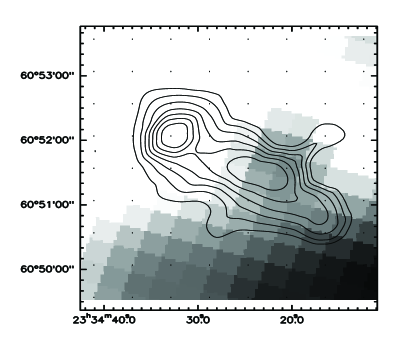
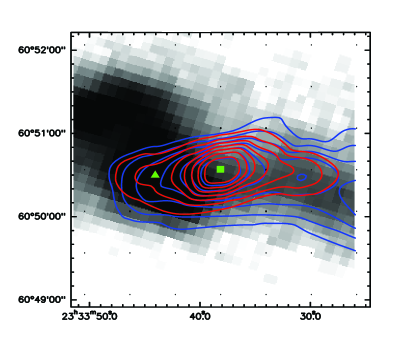
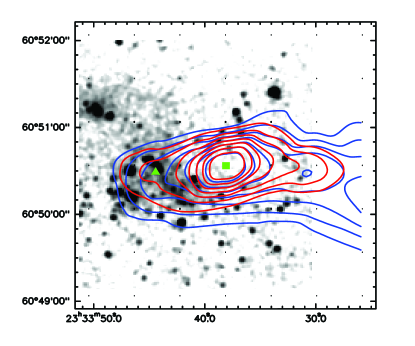
We now make a detail study of star formation in cloud A and B. As mentioned above, two molecular clumps were found in cloud A by C18O observations. Fig.7 shows the integrated intensity of C18O superimposed on the near-infrared (NIR) -band image of 2MASS. We can note that there are six 2MASS YSO candidates projected onto clump A2, while only one candidate in clump A1. Fig.7 also shows the 1420 MHz image (grey-scale) with the C18O intensity (contours) overlaid. It seems star formation in A2 is much more active than in A1. One good reason for this phenomenon is that the shock passed A2 first (triggered star formation inside) and then to A1. However, further observations should be carried out to study our speculation.
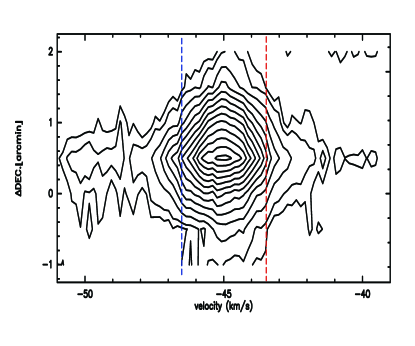
We found outflow activities in cloud B. Fig. 8 shows the 12CO position-velocity (PV) diagram of cloud B cut from north to south. The wing emission is obvious in the PV diagram. Typical outflows appear as spatially confined wings beyond the emission from the cloud. According to the PV diagram, we selected the integrated range of wings and determined the outflow intensities of red and blue lobes(figure 9). Using the method described in section 3.1, we obtain the masses for the red and blue lobes of the outflow. We estimate the momentum and energy of the red and blue lobes using
| (5) |
and
| (6) |
where is a characteristic velocity estimated as the difference between the maximum velocity of CO emission in the red and blue wings respectively, and the molecular ambient velocity (). The derived parameters are shown in table 3.
Near the core of cloud B we found that the IRAS point source 23314+6033 satisfied the protostellar object colors described by Junkes et al. (1992): S100 20 Jy, 1.2 6.0, 1 and Q60 + Q100 4, where Sλ and Qλ are the flux density and the quality of the IRAS flux in each of the observed band respectively. The total infrared luminosity of IRAS 23314+6033 can be calculated by the method of Casoli et al. (1986):
| (7) |
where D is the distance from the solar system in kpc. According to Smith et al. (2002), the luminosity of 17380 L⊙ corresponds to a B1.5 star. Zhang et al. (2005) made a 12CO(2-1) observation of IRAS 23314+6033 (1′ 1′ in step of 29′′), using the 12 m telescope of the National Radio Astronomy Observatory (NRAO) at Kitt Peak. They discovered an unresolved outflow driven by the IRAS point source. IRAS 23314+6033 is associated with the Red MSX Source (RMS) G113.6041-00.6161 (Lumsden et al. 2002), which is about 45′′ away from the peak of cloud B (the upper panel in figure 9). Considering the spacial resolution of MSX, we do not regard IRAS 23314+6033 is on the center of cloud B. Our larger area observations indicate the outflow discovered by Zhang et al. (2005) seems to be just a part of the main outflow from cloud B. Young star(s) deeply embedded on the center of cloud B drive(s) the main outflow. The NIR H2 emission is a good tracer of shocks in molecular outflows in low-mass star-forming regions. We can see extended emission in the band in figure 9, which may be partly due to excited H2 emission at 2.12 m.
We also searched for sources in the SCUBA legacy catalogues and found a prominent sub-mm source J233342.7+605030 associated with IRAS 23314+6033. The maximum brightness (B850) of J233342.7+605030 is 1.91 Jy beam-1, with a flux density (F850) of 3.3 Jy (Di Francesco et al. 2008). The deconvolved radius is 34.2 arcsec and corresponds to a physical diameter of 0.54 pc. Using the 850 m continuum emission, we estimate the dust mass from the relationship of Tej et al. (2006):
| (8) |
where Sν is the flux density at the frequency . We also assume that the dust temperature Td is 20 K, the dust emissivity index is 2.6 for the assumed dust temperature in this region according to Hill et al. (2006), and D the distance to Sh2-163 in kpc. We thus obtain a dust mass of Mdust 9.1 M⊙.
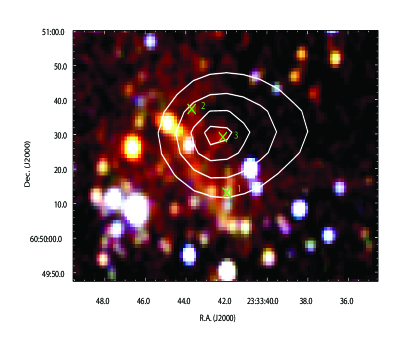
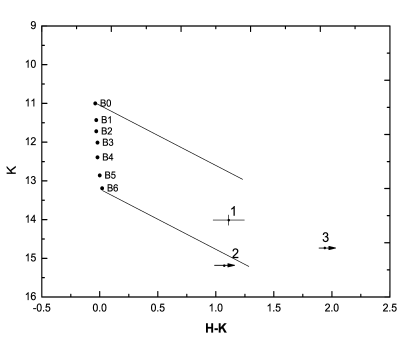
Fig.10 shows a composite image of the region surrounding the 850m source, made from 2MASS J-band (blue), H-band (green) and K-band (red) images. The contours, 850 m brightness levels of 0.9, 1.2, 1.5, 1.8 Jy beam-1, trace the very central part of the sub-mm source. Three YSO candidates selected through the criteria described above locate within the sub-mm emission, with star 3 in the center. Fig.11 shows these stars plotted in a 2MASS color-magnitude diagram (CMD). The main-sequence stars are shown with some representative spectral types at a distance of 2.8 kpc. The two parallel lines are Av = 20 reddening vectors for a B0V and B6V star using the interstellar reddening law of Rieke & Lebofsky (1985). Arrows indicate sources where the 2MASS catalog only lists an upper brightness limit in the relevant band. The source labeled 3 in Fig.10 and Fig.11 is probably a highly embedded YSO with spectral type between B0V and B3V, consistent with the IR luminosity analysis above. Thus, we suggest that the most likely massive protostar related to IRAS 23314+6033 would be star 3.
4 summary
Based on our CO emission observations of 13.7-m PMO telescope, together with other archival data including CGPS, 2MASS, MSX, and SCUBA, we made a multi-wavelength study of Sh2-163. The main results can be summarized as follows:
1.Radio continuum emissions, optical observations and mid-infrared images of Sh2-163 indicate the strong interactions between the HII region and the surrounding ISM.
2.Two molecular clouds were discovered on the border of PDR. The morphology of these two clouds also suggests they are compressed by the expansion of Sh2-163. In cloud A, we found two molecular clumps. Our study indicates star formation in clump A2 seems to be more active than in clump A1. In cloud B, we found outflow activities driven by young star(s) still deeply embedded.
3.Using 2MASS photometry, we searched for embedded YSO candidates in this region. The very good relations between CO emission, infrared shell and YSOs suggest that it is probably a triggered star formation region by the expansion of Sh2-163. We discard the so-called “RDI” and “C&C” processes taking place in Sh2-163, and propose another possibility that the shocked expanding layer, prior to the beginning of the instability, collides with these pre-existing molecular clouds (A and B). Star formation would take place at the interface between the layer and the cloud clumps.
4.We found a prominent sub-mm source at the location of IRAS 23314+6033. Three YSOs candidates were found imbedded. On the peak of the sub-mm emission locates an inter-mediate massive young star consistent with the IR luminosity analysis. We thus regard having found the most likely massive protostar related to IRAS 23314+6033.
ACKNOWLEDGEMENTS
We thank the anonymous referee for the constructive suggestions and we are also grateful to the staff at the Qinghai Station of Purple Mountain Observatory (PMO) for their observations. The CGPS is a Canadian project with international partners and is supported by grants from NSERC. Data from the CGPS are publicly available through the facilities of the Canadian Astronomy Data Center (http://cadc.hia.nrc.ca) operated by the Herzberg Institute of Astrophysics, NRC.
References
- Blitz et al. (1982) Blitz, L., Fich, M., Stark, A. A., 1982, ApJS, 49, 183
- Brand et al. (1993) Brand, J., Blitz, L., 1993, A&A, 275, 67
- Bohlin et al. (2002) Bohlin, R. C., Savage, B. D., Drake, J. F., 1978, ApJ, 224, 132
- Casoli et al. (2002) Casoli,F., Combes,F., Dupraz,C., Gerin,M., Boulanger,F., 1986, A&A, 169, 281
- Churchwell et al. (2002) Churchwell, E., Povich, M. S., Allen, D., 2006, ApJ, 649, 759
- Cichowolski et al. (2002) Cichowolski, S., Romero, G.A., Ortega, M.E., Cappa, C.E., Vasquez, J., 2009, MNRAS, 394, 900
- Dale et al. (2002) Dale, J. E., Ercolano, B., Clarke, C. J., 2007a, MNRAS, 382, 1759
- Dale et al. (2002) Dale, J. E.,Clark, P. C., Bonnell, I. A., 2007b, MNRAS, 377, 535
- Deharveng et al. (2002) Deharveng, L., Zavagno, A., Salas, L., et al. 2003, A&A, 399, 1135
- Deharveng et al. (2002) Deharveng, L., Schuller, L. D., Zavagno, A., et al. 2010, A&A, 523, 6
- Deharveng et al. (2002) Deharveng, L., Zavagno, A., 2008, in Beuther, H., Henning, T., eds, ASP Conf. Ser. Vol. 387, Massive Star Formation: Observations Confront Theory. Astron. Soc. Pac., San Francisco, p. 338
- Di Francesco et al. (2002) Di Francesco, J., Johnstone, D., Kirk, H., MacKenzie, T., Ledwosinska, E., 2008, ApJS, 175, 277
- Dobashi et al. (2002) Dobashi, K., Yonekura, Y., Matsumoto, T., Momose, M., Sato, F., et al. 2001, PASJ, 53, 85
- Elmegreen et al. (2002) Elmegreen, B.G., Lada C.J., 1977, ApJ, 214, 725
- Georgelin et al. (2002) Georgelin, Y.M., 1975, phD thesis, Univ. Provence, Obs. de Marseille
- Heyer et al. (2002) Heyer M. H., Brunt C., Snell R. L., Howe J. E., Schloerb F. P., Carpenter J. M., 1998, ApJS, 115, 241
- Hill et al. (2002) Hill, T., Thompson, M. A., Burton, M. G., et al. 2006, MNRAS, 368, 1223
- Johnstone et al. (2002) Johnstone,D., Wilson,C.D., Moriarty-Schieven, G., Giannakopoulou Creighton, J., Gregersen, E. 2000, ApJS, 131, 505
- Junkes et al. (2002) Junkes, N., Frst, E., Reich, W., 1992, A&A, 261, 289
- Karr et al. (2002) Karr, J. L., Martin, P. G., 2003, ApJ, 595, 900
- Kerton et al. (2002) Kerton, C. R., Arvidsson K., Knee, L. B. G., Brunt, C., 2008, MNRAS, 385, 995
- Kirsanova et al. (2002) Kirsanova, M. S., Sobolev, A. M., Thomasson, M., et al. 2008, MNRAS, 388, 729
- Koornneef et al. (2002) Koornneef, J., 1983, A&A, 128, 84
- Larosa et al. (2002) Larosa,T.N., 1983, ApJ, 274, 815
- Lefloch et al. (2002) Lefloch, B., Lazareff,B.,1994, A&A, 289, 559
- Lumsden et al. (2002) Lumsden, S. L., Hoare, M. G., Oudmaijer, R. D., Richards, D. 2002, MNRAS, 336, 621
- Miao et al. (2002) Miao, J., White,G.J., Nelson,R., Thompson,M., Morgan,L., 2006, MNRAS, 369, 143
- Miao et al. (2002) Miao, J., White,G.J., Thompson,M., Nelson,R., 2009, ApJ, 692,382
- Osterbrock et al. (2002) Osterbrock, D.E. 1989, Astrophysics of Gaseous Nebulae and Active Galactic Nuclei (Mill Valley, CA: Univ. Science Books)
- Panwar et al. (2002) Panwar, N., Chen, W.P., Pandy, A.K. et al. 2014, MNRAS, 443, 1614
- Paron et al. (2002) Paron,S., Petriella,A., Ortega,M.E., 2011, A&A, 525, 132
- Price et al. (2002) Price, S.D., Egan, M.P., Carey, S. J., Mizuno, D. R., Kuchar, T. A., 2001, AJ, 121, 2819
- Pieke et al. (2002) Rieke, G. H., Lebofsky, M. J., 1985, ApJ, 288, 618
- Rohlfs et al. (2002) Rohlfs, K., & Wilson, T. L. 2004, Tools of Radio Astronomy (4th ed.; Berlin: Springer)
- Russeil et al. (2002) Russeil, D., Adami, C., Georgelin, Y.M., 2007, A&A, 470, 161
- Sharpless et al. (2002) Sharpless. 1959, ApJS, 4, 257s
- Smith et al. (2002) Smith, L., Norris, R. P. F., Crowther, P. A., 2002, MNRAS, 337, 1309
- Skrutskie et al. (2002) Skrutskie M. F. et al., 2006, AJ, 131, 1163
- Sugitani et al. (2002) Sugitani, K., Fukui, Y., Mizuno, A., Ohashi, N. 1989, ApJ, 342, L87
- Taylor et al. (2002) Taylor et al. 2003, AJ, 125, 3145
- Tej et al. (2002) Tej, A., Ojha, D. K., Ghosh, S. K., et al. 2006, A&A, 452, 203
- Weaver et al. (2002) Weaver, R., McCray, R., Castor, J., Shapiro, P., Moore, R., 1977, ApJ, 218, 377
- Wilson et al. (2002) Wilson, T. L., & Rood, R. 1994, ARA&A, 32, 191
- Zhang et al. (2002) Zhang, Q.Z., Hunter, T.R., Brand, J., Sridharan, T.K., Cesaroni, R., Molinari, S., Wang, J., Kramer, K., 2005, ApJ, 625, 864
- Zinnecker. (2002) Zinnecker, H., & Yorke, H. W., 2007, ARA&A, 45, 481