Electronic properties of the FeSe/STO interface from first-principle calculations
Abstract
Compared to experiment, the calculated bulk lattice constant of FeSe is too small in LDA, PBEsol and PBE type exchange-correlation () functionals even though the mismatch decreases from LDA to PBE. In bulk SrTiO3 (STO) on the other hand LDA over-binds, PBE under-binds and PBEsol agrees best with experiment. With the errors in opposite directions, the strain in the FeSe monolayer on STO depends on the functional and, especially in the non-magnetic state, is strongly overestimated. In this work we investigate the influence of the functional and magnetism in density functional calculations on electronic bonding properties and charge transfer in the FeSe monolayer on a STO substrate. Furthermore, we consider the effect of oxygen-vacancies within the virtual crystal approximation. In agreement with earlier work, we find that the band structure of the checkerboard antiferromagnetic configuration agrees best with experiment where, in addition, the relative strain on FeSe is best described. For a small vacancy concentration, in agreement with recent experiment, the FeSe monolayer Ti layer distance increases while for higher concentrations it decreases.
I Introduction
The discovery of superconductivity (SC) in the single monolayer of FeSe on has triggered an enormous excitement in the community, first because of the very high critical temperature with an ARPES gap closing at K and second because the missing hole pocket at the Brillouin zone center. The absence of the hole pocket directly challenges the usual explanation of SC in the Fe-based superconductors by repulsive interactions that causes a sign changing gap function on the electron-like and the hole-like Fermi surface sheets of these materialsWang et al. (2012); Liu et al. (2012); He et al. (2013). Measurements of the anisotropy of the gap function on the remaining electron pocket have ruled out a dominant -wave character Fan et al. (2015); Zhang et al. (2015). In the search for the origin of SC in this particular material it is worth nothing that the electronic structure of the FeSe monolayer is very similar to the FeSe intercalates Qian et al. (2011); Burrard-Lucas et al. (2013) or the electron doped multi-layer surfaces Miyata et al. (2015) where ones also finds a critical temperature of around 40-50K with no apparent sign of attractive interactions in these system. Thus, we are left with the challenge to explain an apparent -wave gapped 40K superconductor with repulsive interactions.
One suggested explanation, recently proposed by two groups Linscheid et al. (2016); Mishra et al. (2016) is that pairing survives, even though the hole band is meV below the Fermi level and thus “incipient”. So far, both groups have used a very simplified model of the electronic band structure. The position of the hole band extremum is crucial since with the supposedly strong interactions in these systems, a magnetic transition is induced as soon as it approaches the Fermi level. In experiment this position corresponds to the effective doping level that can be controlled either directly by potassium dosing Song et al. (2016) or liquid gating techniques Hanzawa et al. (2015); Lei et al. (2015) or, effectively, by annealing steps He et al. (2013). The doping in the latter case is discussed to be caused by the occurrence of oxygen vacancies in the interfaceWang et al. (2016a); Shanavas and Singh (2015); Chen et al. (2016).
While the cause for SC in the FeSe intercalates is likely of purely electronic origin, in the monolayer of FeSe on STO with a higher , on the other hand, there have been clear signs of electron-phonon interactions. Ref. Lee et al., 2014 found replicas of the Fe -orbital bands at the Fermi level which follow the dispersion of electronic bands with an energy offset of meV, which matches the energy of one optical oxygen modes in the STO substrate. The occurrence of these replica bands can be explained by noting that the polar oxygen mode will induce a dipole coupling of the electronic states in FeSe. In the model of Ref. Lee et al., 2014, the coupling away form zero momentum transfer falls of exponentially with a length scale controlled by the distance of the FeSe from the O ions in the STO substrate making the calculation of this parameter crucialLee (2015).
As was pointed out by Ref. Lee et al., 2014 such a small momentum or so called forward scattering coupling is attractive in almost all pairing channels. In line with this conclusion, Ref. Chen et al., 2015 showed that such a low momentum transfer will induce only intra-band coupling which will further enhance a possible incipient pairing state. This can explain the further enhancement of in the monolayers as compared to the purely electronic systems. A further theoretical understanding of this mechanism and, in particular, an extension to a more realistic electronic structure using computational methods would be desirable.
Density functional methodsHohenberg and Kohn (1964); Kohn and Sham (1965) have established a good starting point for realistic calculations in the Fe-based superconductors Singh and Du (2008); Mazin et al. (2008a); Kimber et al. (2009) (see Ref. Hirschfeld et al., 2011 for a review). However, to accurately describe the electronic structure of most FeSe systems remains difficult. DFT calculations, in particular within the generalized gradient approximation, have a tendency to overestimate the magnetic momentHirschfeld et al. (2011); Mazin et al. (2008b). For example, LDAKumar et al. (2012) and PBERicci and Profeta (2013) predict an antiferromagnetic ground state of bulk FeSe at the experimental lattice configurations while the system is paramagnetic in experiment. Performing a relaxation in the paramagnetic state leads to a strongly underestimated Fe-Se bonding length and van der Waals interactions are important to accurately predict the layer separationRicci and Profeta (2013). Also for bulk FeSe the electron and hole pockets turn out too large which may be explained by the underestimation of the repulsion between the electron and hole pockets within DFTOrtenzi et al. (2009).
In spite of these inaccuracies, several groups have calculated properties of the monolayer FeSe on STO from first principles. Ref. Bazhirov and Cohen, 2013 found that for a free standing layer the checkerboard antiferromagnetic structure agrees best with experiment. Shanavas et al. Shanavas and Singh (2015) studied the FeSe monolayer while accounting for the STO substrate. They consider vacancies in the system by replacing 20% of the surface O with F to simulate oxygen vacancies on the level of a virtual crystal approximation (VCA). While this does induce a charge transfer to the surface, it is found that the Fe orbitals that constitute the hole pocket remain at the Fermi level.
Ref. Chen et al., 2016 used a super-cell approach to discuss the effect of an oxygen vacancy on the band structure within the non-magnetic, the checkerboard- and the stripe antiferromagnetic ordering. The super-cell approach has been used before for to study the pure STO surfaceShen et al. (2012). In a further step, Y. Wang et al. Wang et al. (2016b) computed the electron-phonon coupling in the terminated slab and in a super cell with an oxygen vacancy. While the focus of this work is on the resolution of the momentum dependence of the electron-phonon coupling, it is also found that the vacancy caues a stronger binding between the FeSe layer and the substrate.
Moreover, S. Coh et al. Coh et al. (2015) and Li et al. Li et al. (2014) have calculated the electron-phonon coupling of the interface and, recently, S. Coh et al. Coh et al. (2016) proposed a superstructure of this interface to further enhance the phonon coupling.
Most calculations in this context have used the Perdew-Burgke-Ernzerhof (PBE) density functionalPerdew et al. (1996) and all studies seems to agree that introducing vacancies binds the FeSe layer closer to the substrate and electron-dopes the FeSe layer.
In a recent experimental study Li et al. (2015), it was discovered that upon annealing where the system turns from non-superconducting to superconducting, the binding distance of the FeSe layer, in fact, increases. This finding is in contradiction to the theoretical calculations even though comparison is difficult because the actual vacancy content in experiment is not easily determined. Ref. Li et al., 2015 suggests that the interface is, in fact, FeSe on STO terminated by a double layer of . Moreover, the monolayer is shown to cover the STO substrate incommensurately.
It is known that PBE tends to overestimate the binding distance while LDA type functionals are known to underestimate it Perdew et al. (2008). This insight seems particularly important because it is common practice to fix the lattice constant to experiment while one implicitly allows the direction relaxation of the slab since the cell contains a large part of vacuum. This may cause a very large non-uniaxial pressure in the calculations.
In this work, we revisit the bulk calculations for both STO and FeSe and point out that the dismatches of lattice constants in go into opposite directions - predicted lattice parameters within the layer are too small in FeSe while in STO they obey the usual trend. As we find that PBEsolPerdew et al. (2008) is best for STO and PBE in an antiferromagnetic state is best for FeSe we compute the interface in both functionals. As oxygen vacancies play a key role in this system, we further investigate the structure and the charge transfer as a function of vacancy content within the VCA which allows us to treat small vacancy concentrations. We find for low concentrations that the layer moves away from the substrate and the doping effect on Fe is small while for higher concentrations the bond length Se-Ti shortens and charge is transferred to the FeSe layer.
II Computational details
We model the surface by placing an FeSe monolayer on a slab of 3 layers of . Periodic replicas in direction are separated by Å of vacuum to eliminate axillary interaction. All subsequent DFT calculations were performed with Quantum ESPRESSO Giannozzi et al. (2009) using ultra-soft GBRV pseudo potentials Garrity et al. (2014). Accurate convergence was achieved within a plane wave cutoff of 50Ry and 200Ry for wave function and charge density unless otherwise noted. We sample the Brillouin zone using a Monkhurst-Pack grid Monkhorst and Pack (1976) with a Methfessel-Paxton smearing Methfessel and Paxton (1989) of 0.02Ry. We use a very strict condition of and Ry for force and total energy convergence during relaxations. Especially when oxygen vacancies are considered, the asymmetric slab shows a dipole moment. In order to remove spurious interaction with the periodic replicas, an axillary compensating dipole is introduced in the vacuum. Ref. Zhou and Millis, 2016 concluded that the the octahedral, ferro-electric distortion is suppressed near the surface and in general not important for the electronic structure. Based on this insight, we approximate the ferroelectric distorted STO with a cubic unit cell.
III Bulk calculations
| LDA | PBEsol | PBE | Exp | ||||
| NM | AFM | NM | AFM | NM | AFM | ||
| [Å] | 3.842 | 3.892 | 3.937 | 3.907Cao et al. (2000) | |||
| [Å] | 3.589 | - | 3.623 | 3.631 | 3.685 | 3.716 | 3.765Louca et al. (2010) |
| [Å] | 3.589 | - | 3.623 | 3.623 | 3.685 | 3.709 | 3.754Louca et al. (2010) |
| [Å] | 5.301 | - | 5.476 | 5.544 | 6.336 | 6.206 | 5.479Louca et al. (2010) |
| [Å] | 1.364 | - | 1.370 | 1.397 | 1.377 | 1.447 | 1.462Louca et al. (2010) |
| 0 | 1.669 | 2.362 | |||||
In preparation for the calculation of the FeSe monolayer on STO interface, we consider the individual bulk materials in this section. The cutoff for FeSe could be reduced to 45Ry and 180Ry for wavefunction and charge density with a point sampling of and for STO. We performed a relaxation for all three functionals while starting from a tetragonal phase in the non-magnetic (NM) phase or an orthorhombic and antiferromagnetically broken symmetry. The resulting structures are given in Tab. 1. The relaxation within the LDA always lead to the non-magnetic structure, i.e. the broken symmetries were restored to numerical accuracy.
Results for STO are more in line with the usual hierarchy of bonding lengths where LDA underestimates, PBE overestimates and PBEsol is closest to experiment. In FeSe, however, all functionals underestimate the in-plane lattice constant, especially if the NM state is considered. Calculated lattice constants for LDA are in good agreement with earlier work Winiarski et al. (2012). Ref. Ricci and Profeta, 2013 finds that the stripe antiferromagnetic state, that has in fact the lowest energy, shows an even better agreement of the and lattice constants. However, since earlier work on the FeSe/STO interface agrees that the electronic structure of the checkerboard antiferromagnetic state agrees best with experiment, we focus on this phase and its bulk properties as calculated with DFT methods. In the following, we shall always refer to the checkerboard order as the AFM state. Ref. Ricci and Profeta, 2013 also points out that van der Waals interactions are crucial to compute out of plane, , lattice constant correctly. That the same conclusion holds for the monolayer on STO is not immediately clear, since, especially if there is charge transfer, other effects are likely dominant.
From this analysis, we conclude that we can expect the structure of the STO to be best described within the PBEsol functional while PBE will perform better for the FeSe monolayer. In the following we will compare the performance of these functionals within the AFM and NM state while we include oxygen vacancies at the last stage.
IV Double layer
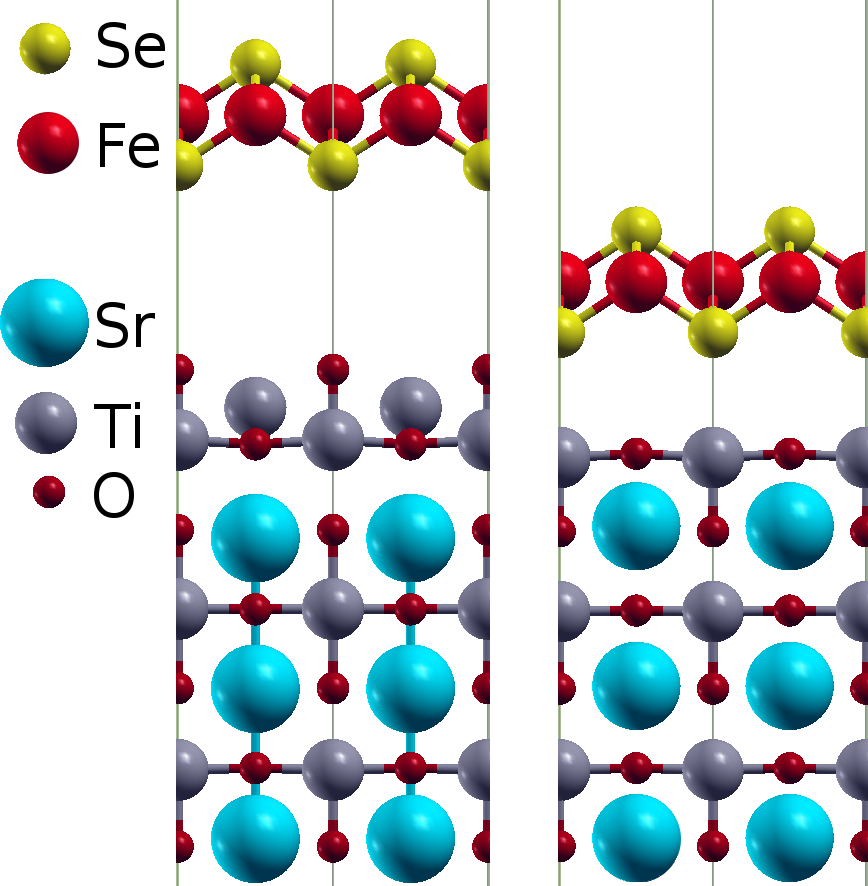
In this section, we follow the suggestion of Ref. Li et al., 2015 and consider a slab terminated by a double layer of below the FeSe monolayer. We model the system with a slab of 3 layers of cubic STO and add an additional layer below the FeSe. The relaxed structure within PBE is shown in Fig. 1. It turns out, that the FeSe layer is poorly bound and >5Å far away from the substrate in this configuration, both in PBEsol and PBE. In fact, it was not possible to relax the system to the required low forces and the constrained on forces had to be reduced to Ry/au indicating that the minimum in the potential energy surface is very shallow. While the binding may become closer if van der Waals interactions are considered, we also observe a reconstruction of the double where the Ti of the topmost layer moves towards the substrate which is different from the layer found in Ref. Li et al., 2015 where the layers keep their general structure and the separation of the layers, instead, increases as compared to bulk STO. The effect of close binding of the double layers is consistent within all tests performed on this system and in disagreement with the structure reported in Ref. Li et al., 2015. We determine from the DFT perspective that the single terminated STO is the more likely configuration.
V Binding distance and relaxation
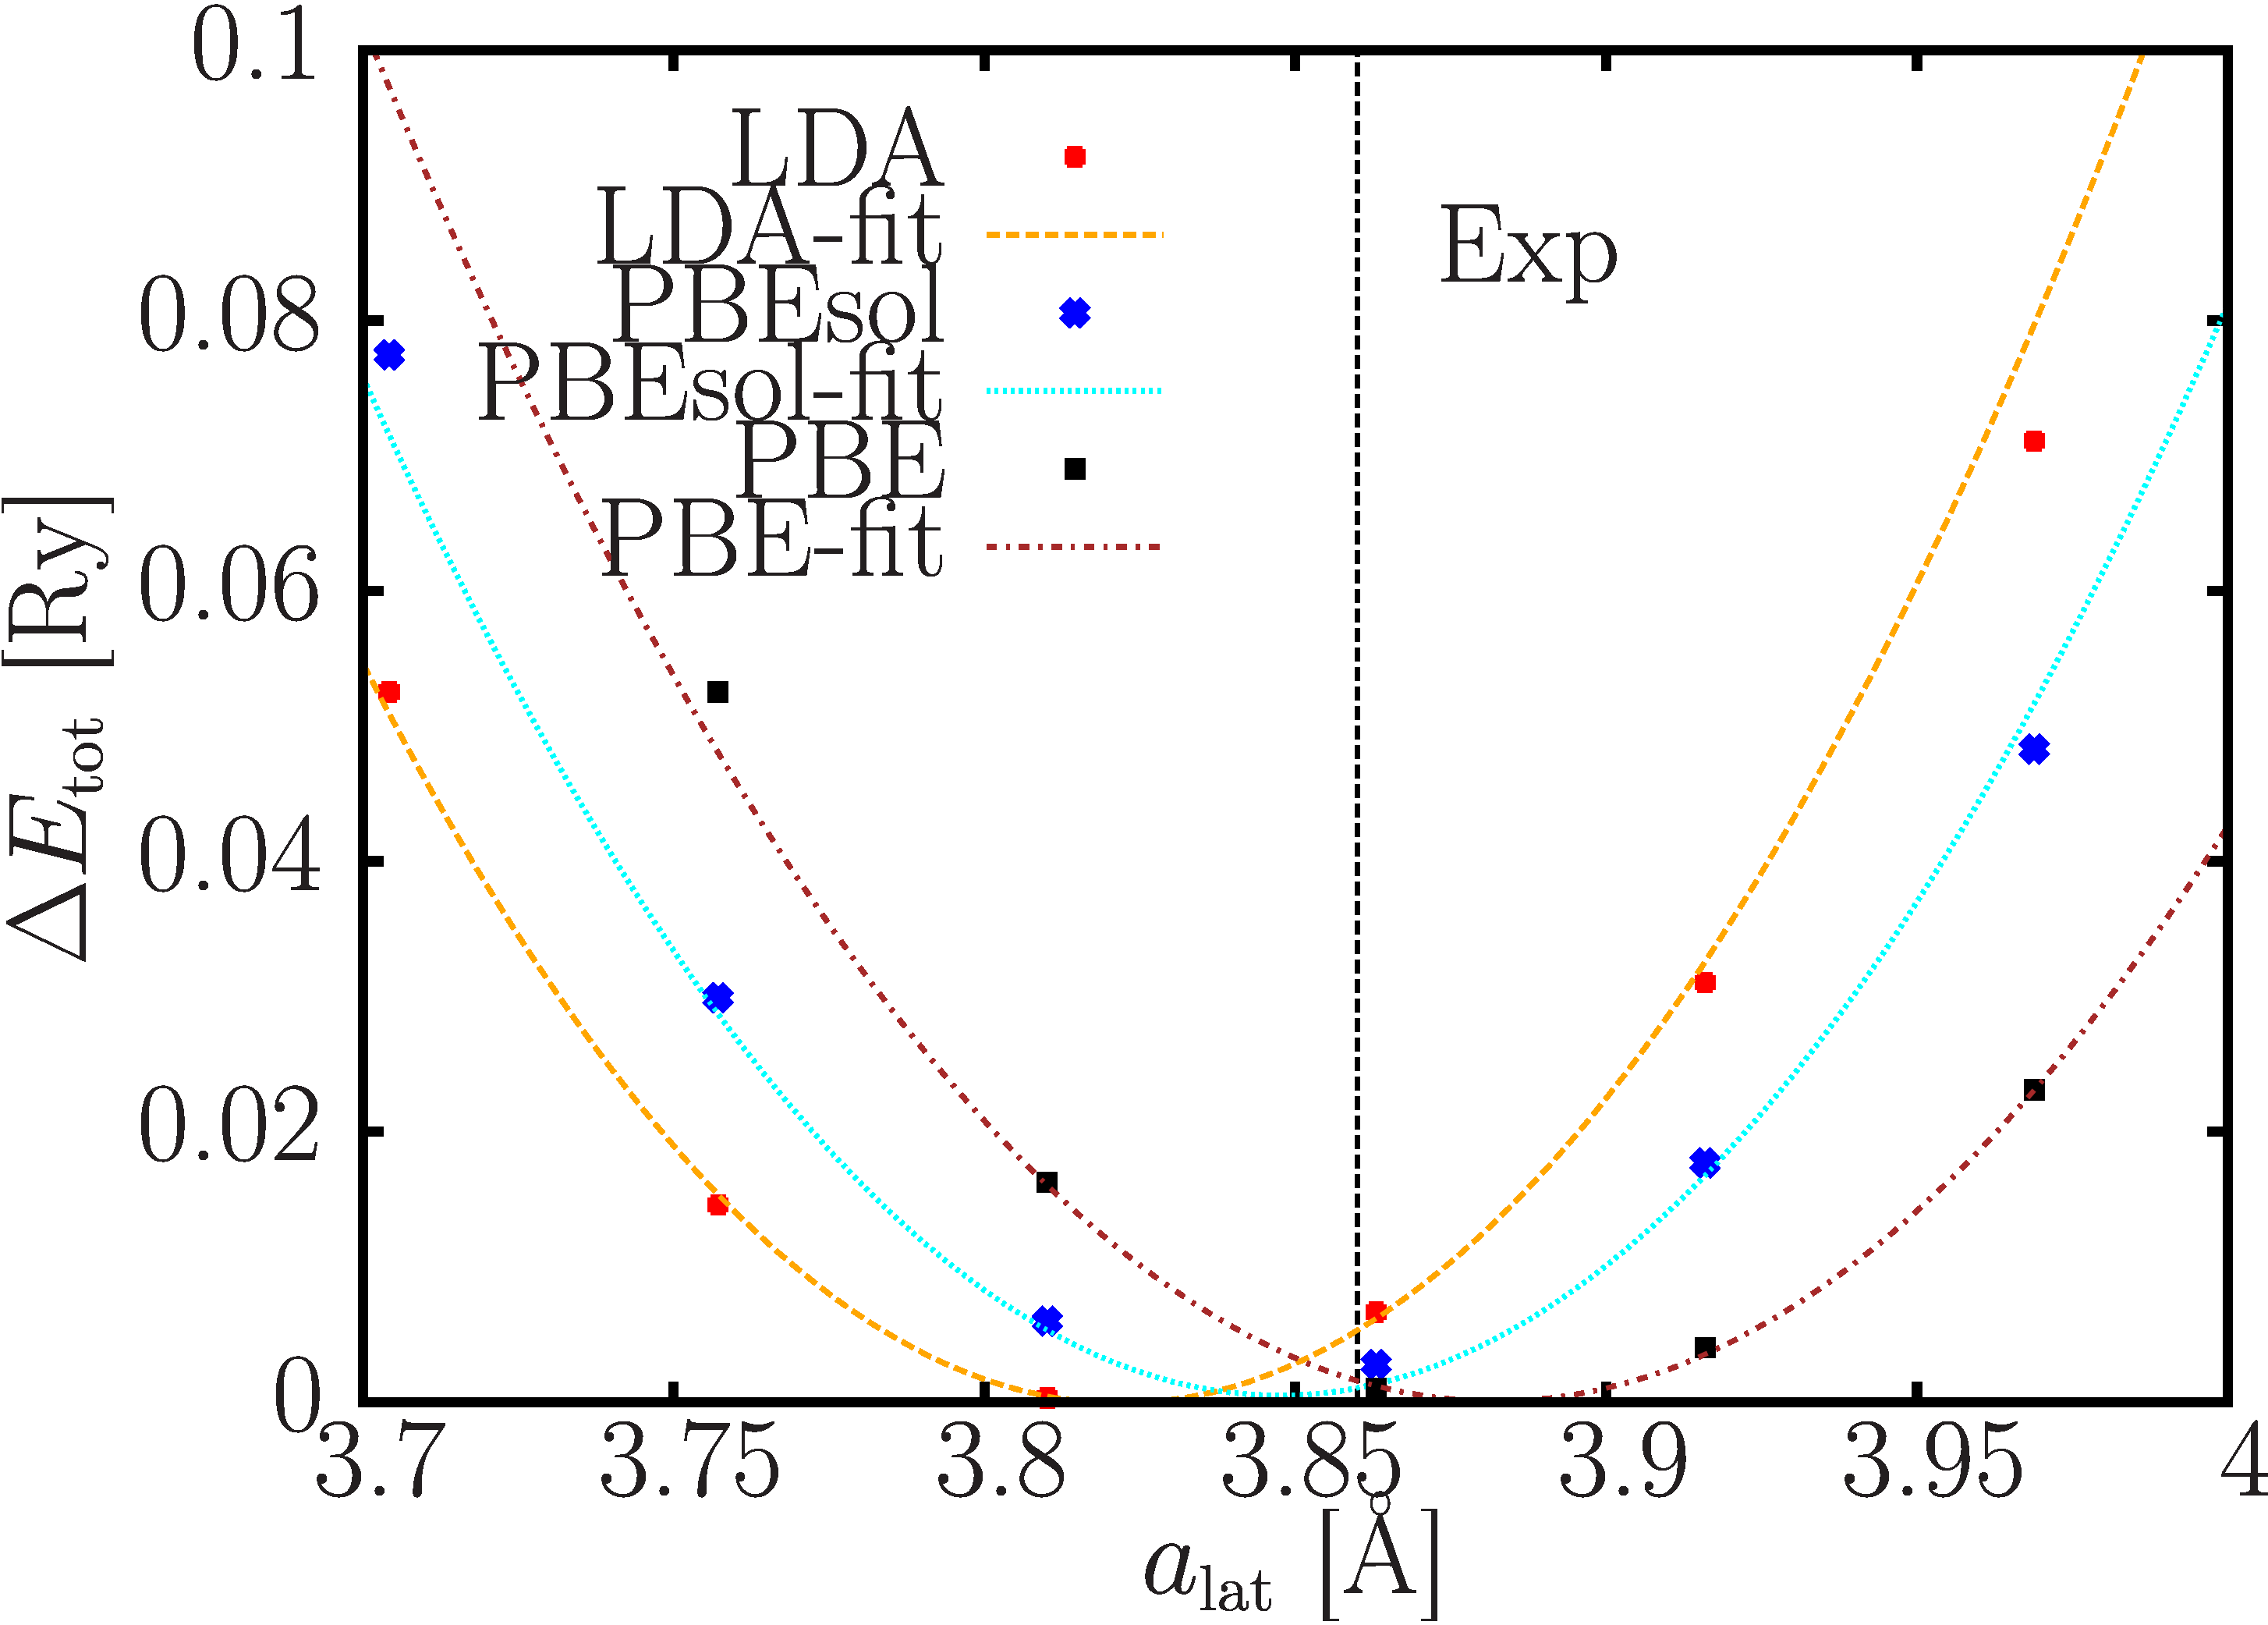
DFT functionals usually disagree in the predicted lattice constant with experiment up to within a few percent. In a bulk geometry, one can let the unit cell relax to represent the minimum in total energy which yields the equilibrium structure. In the present surface geometry, it is particularly important to verify that a strain imposed by the choice of unit cell does not alter the chemical bonding structure since, as opposed to a bulk geometry, the strain on the slab in the z direction is zero due to the vacuum. If all the chemical bonds in the system obey the trend, choosing the experimental lattice constant of cubic STO and using the LDA functional will tend to stretch the slab and planes will move closer together. In Fig. 2 we show the total energy of the surface plus slab geometry (compare Fig. 1, right) as a function of lattice parameter. The total energy depends quadratically on the distance to the optimal value over a rather large range. From the quadratic fits, we determine that equilibrium lattice constants of and Å for LDA,PBEsol and PBE, respectively. It is interesting to note that bulk STO has a lattice constant of ÅCao et al. (2000) while Ref. Li et al., 2015 found a significantly smaller value for the FeSe layer of Å. While this implies a significant expansion as compared to bulk FeSe (compare Tab. 1), it is still much smaller than the bulk STO lattice constant in the cubic phase. The reason is for this discrepancy is, in fact, that the underlying STO is incommensurate with the surface layer and has a slightly larger lattice constant.
As noted earlier, all functionals considered in this work tend to shrink the FeSe in the direction. The energy optimal configuration represents a well defined compromise between these two components of the system. In fact, reducing the STO layer number in the slab to one, we find further reduced optimal values of 3.788, 3.810 and 3.841Å which reflects the growing influence of the FeSe layer.
We take the energy optimal lattice constant as a compromise between bulk and surface stress. In Tab. 2
| [Å] | [Deg] | [Å] | [/u.c] | [/u.c] | [/u.c] | |
|---|---|---|---|---|---|---|
| LDA | 1.201 | 116.79 | 2.860 | 0.407 | -0.395 | -0.363 |
| LDA | 1.242 | 113.97 | 2.860 | 0.371 | -0.356 | -0.329 |
| PBEsol | 1.229 | 115.61 | 2.964 | 0.431 | -0.418 | -0.392 |
| PBEsol | 1.257 | 113.68 | 2.963 | 0.420 | -0.421 | -0.366 |
| PBE | 1.280 | 113.18 | 3.162 | 0.460 | -0.465 | -0.412 |
| PBE | 1.280 | 113.18 | 3.164 | 0.461 | -0.472 | -0.409 |
we show the bonding structure and charge transfer according to a Bader analysis. We find that the bonding distance of the FeSe layer to the slab does not depend on the stress, but significantly on the functional. With the bonding distance being Å and the Fe-Se distance Å we find a step height of 5.26Å in LDA that slightly increases to 5.34Å if the energy optimal lattice constant is used. Both of these values are much too short as compared to the Å measured in the original STM study Wang et al. (2012). Comparison of this step height within PBE and especially PBEsol is much better.
(a)
(b)
a)
b)
c)
d)
While the separation distance of FeSe from the STO substrate does not depend on strain, the FeSe internal structure parameters show significant signs of strain within PBEsol and, even more so, in the LDA when the experimental lattice parameter are used. This is apparent in an opening of the bonding angle and a reduction of the Se height . The energy optimal and experimental lattice parameter are very close for PBE. Performing the calculation with the energy optimal lattice constant, we find more similar structure parameters among the functionals. If the mismatch between calculated layer - and substrate lattice parameter were independent on the functional, the tensile strain should be unaffected whether we perform the calculation in LDA, PBEsol or PBE at an energy optimal lattice parameter. However, we still observe a tendency to open the bonding angle and increase the Se position as compared to the Fe layer changing the functional from PBE to PBEsol and LDA, indicating that the relative tensile strain increases. Without O-vacancies the FeSe layer is nearly neutral within the Bader analysis in all these calculations.
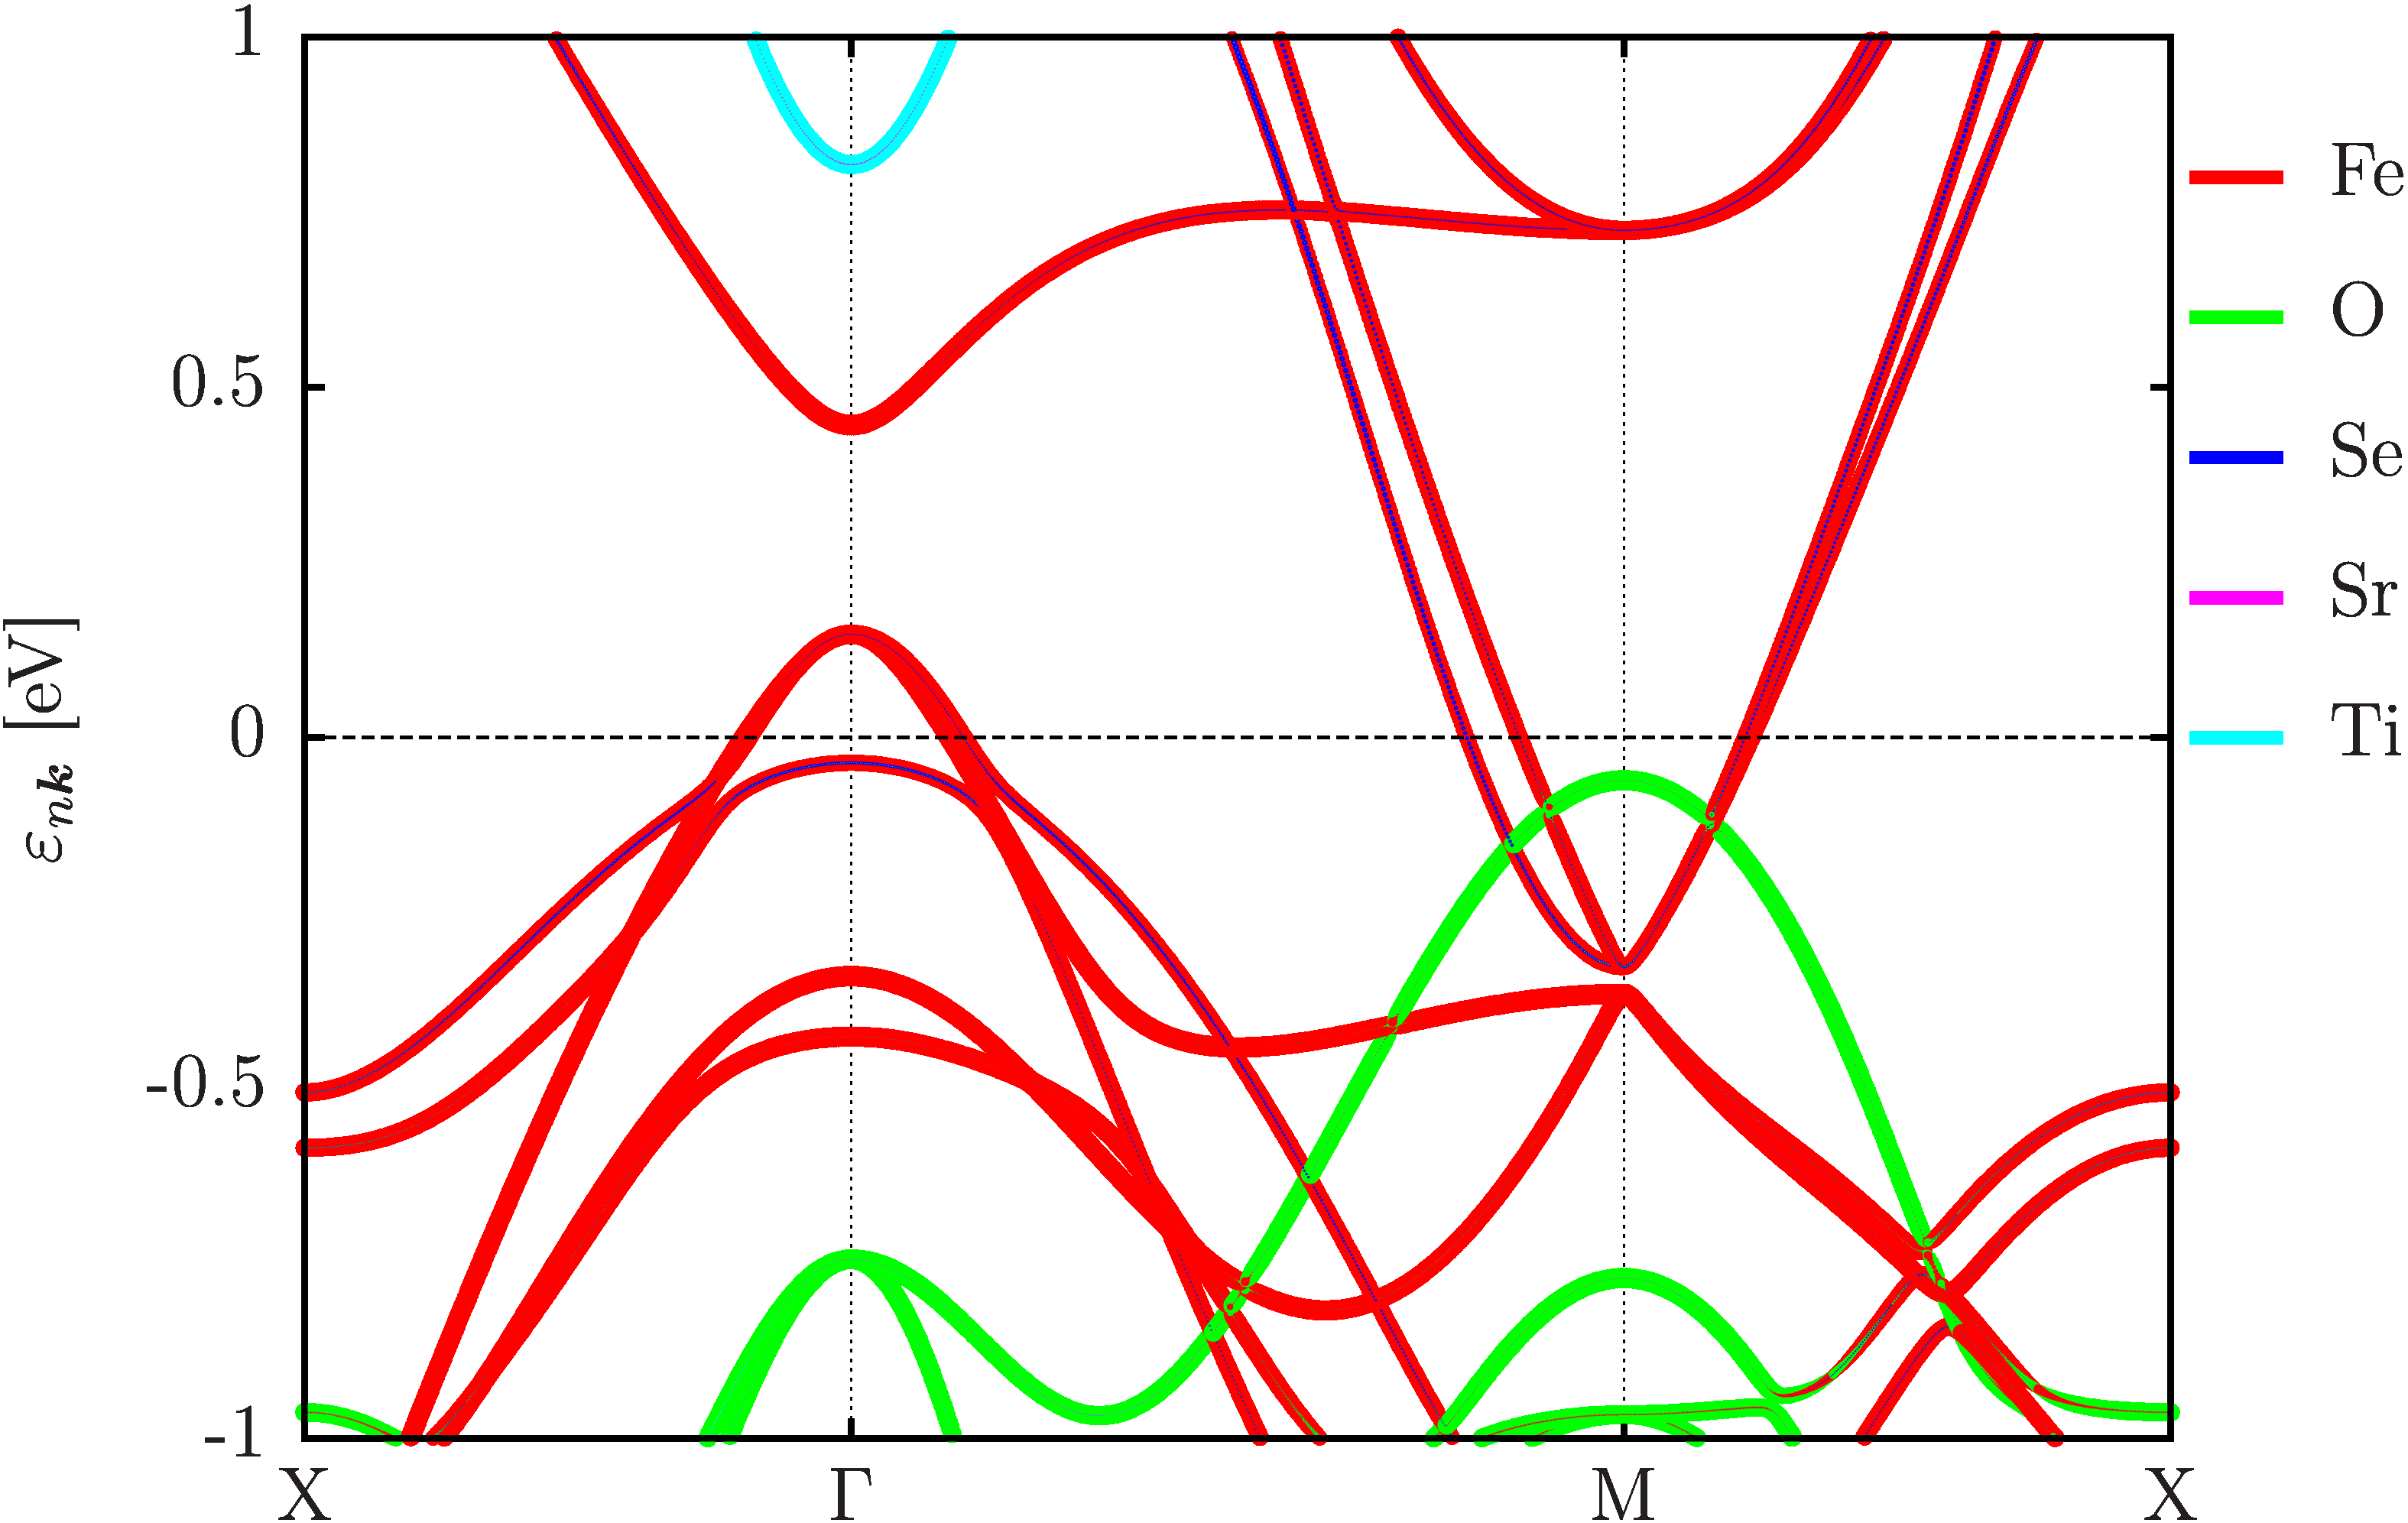
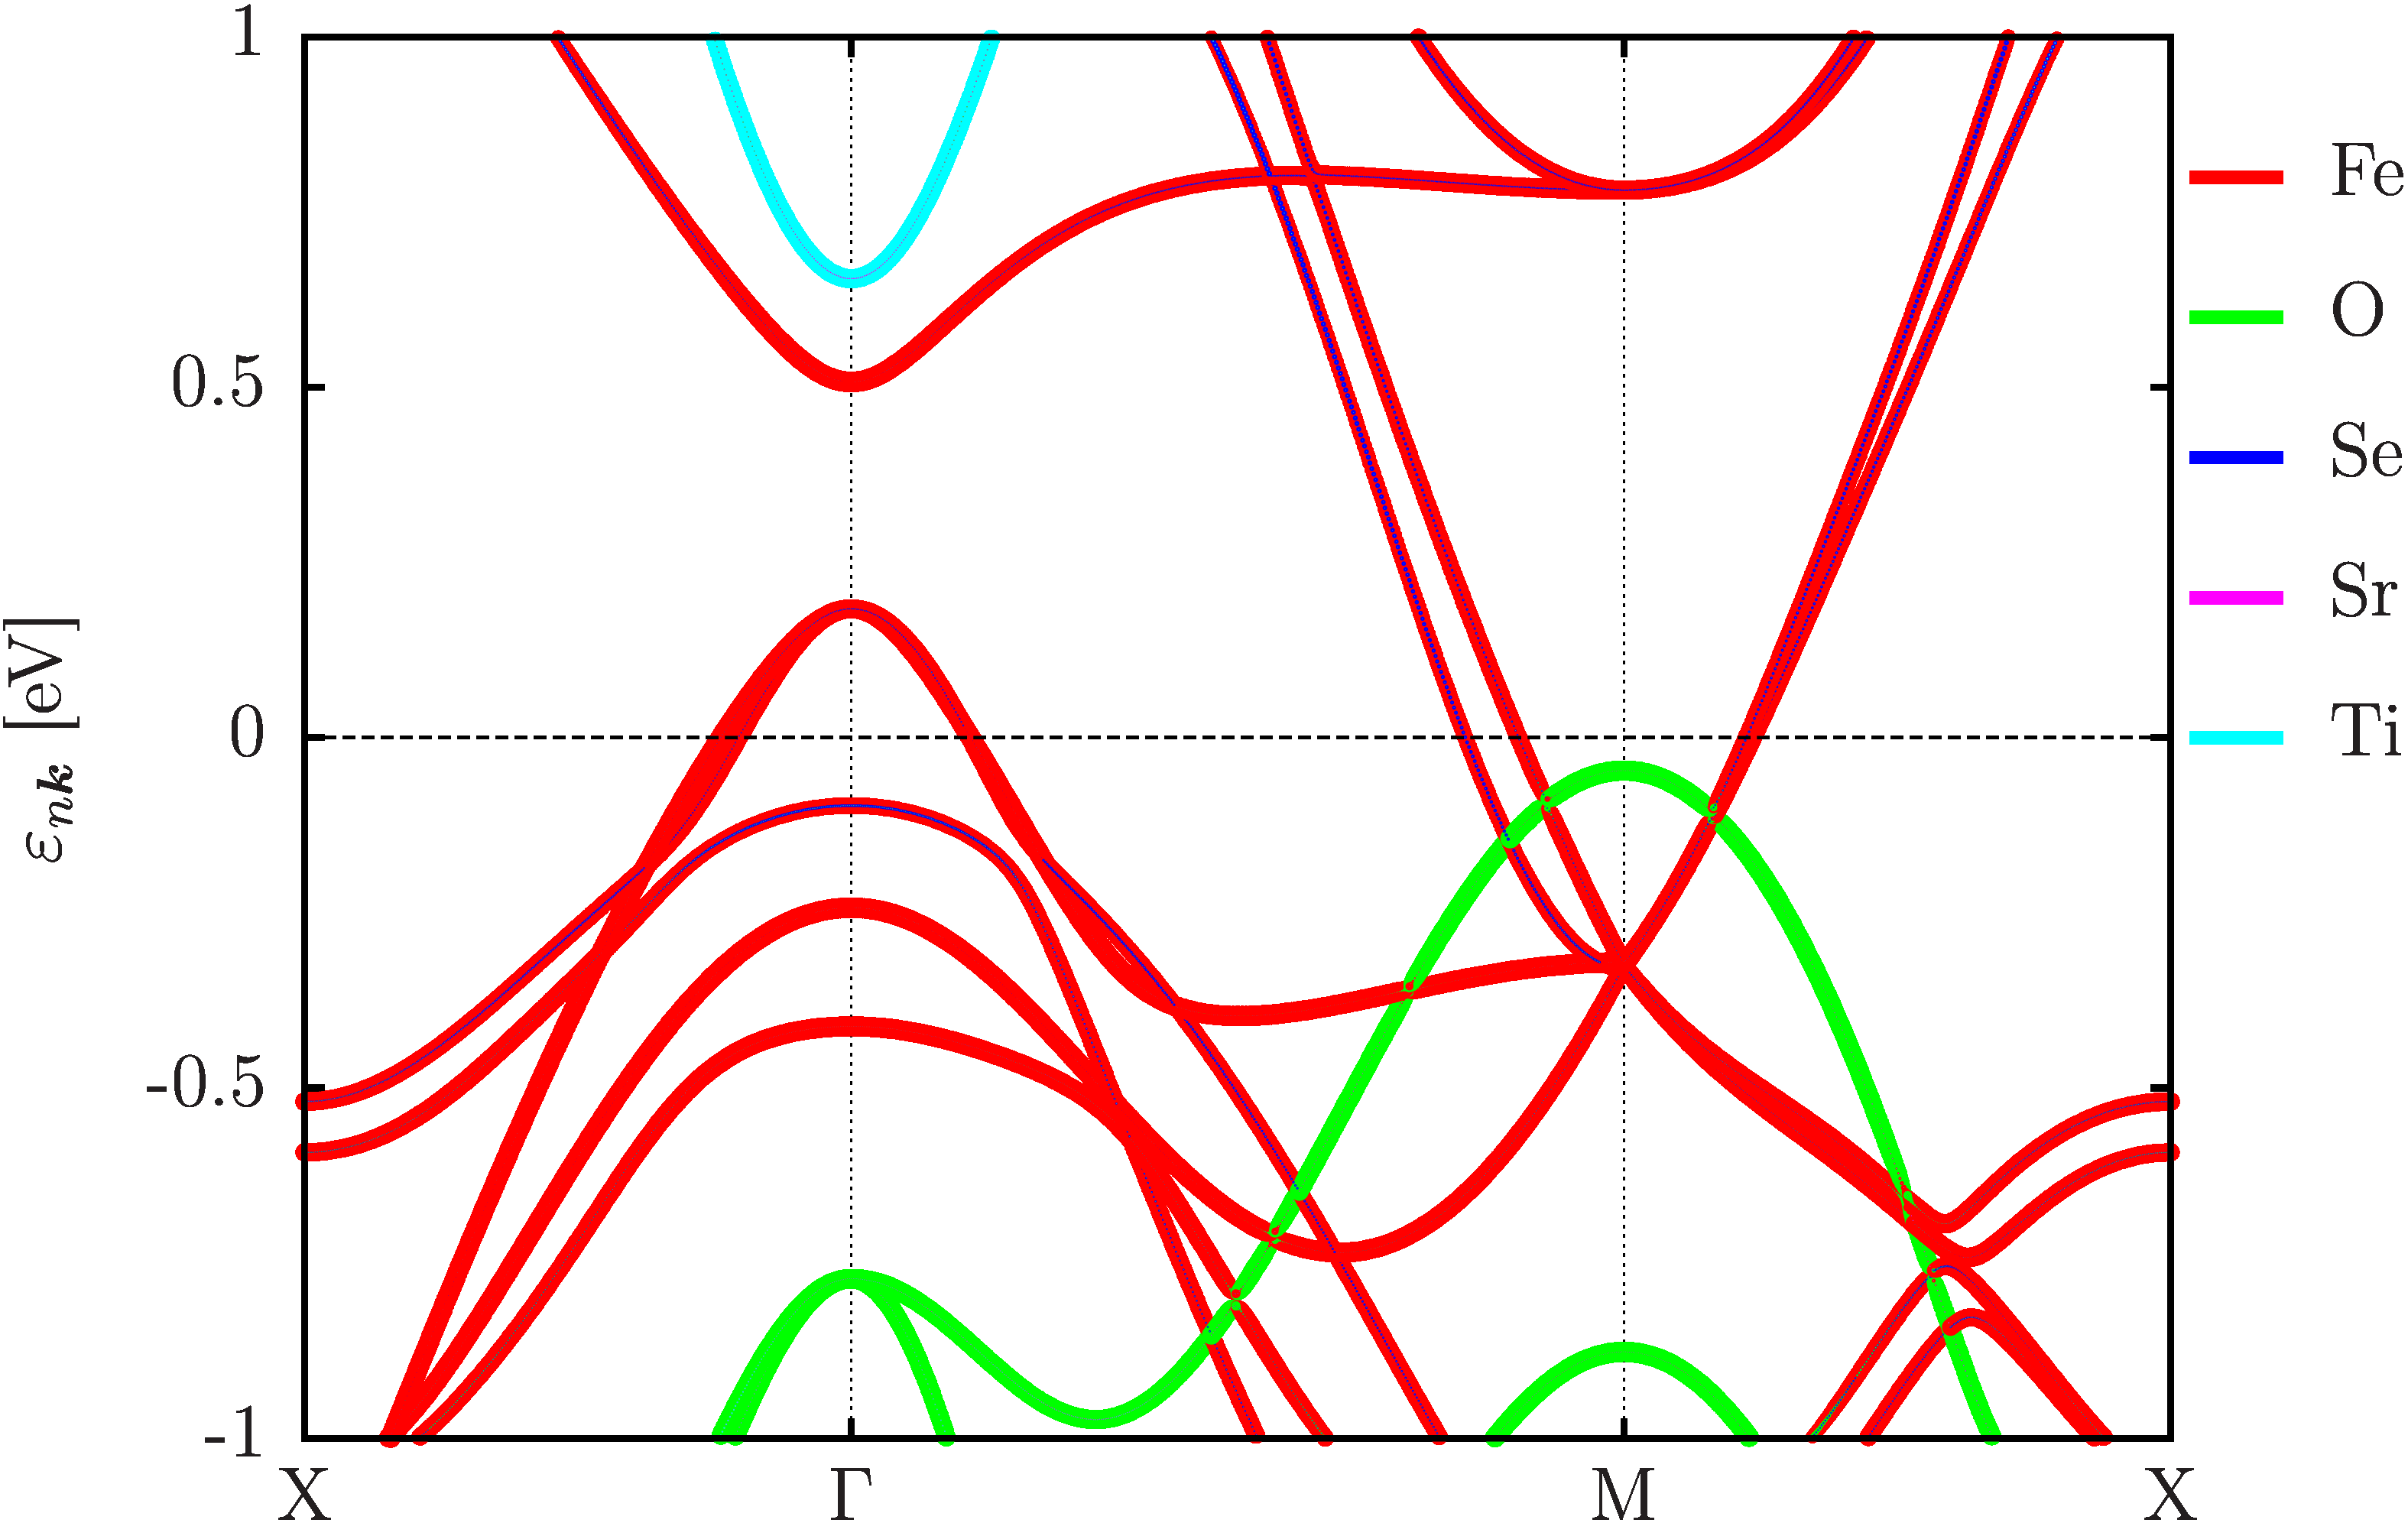
In Fig. 3 we compare the band structure with a projection on atomic orbitals for LDA with (a) and without (b) strain on the unit cell. As can be seen, the hole pocket at becomes slightly bigger as we relax the system while the heavier, filled hole band below the Fermi level moves down in energy. At the M point, the electron pocket slightly moves up in energy as we relax. At the example of LDA, where the differences between energy optimal and experimental lattice parameters are largest, we find that additional strain seems to improve comparison with experiment although this has likely to be attributed to smaller hoppings within the Fe layer and not a better description of the strong interactions in this material.
Because the LDA structure describes neither the STO nor the FeSe correctly, in the following, we focus on the two other functionals PBE and PBEsol. Turning our attention to the magnetic state, in Tab. 3
| [Å] | [Deg] | [Å] | |
| PBE | 1.371 | 109.86 | 3.129 |
| PBEsol | 1.306 | 112.45 | 2.947 |
| Exp NSLi et al. (2015) | 1.330.02 | 111.00.09 | 3.340.05 |
| [/u.c] | [/u.c] | [/u.c] | |
| PBE | 0.570 | -0.560 | -0.530 |
| PBEsol | 0.527 | -0.526 | -0.483 |
we give the structural and charge analysis. We fix the lattice constant to the experimental cubic STO bulk value of Å. The total size of the 1 unit cell thick layer is computed to be 5.87 and 5.56Å which, especially for PBEsol compares well with the original measurement of 5.5Å in Ref. Wang et al., 2012. However, comparison with recent experimental dataLi et al. (2015) reveals that the binding distance of the layer from the substrate is too short while the structural parameters for the layer itself appear to be somewhat in between the results for PBEsol and PBE. Comparison may be complicated, because for example the vacancy concentration in the normal state is unknown while our calculation assumes the stoichiometric structure.
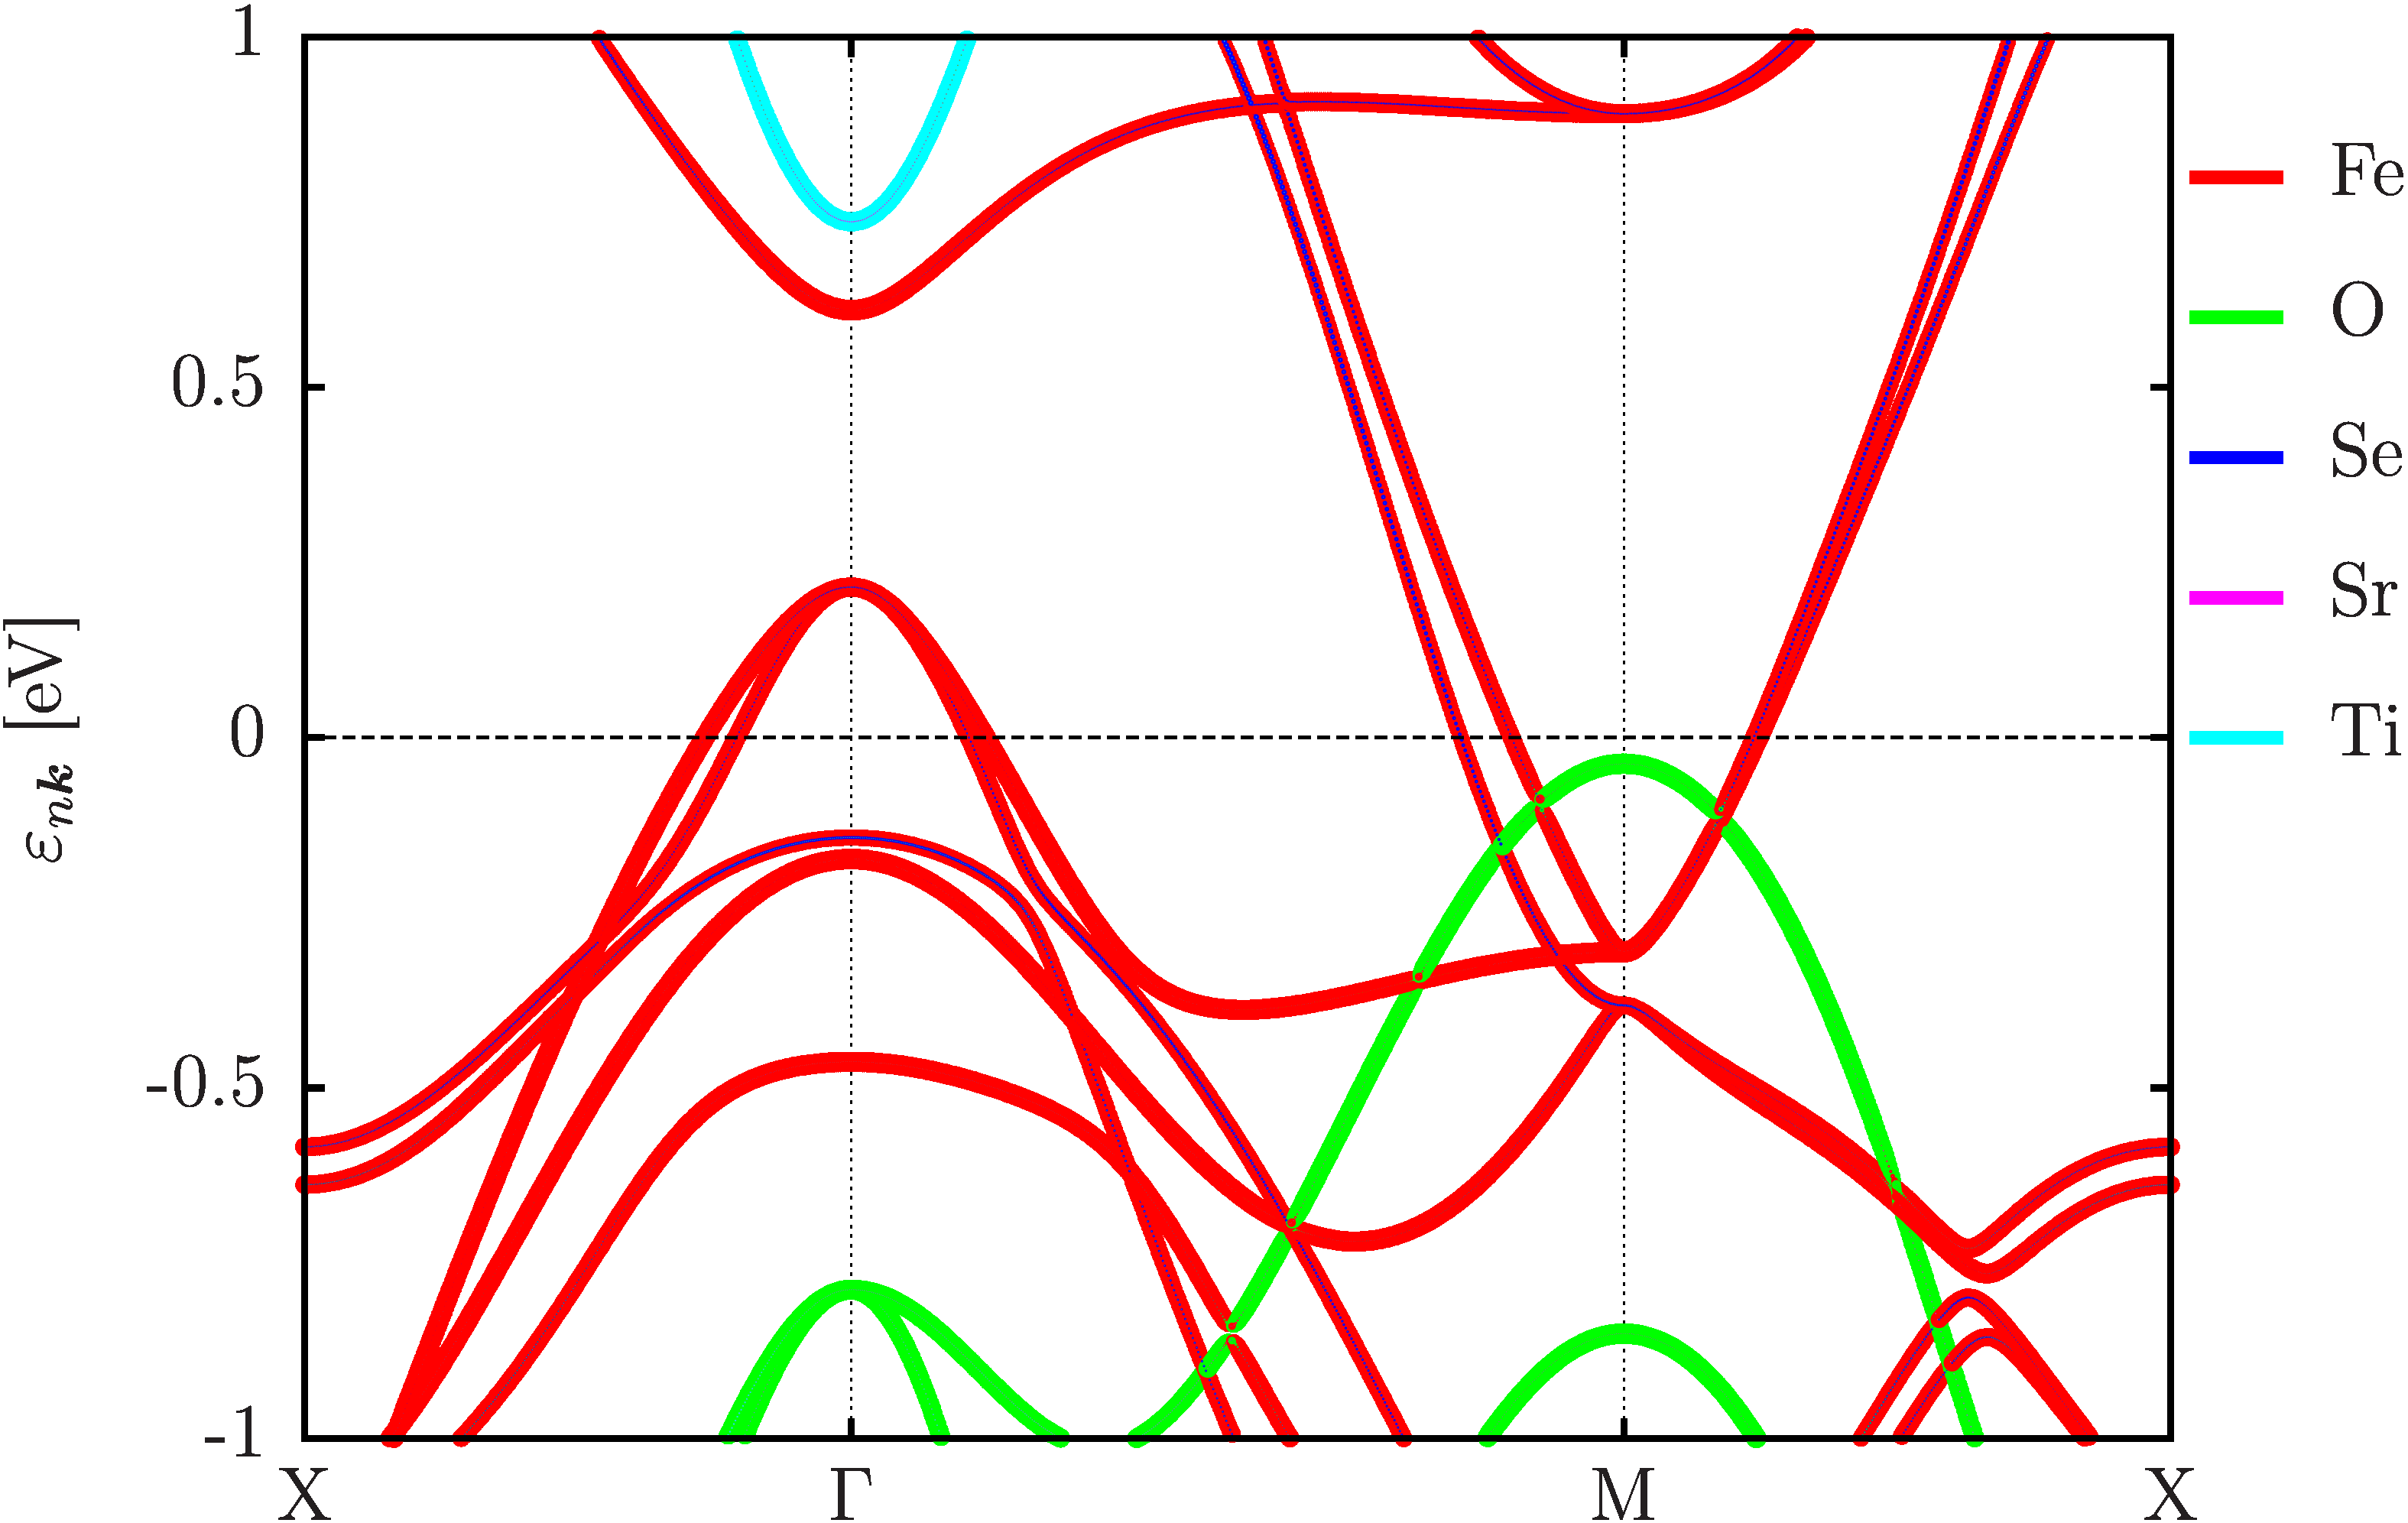
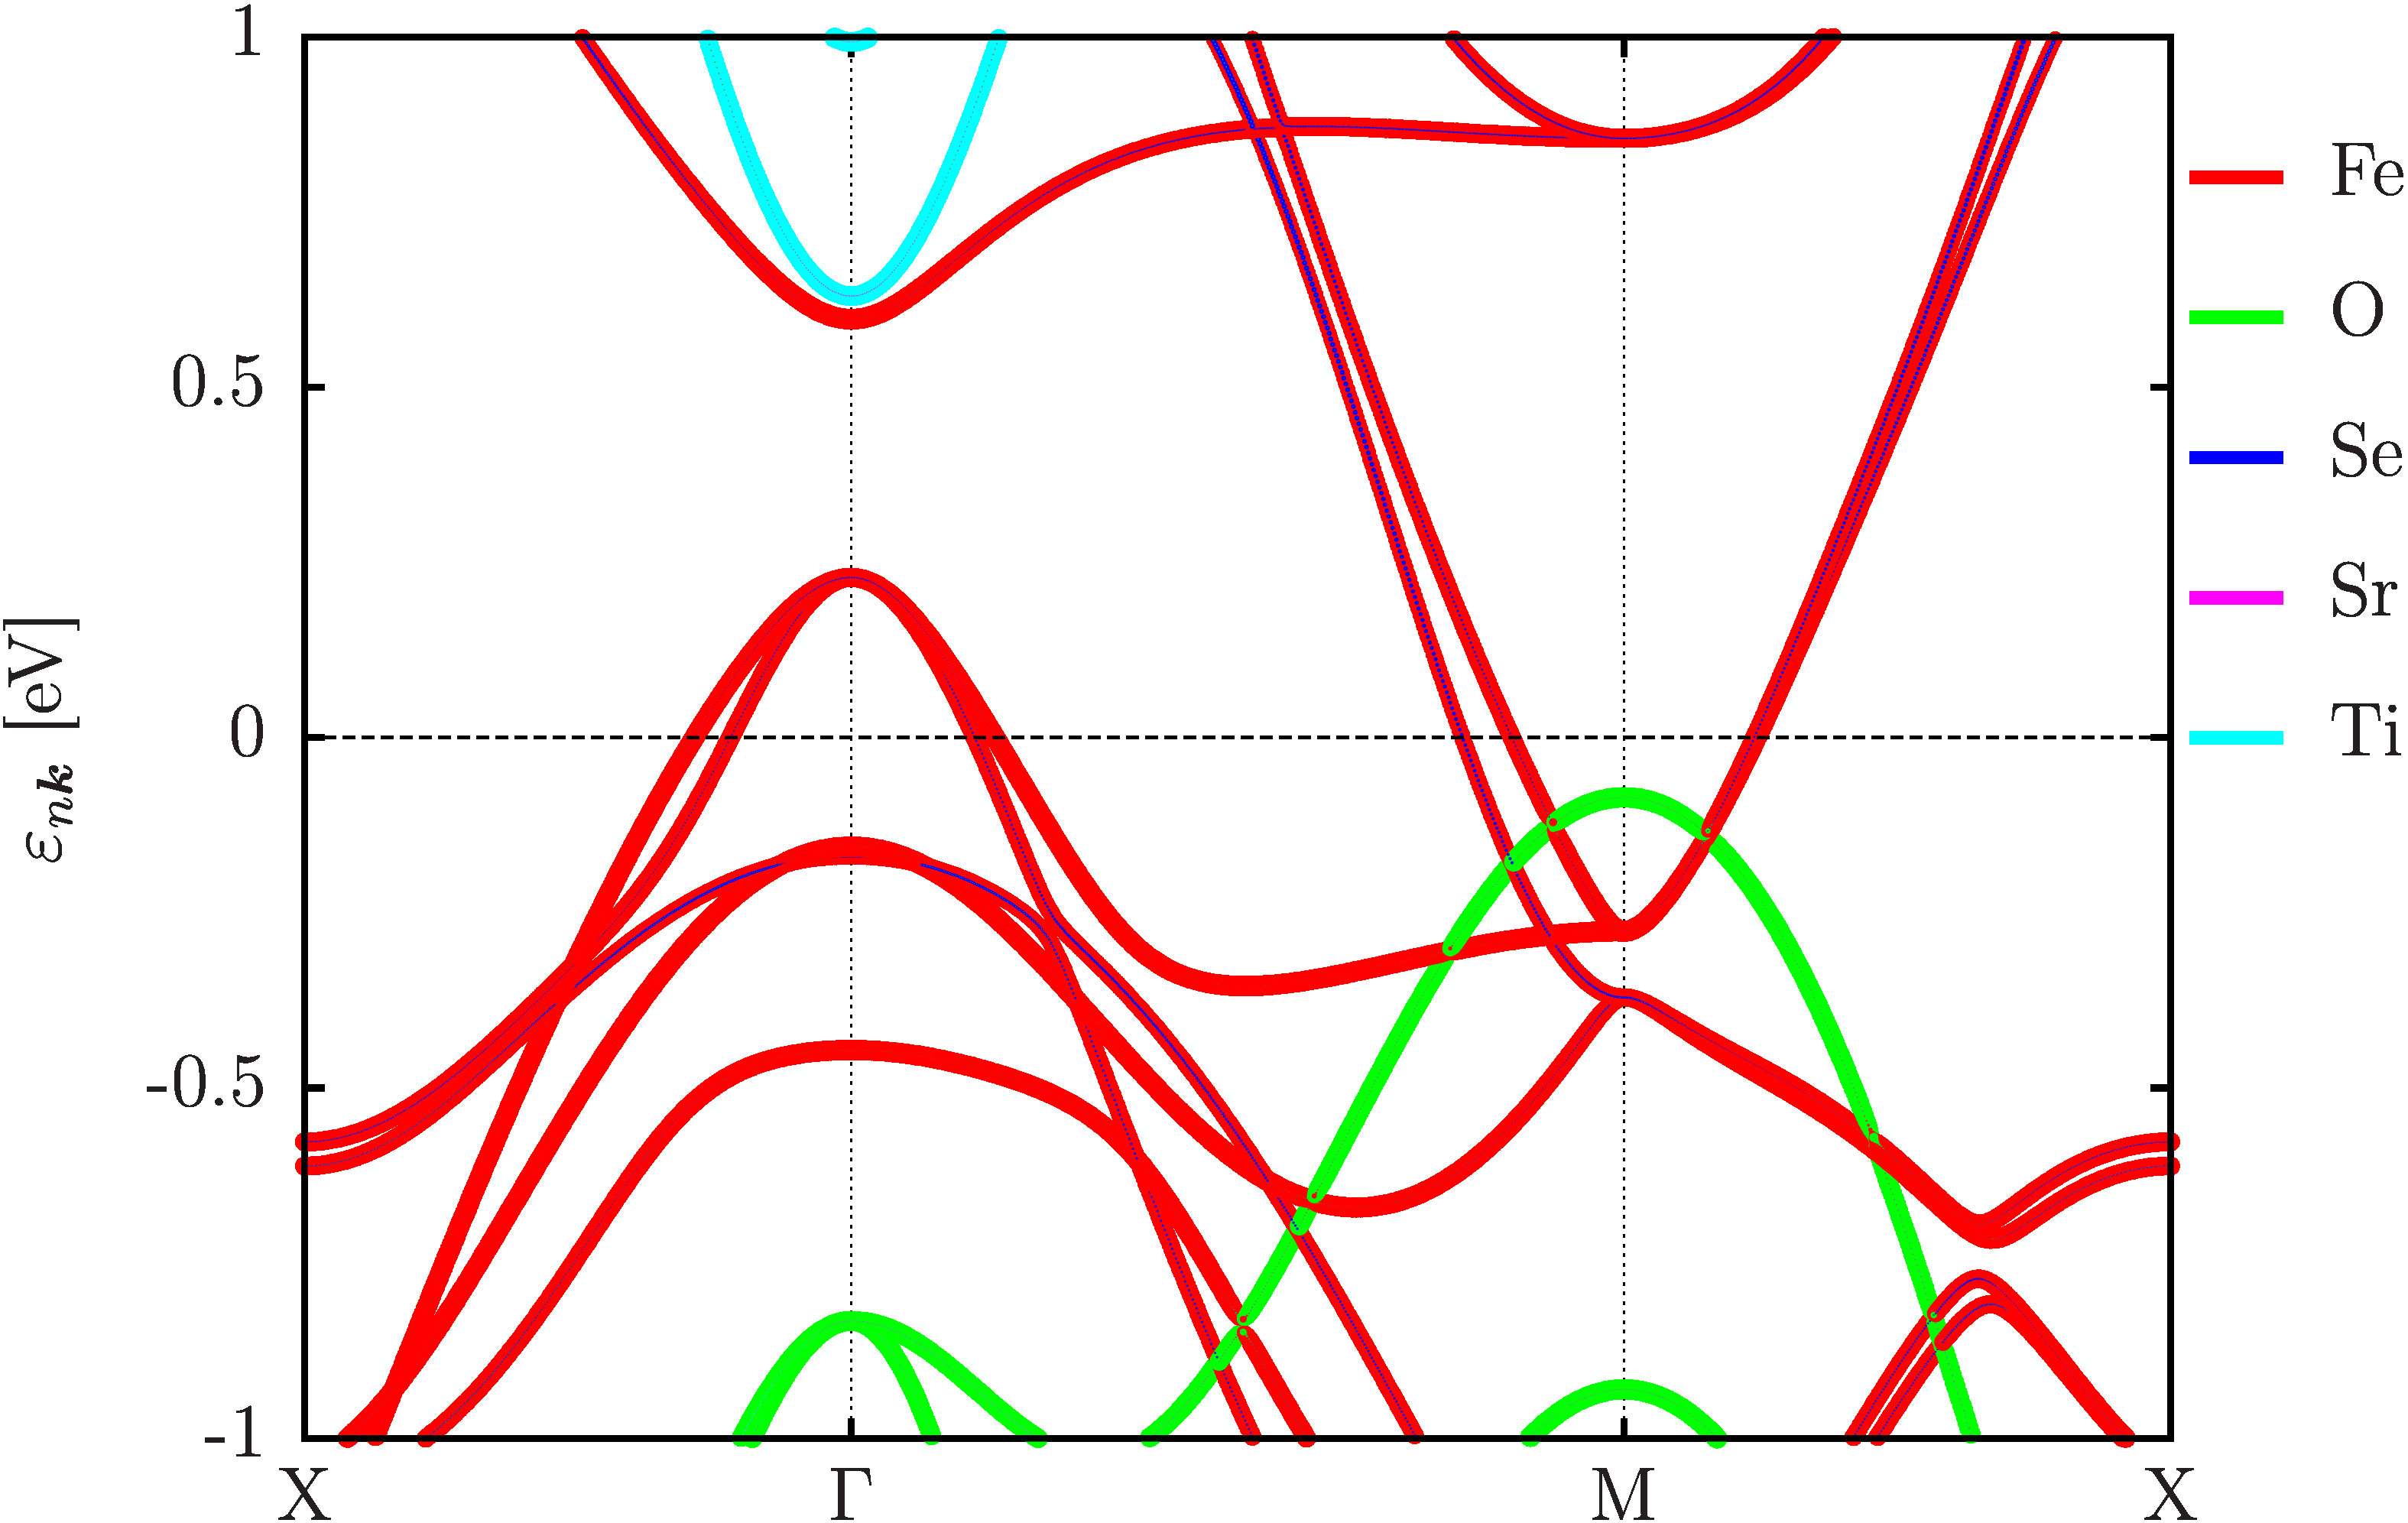
In Fig. 4, we compare the magnetic and non-magnetic electronic bands within PBEsol and PBE at their respective energy optimal lattice configuration. We find that the differences between PBE and PBEsol are minor. Allowing for an AFM state where we use the experimental lattice parameters, on the other hand strongly shifts down the hole band and the resulting band structure compare much better with ARPES dataLee et al. (2014) than the NM data. PBE shows a slightly higher Fermi level than PBEsol, thus making the agreement even better.
VI Oxygen vacancies
In the following we want to investigate the effects of oxygen vacancies. In order to allow for a more continuous variation of the concentrations, also with access to low deficiency percentages that within the super cell approach are beyond our computational power, we use the VCA.
It is not straight forward to simulate the absence of an atom within the VCA. Ref. Shanavas and Singh, 2015 used a virtual mixture of 20% of F with O to achieve an excess charge that turned out to electron-dope the FeSe layer. However, while this replacement may simulate the effective charge doping well, the local disordered potential of the interface is likely different. Alternatively one could change the nuclear number of e.g. the Ti atoms to simulate dangling bonds due to the presence of vacancies Richter et al. (2013). Here, we choose to mix the oxygen pseudo potential with vacuum, i.e. we scale the potential and the charge with a parameter .
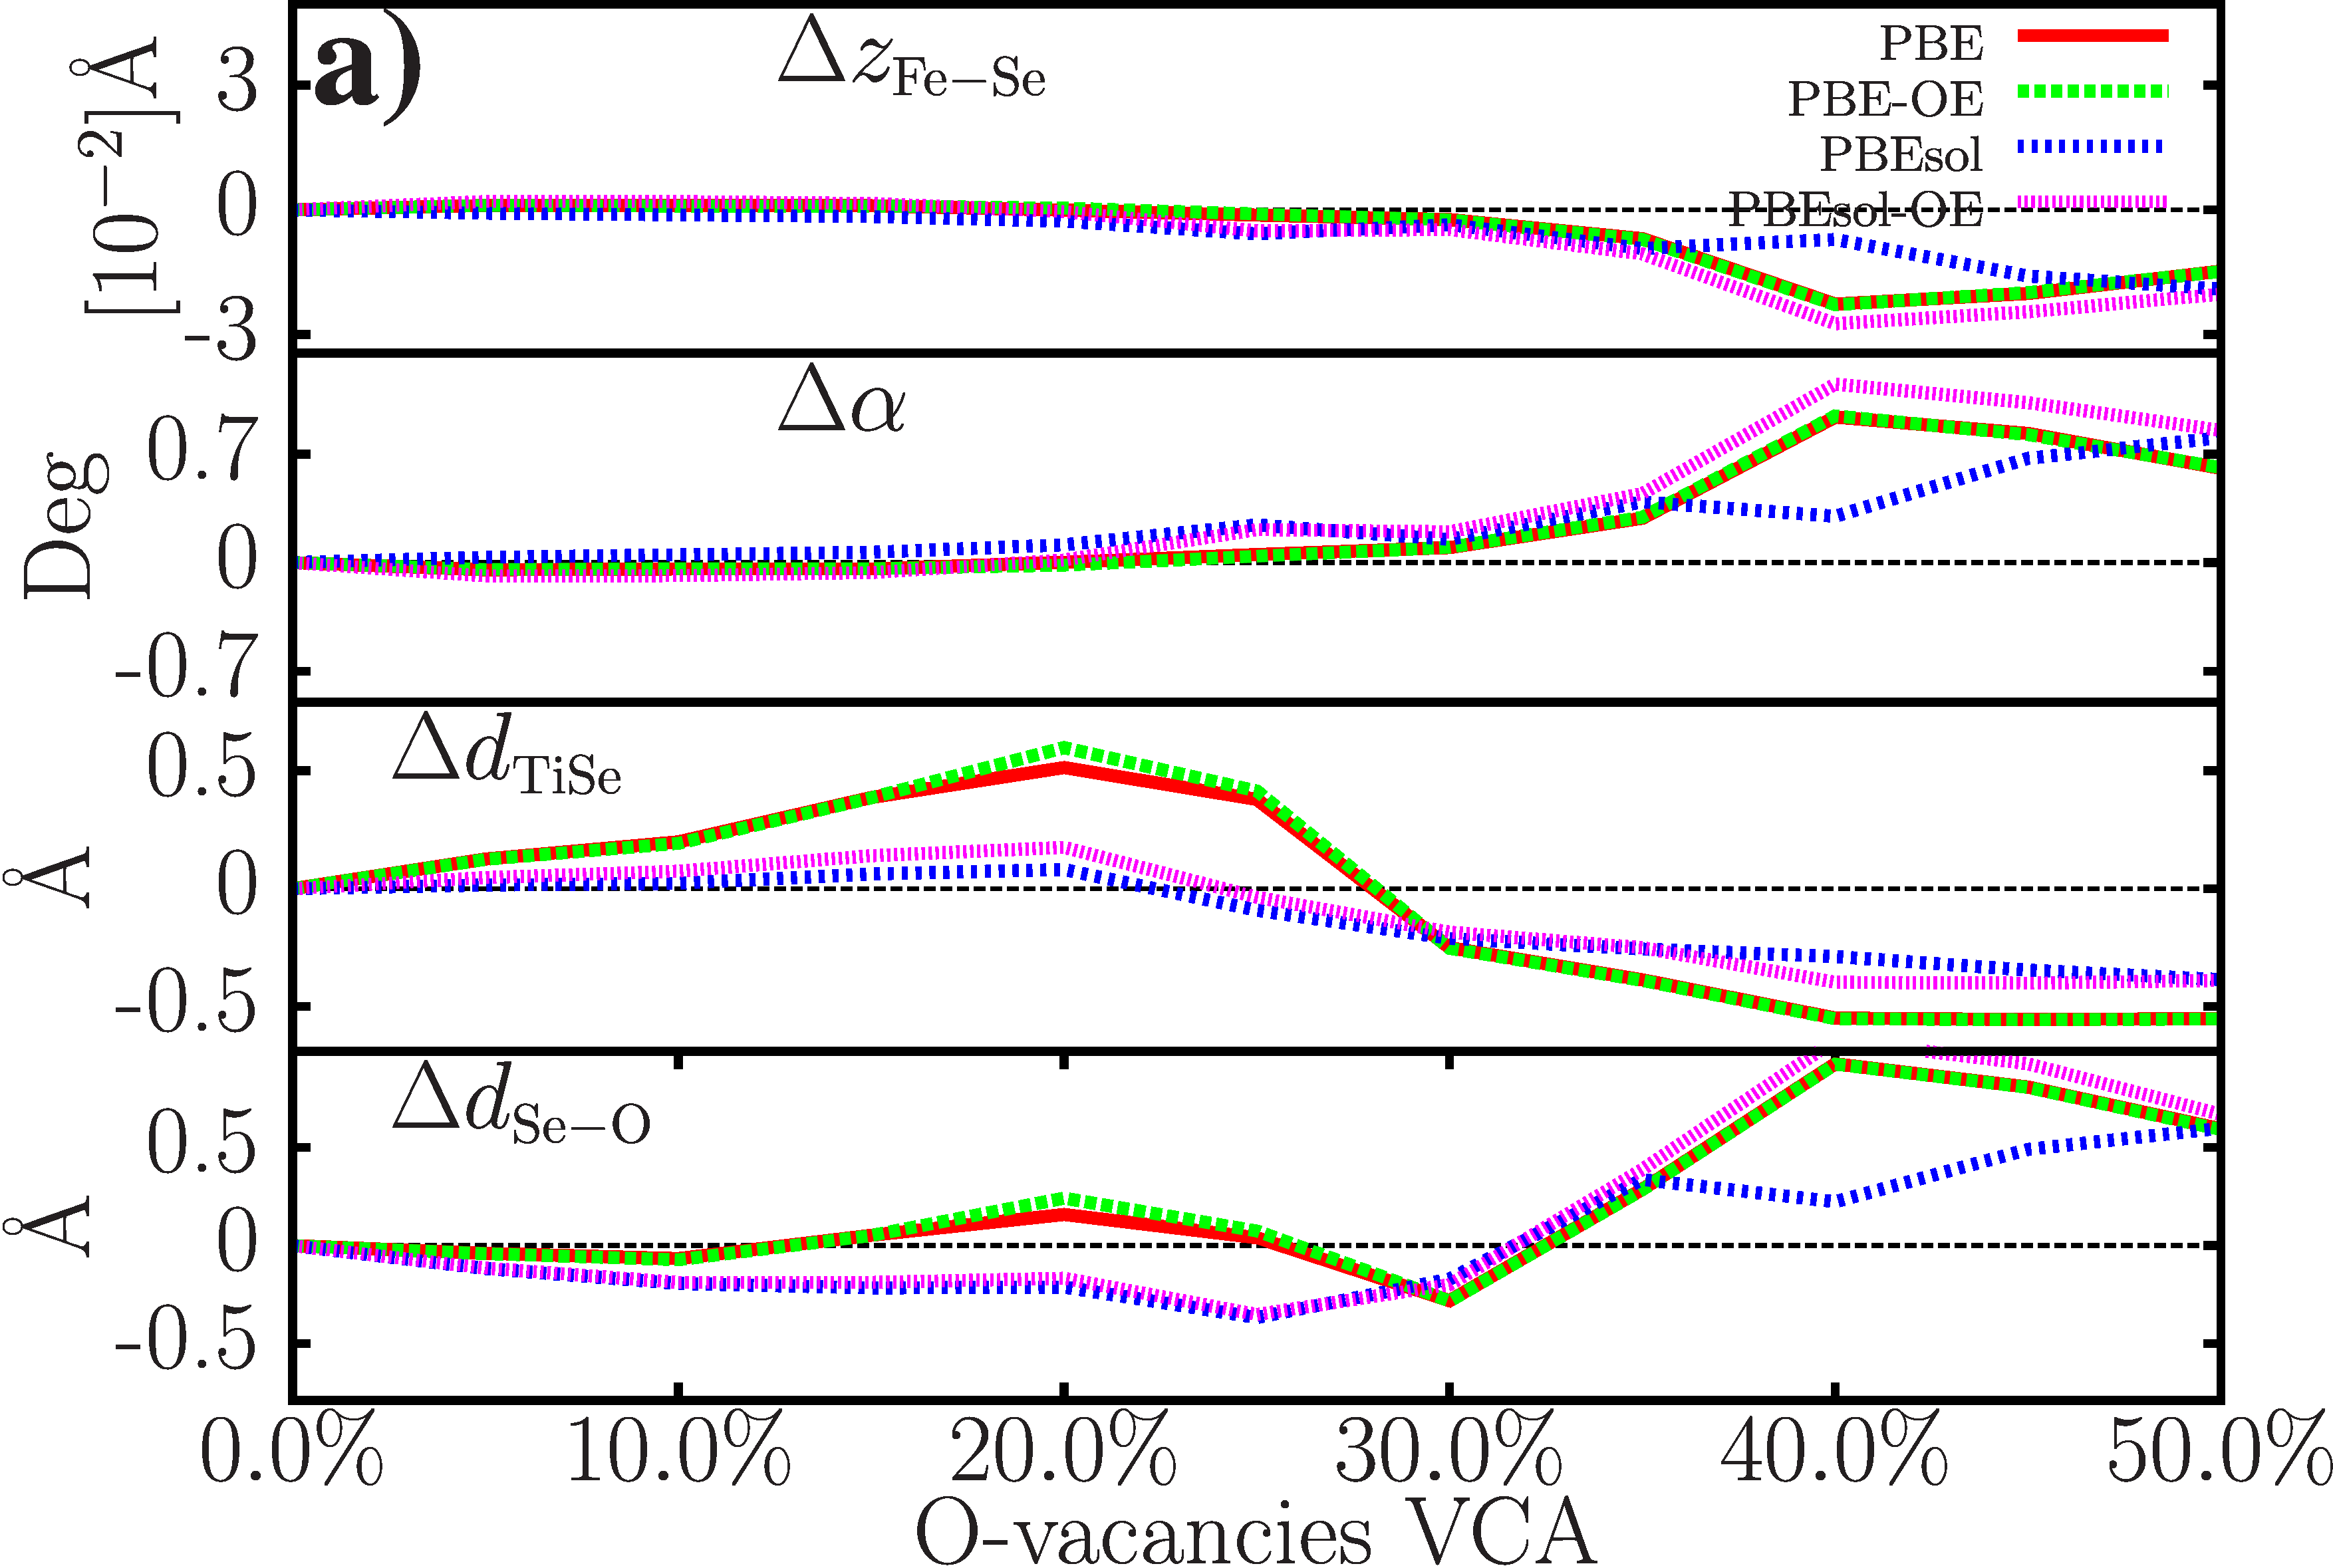
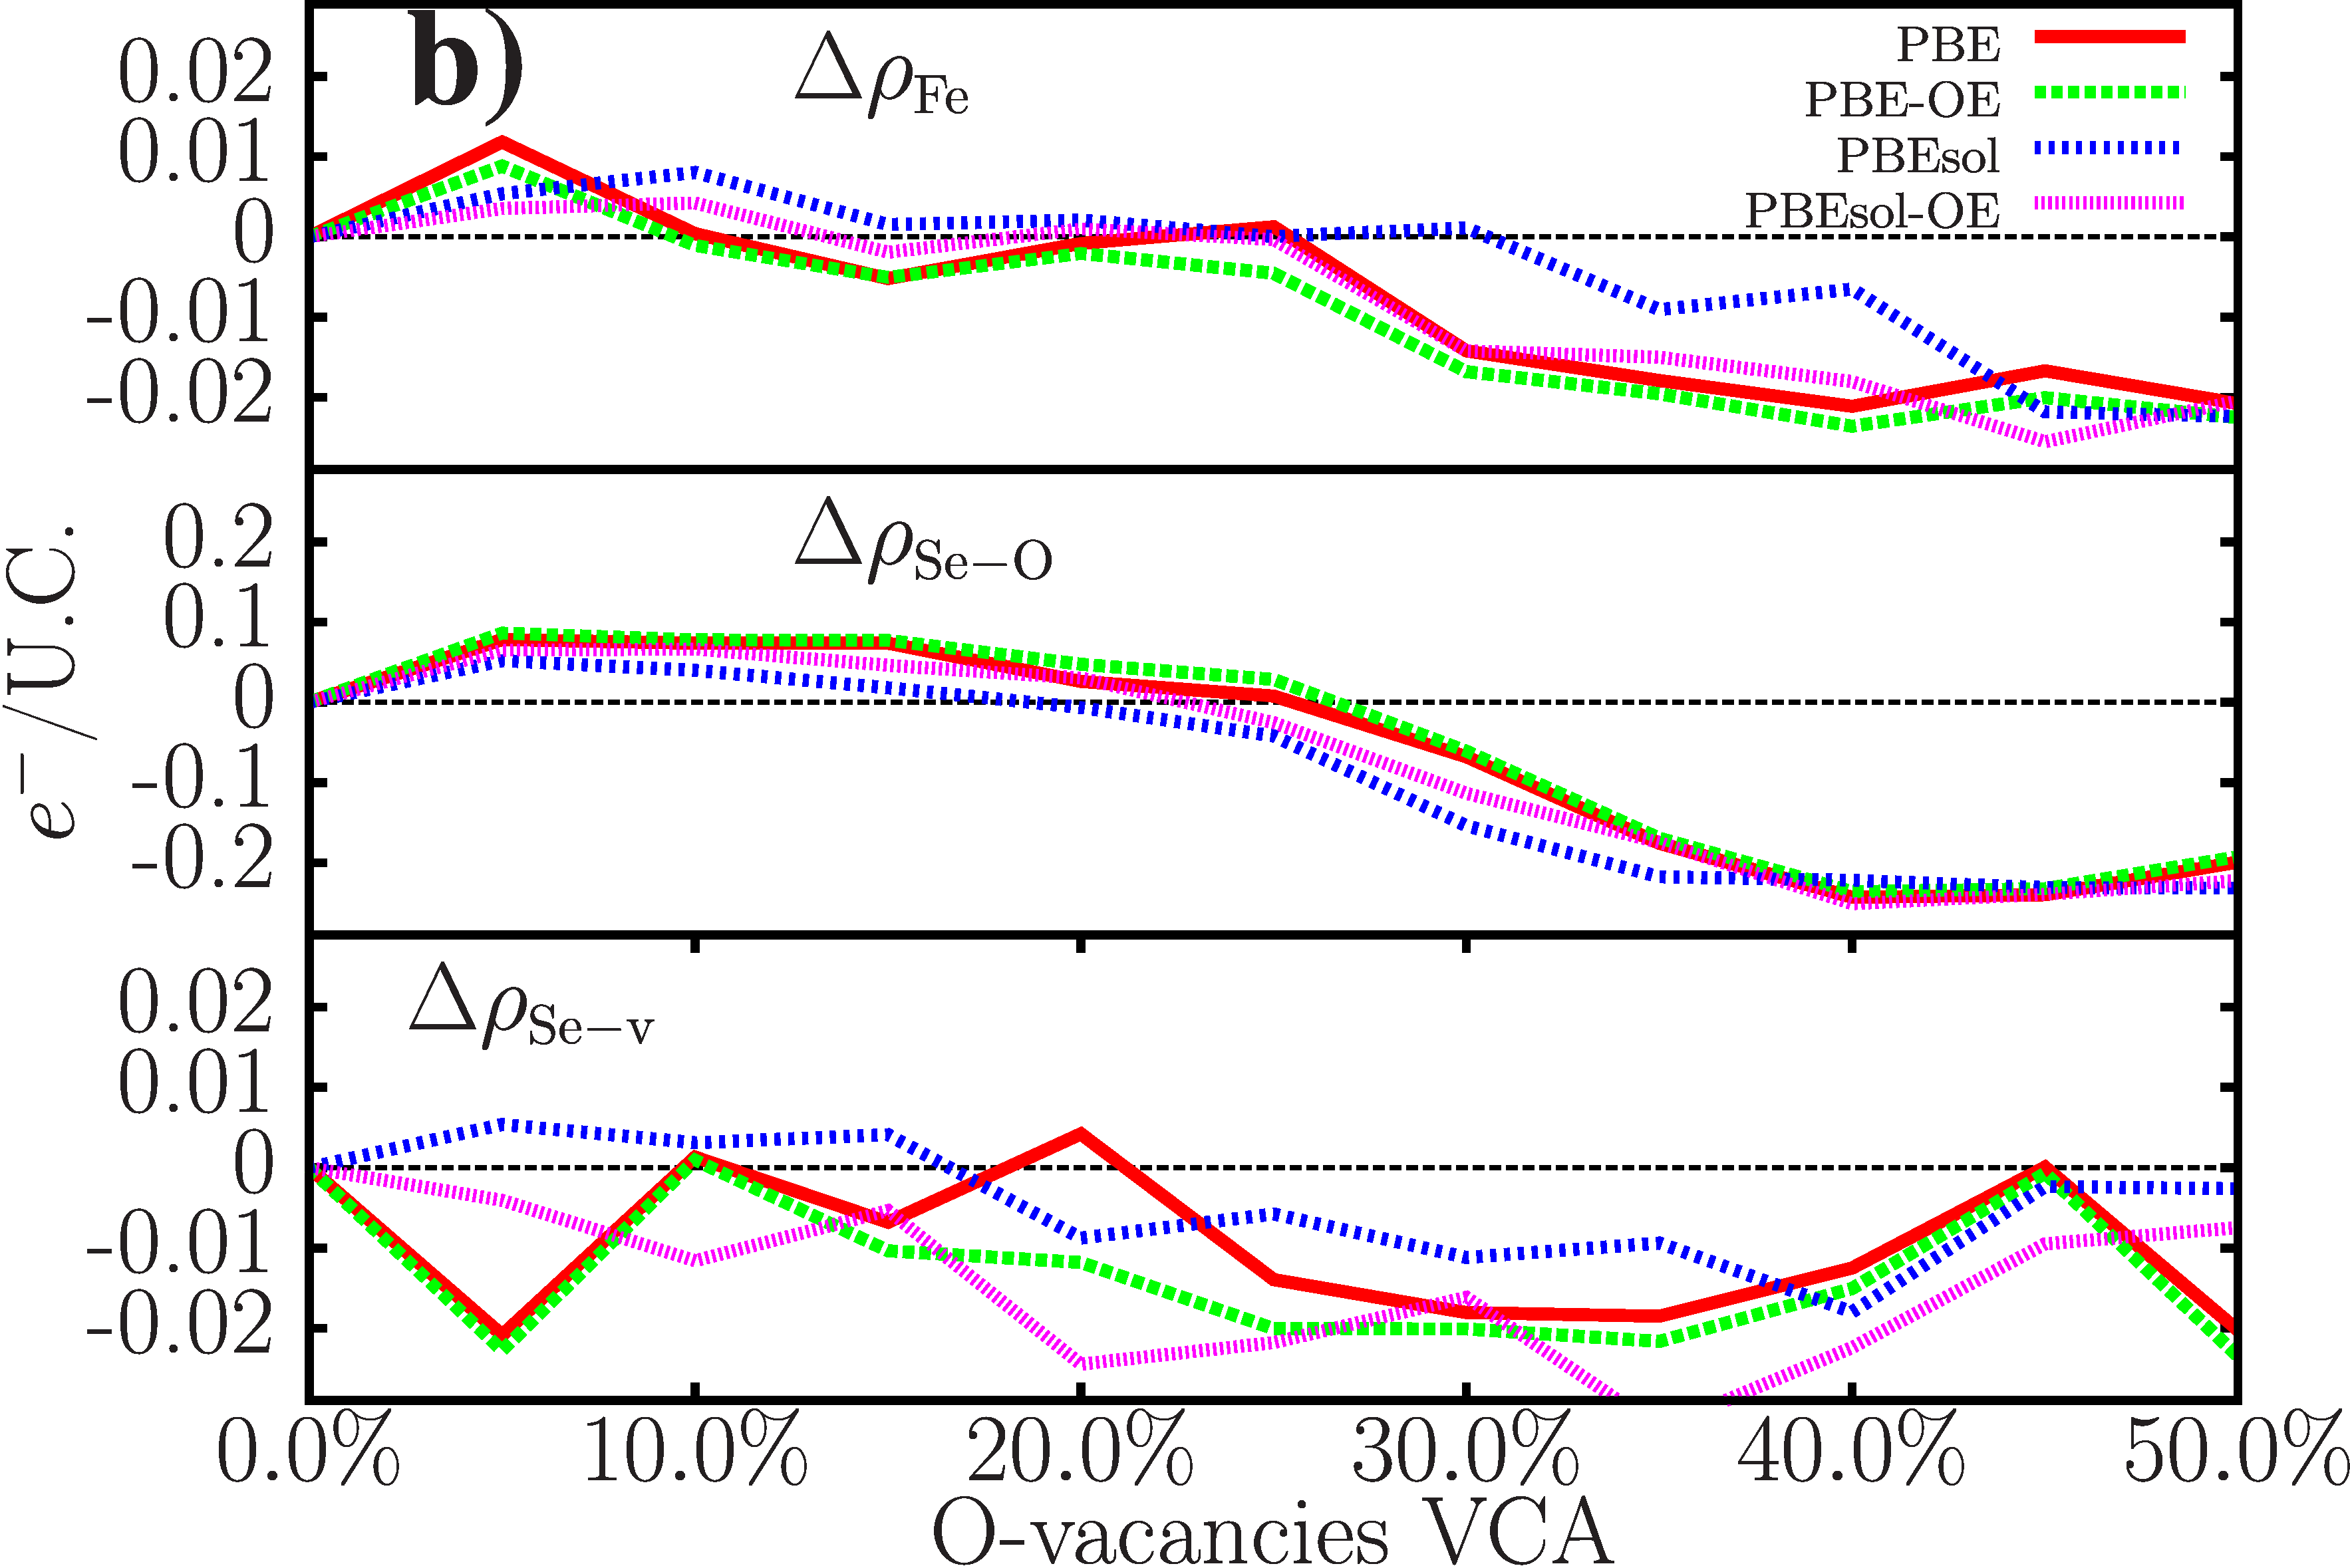
All the atoms in the top STO layer are replaced with this virtual potential. The evolution of the structure parameters of the interface are shown in Fig. 5. We subtract from a value shown in Fig. 5 the value at zero percentage such as . As can be seen, the variations of the FeSe internal structural parameters are almost unaffected by the vacancy doping for low concentrations. As an interesting effect, we find that instead of binding closer, at first for low vacancy concentrations, the FeSe moves away from the substrate upon vacancy doping. This trend is most pronounced in PBE, even though PBEsol also shows this behavior. Then, at an already large concentration of , the trend is reversed and the binding distance shortens again. We show the difference as a function of vacancy doping. follows and thereby reflects the fact, that the layer shifts upwards while the substrate remains intact. At about %, starts increasing while decreases. This points out that the Ti binds to Se and not any more to O. This may have to be attributed to our unrealistic description of the potential in this region by the VCA.
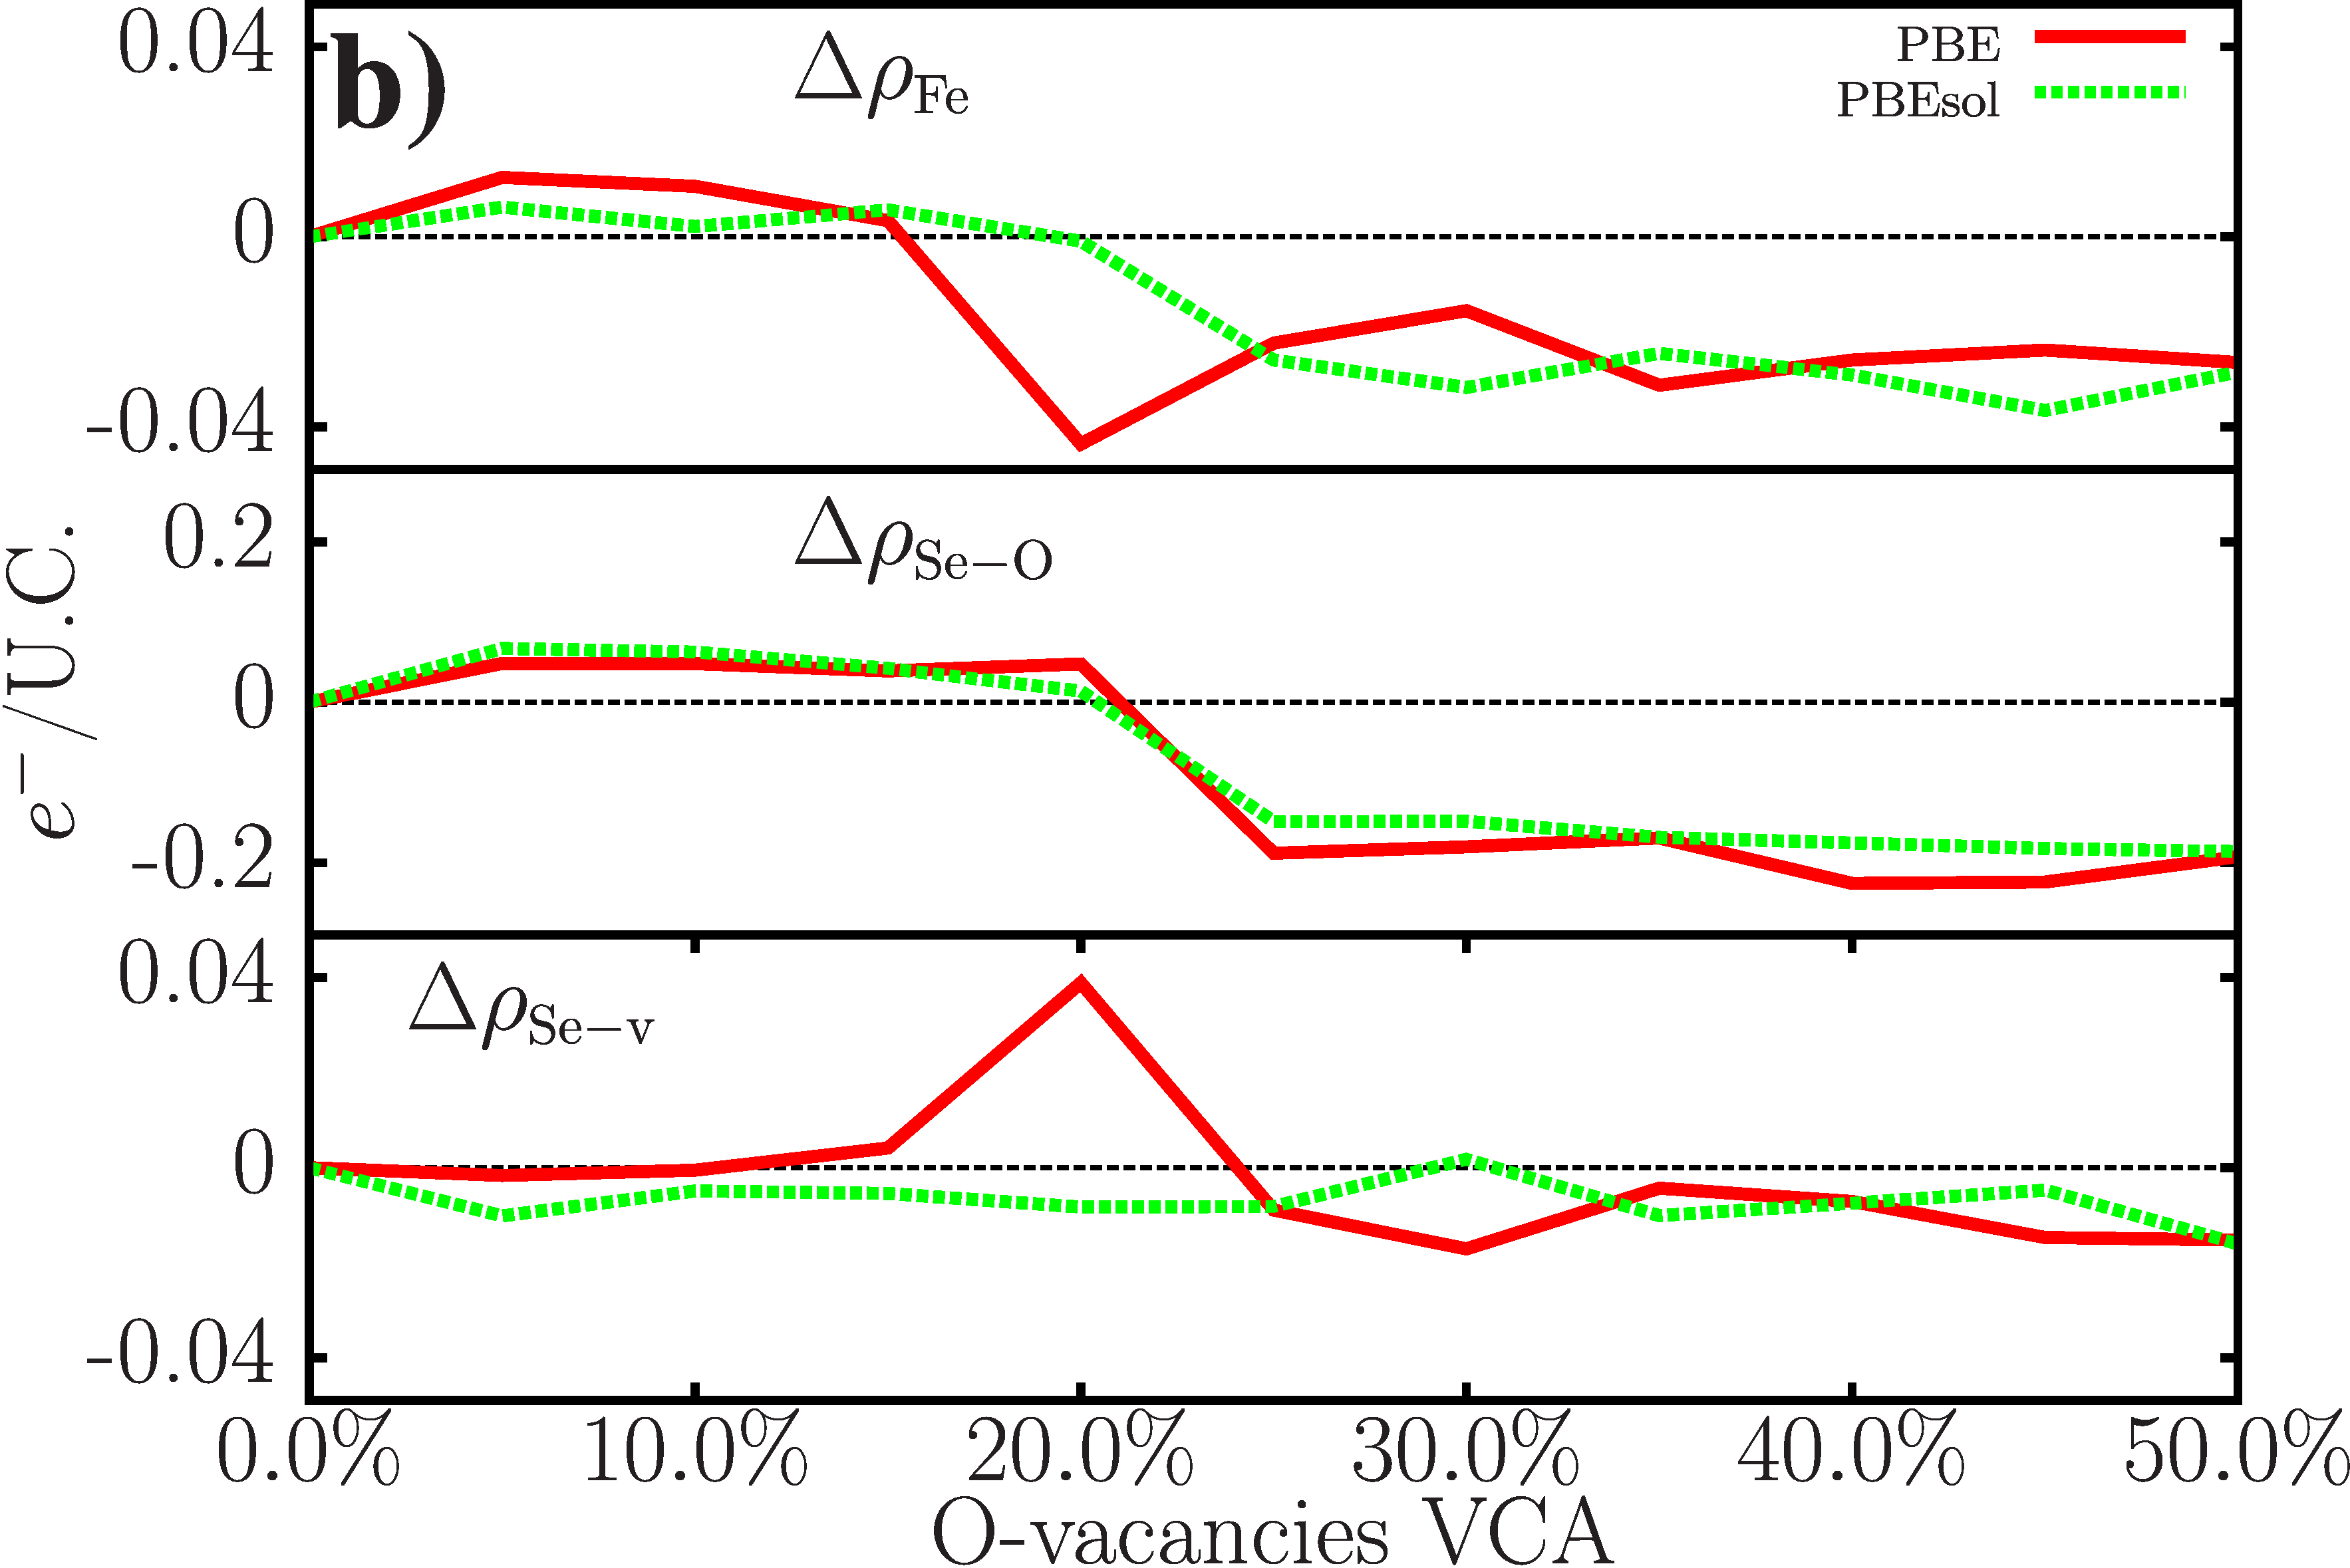
Even though the charge transfer to Fe is rather small [compare Fig. 5 b)], in the general trend vacancies electron-dope the Fe. On the other hand, according to the Bader analysis, the charge on the Se close to the STO first increases before it decreases below the initial value. Variations are one order of magnitude larger as compared to the Fe atom. Charges on the vacuum side of the FeSe layer are highly oscillatory which is because of the low density and low density variation in the vacuum so that the Bader analysis is problematic.
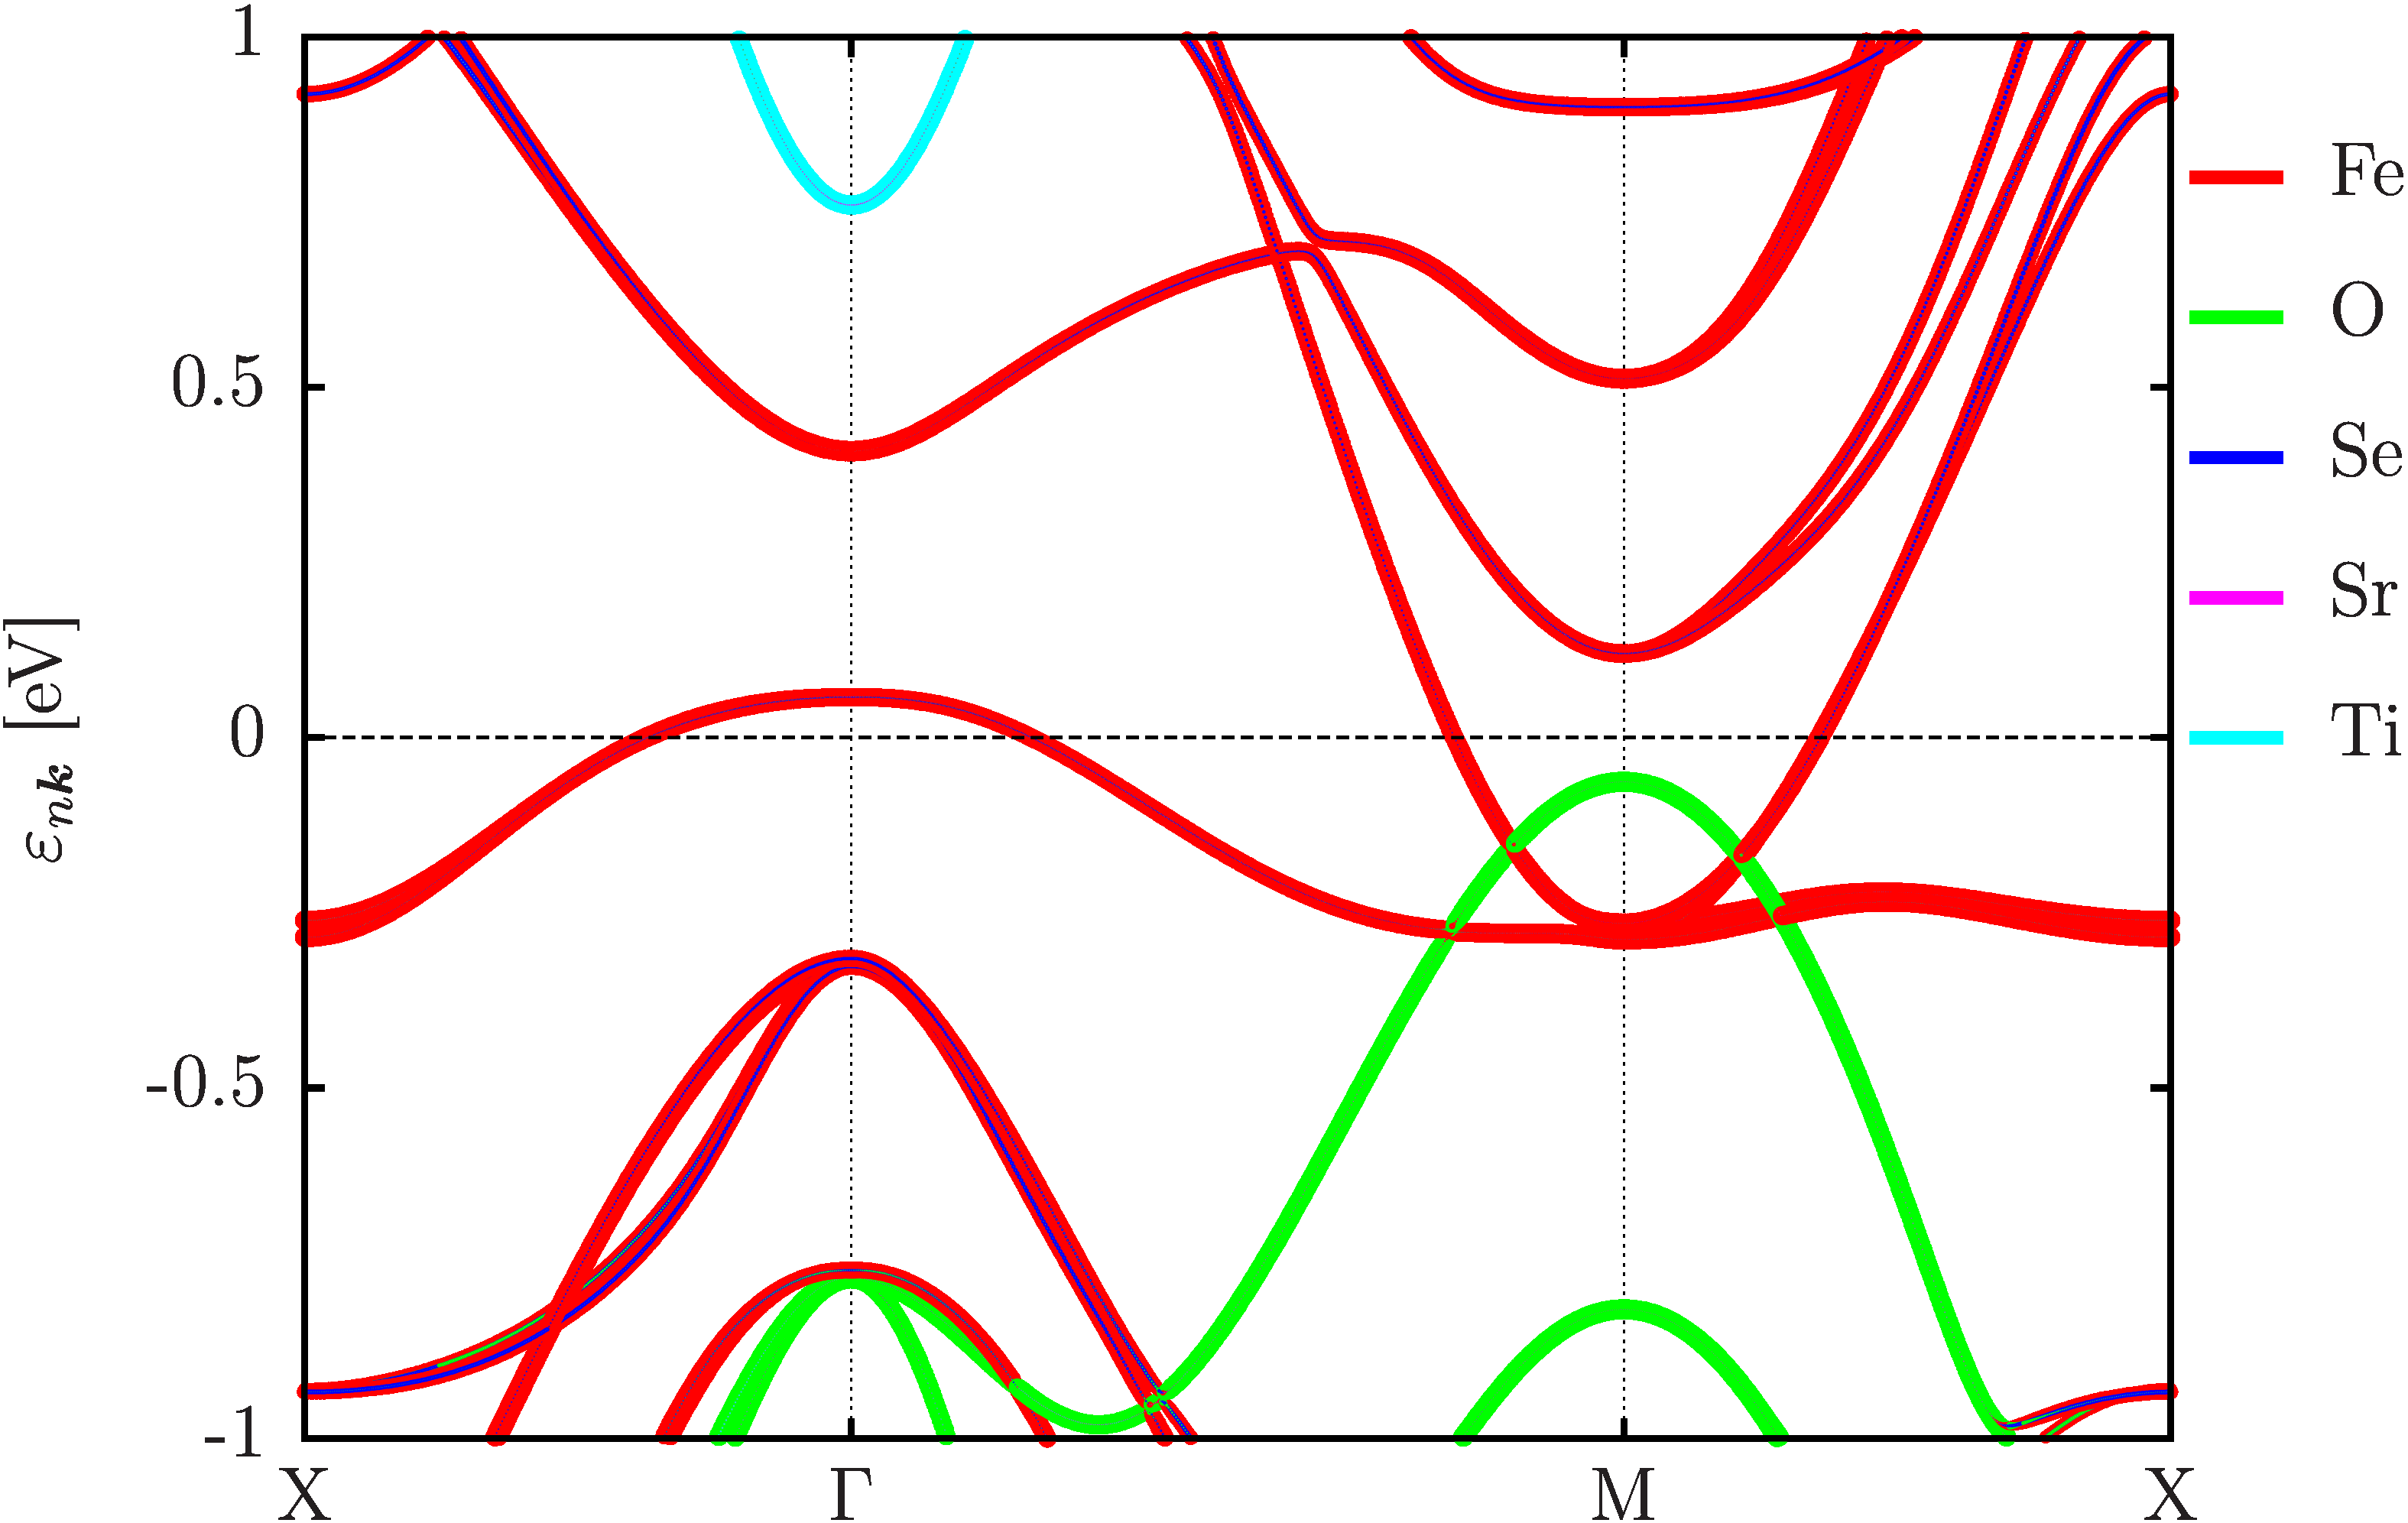
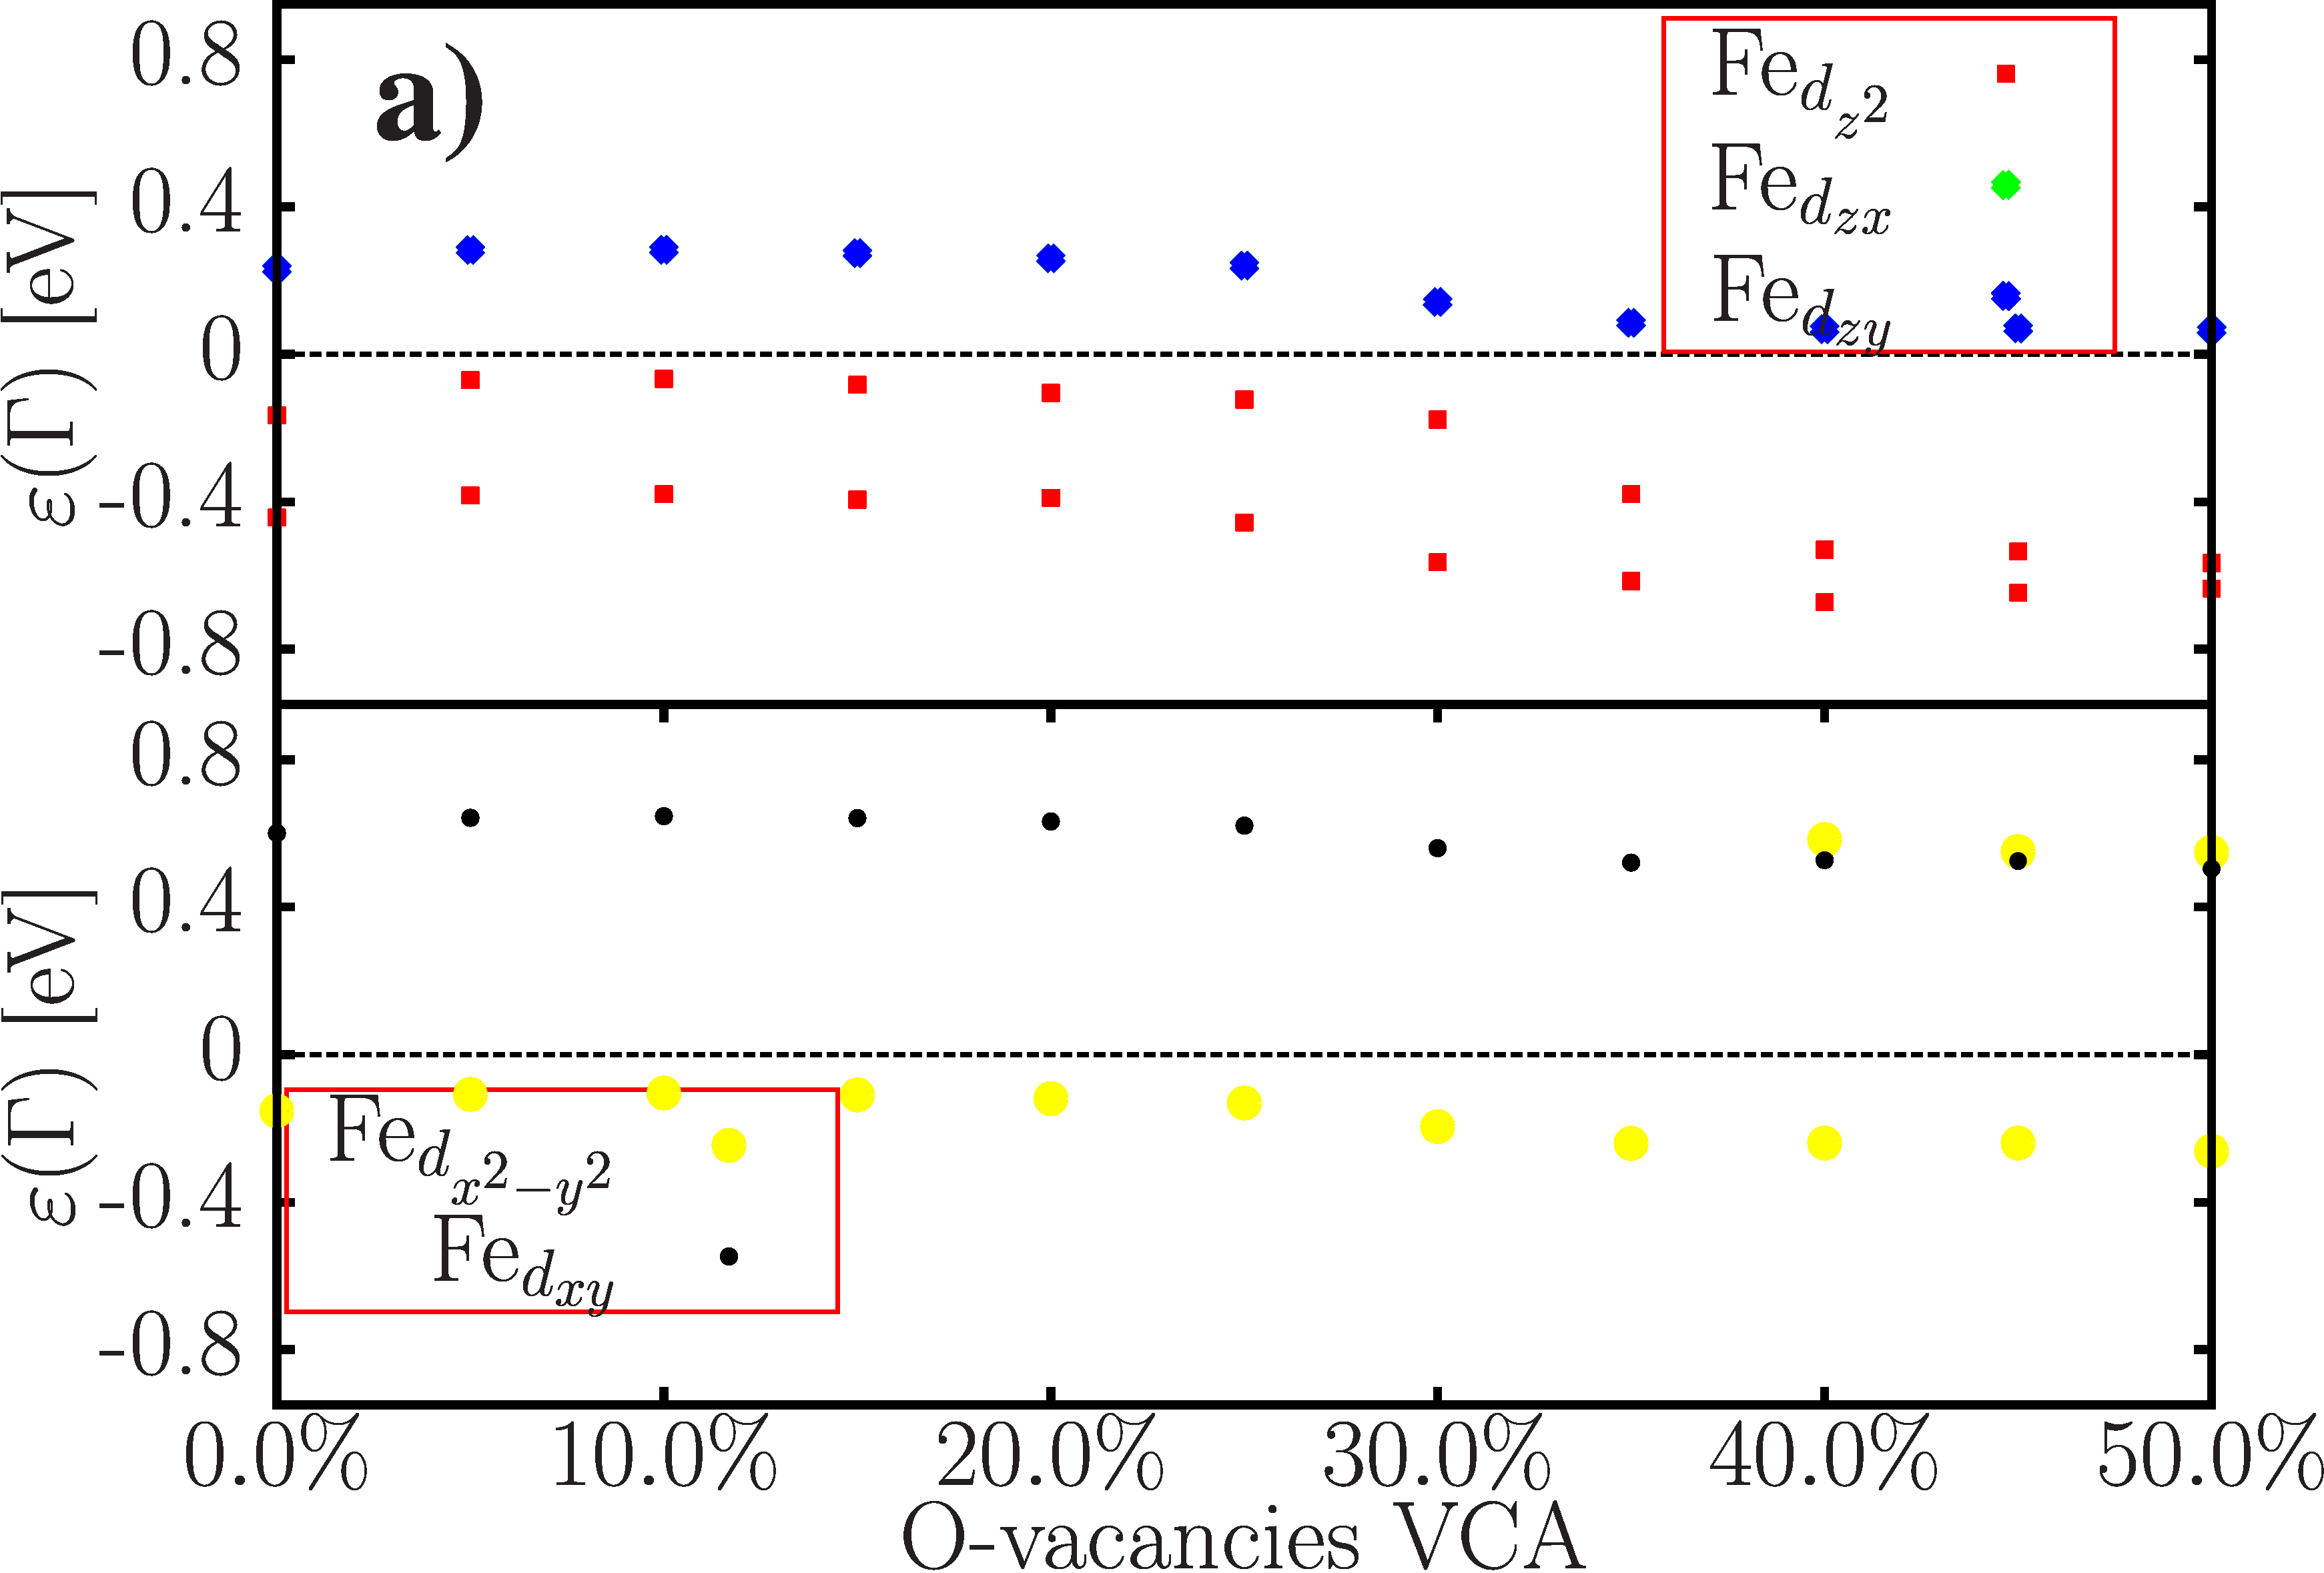
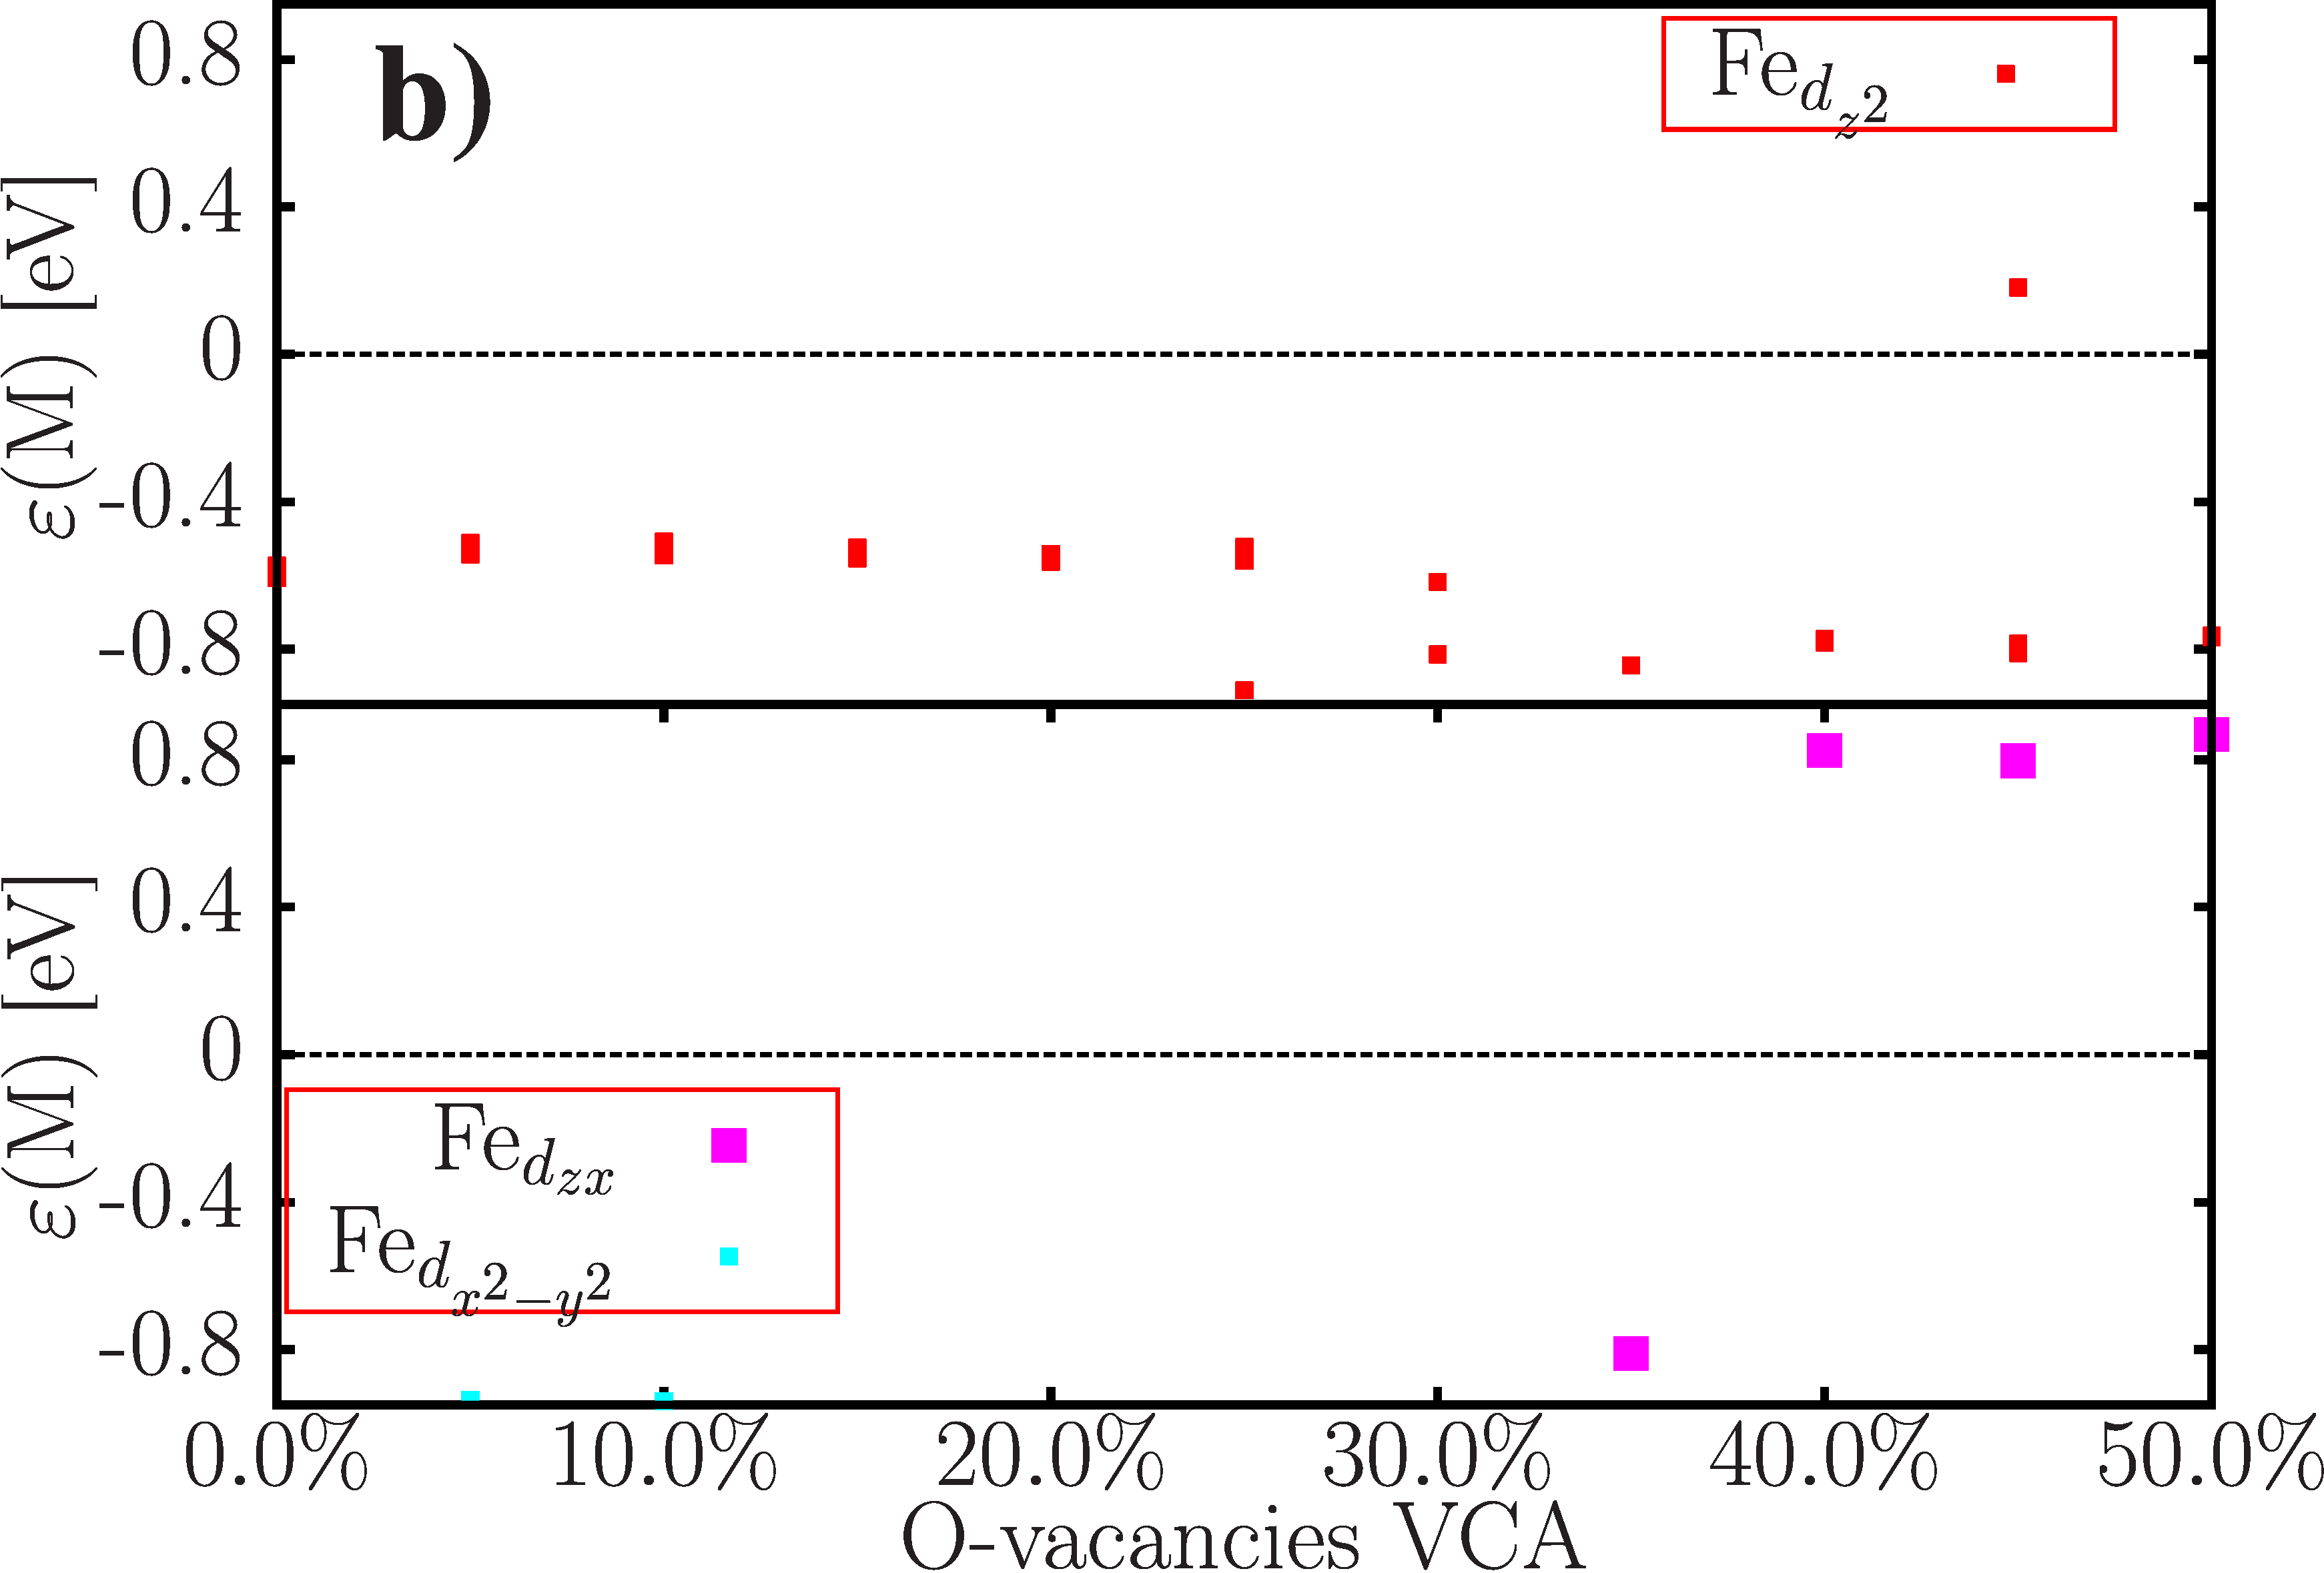
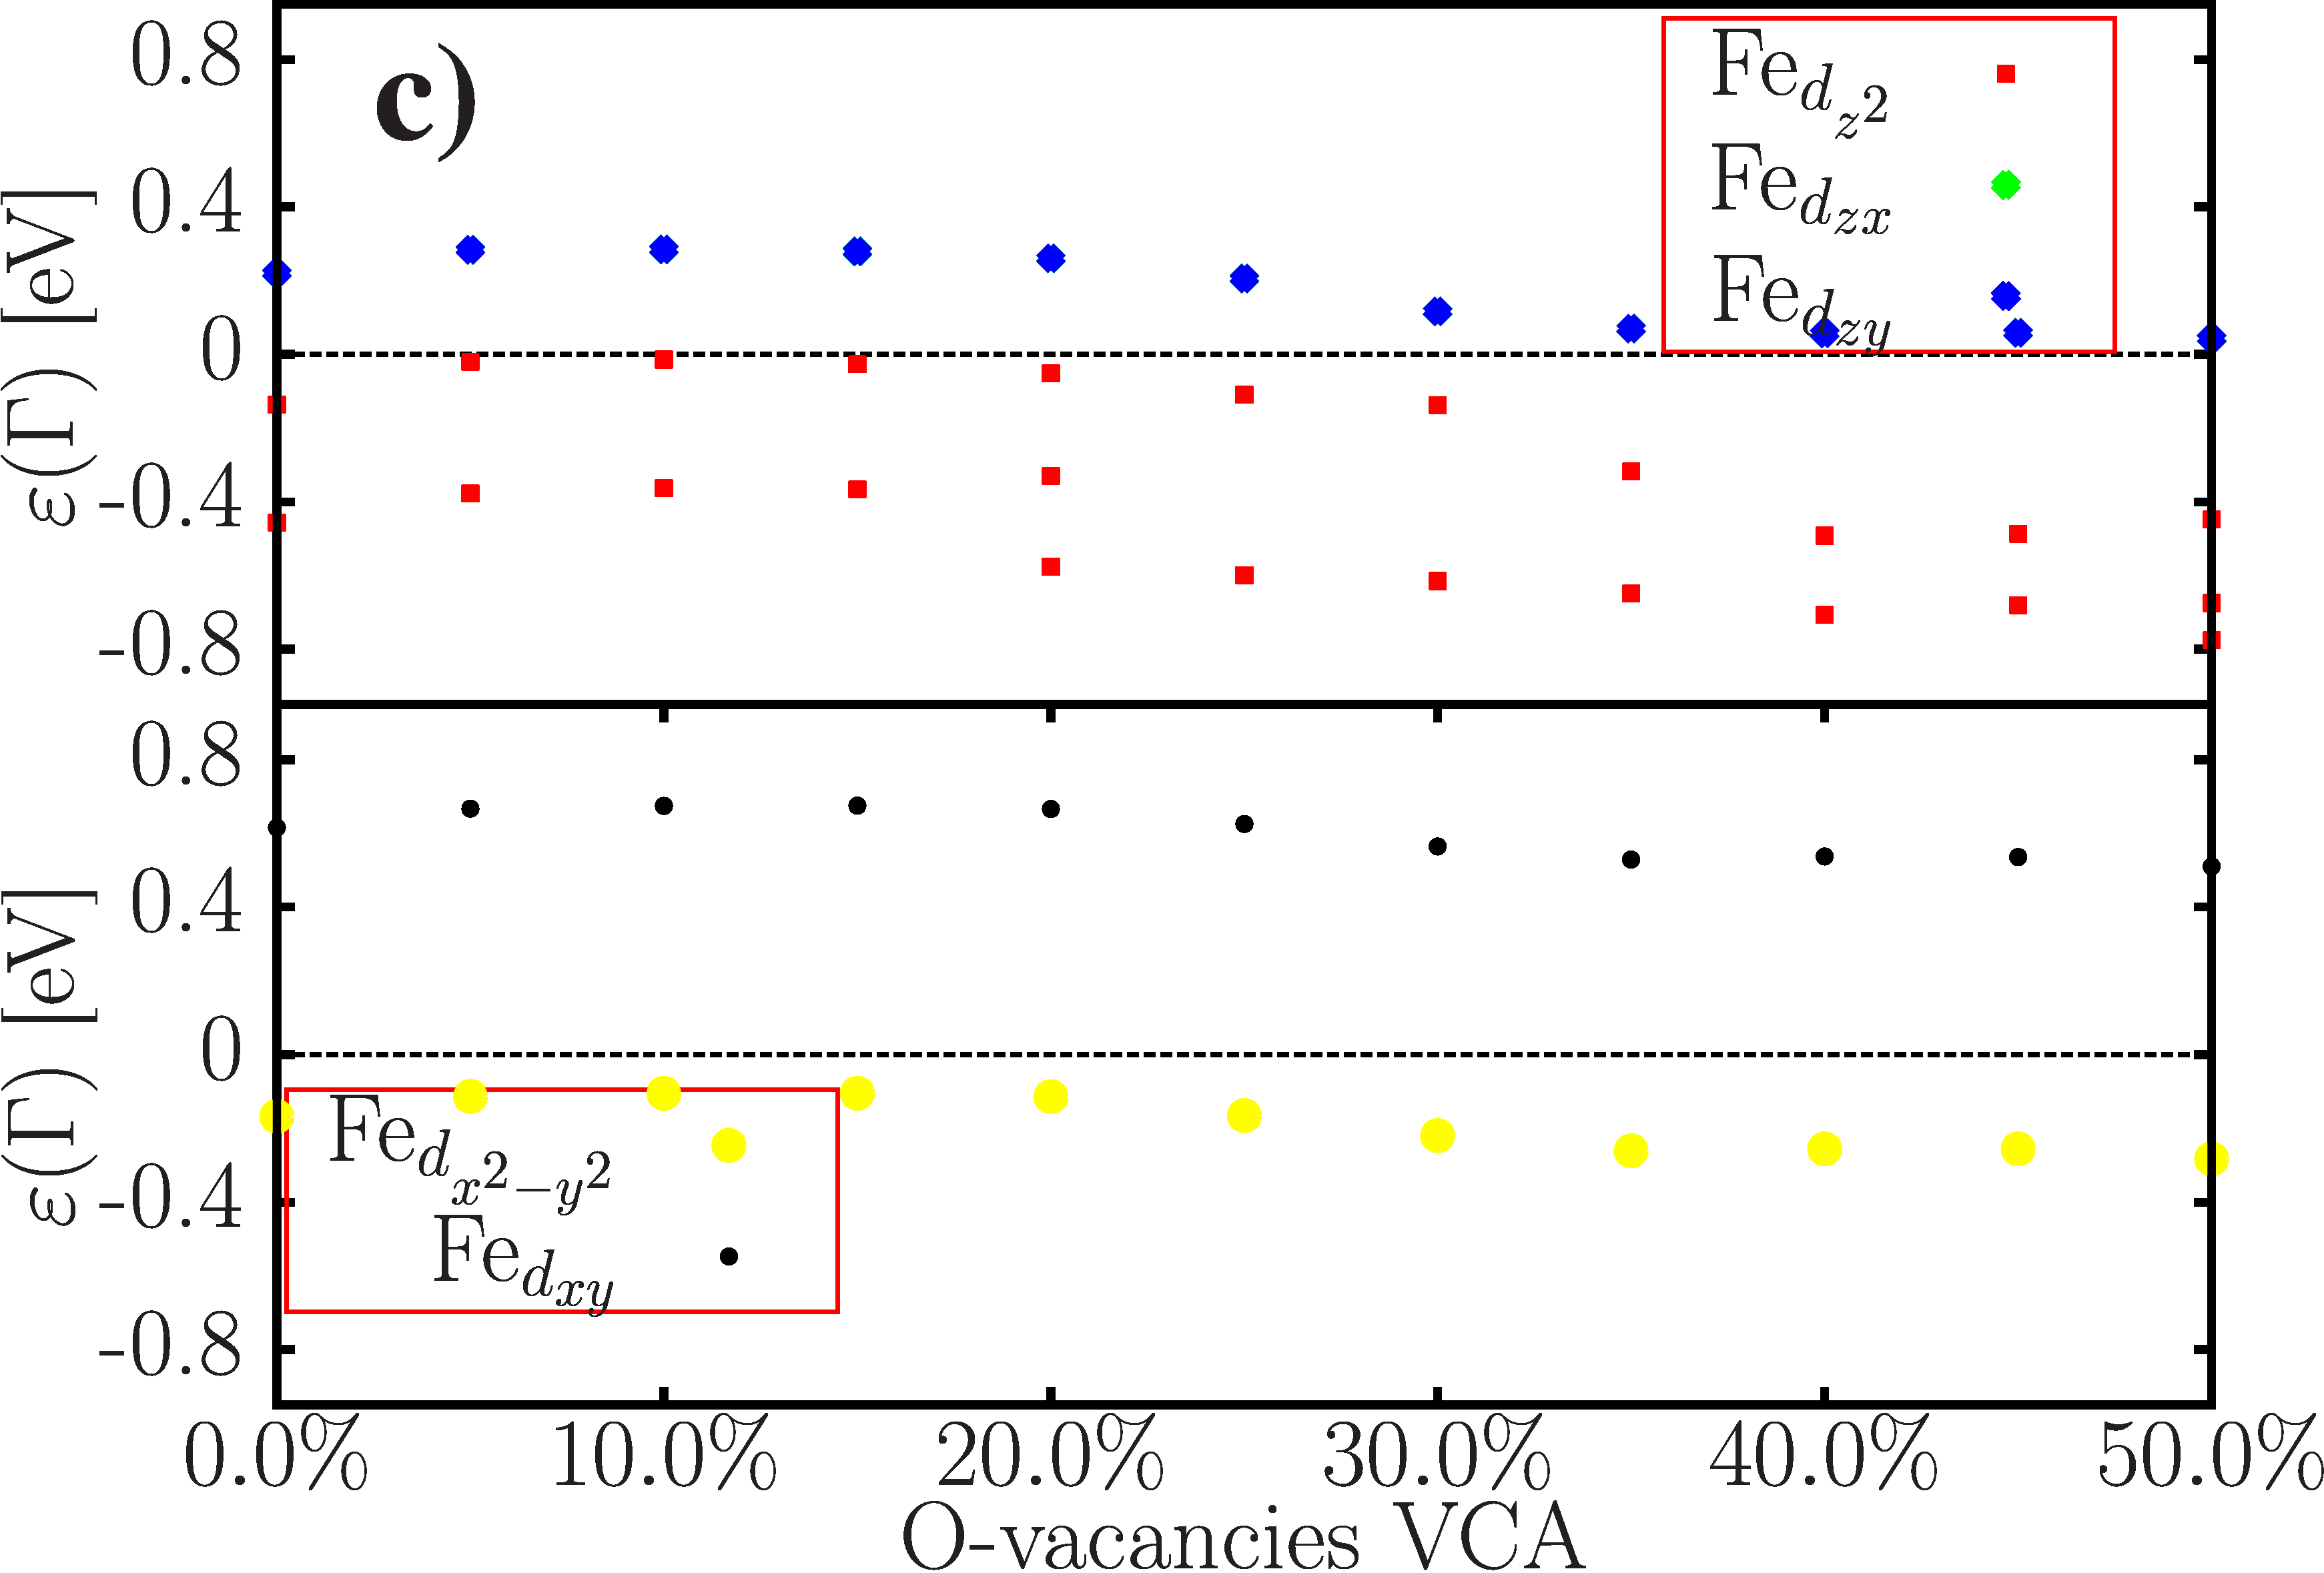
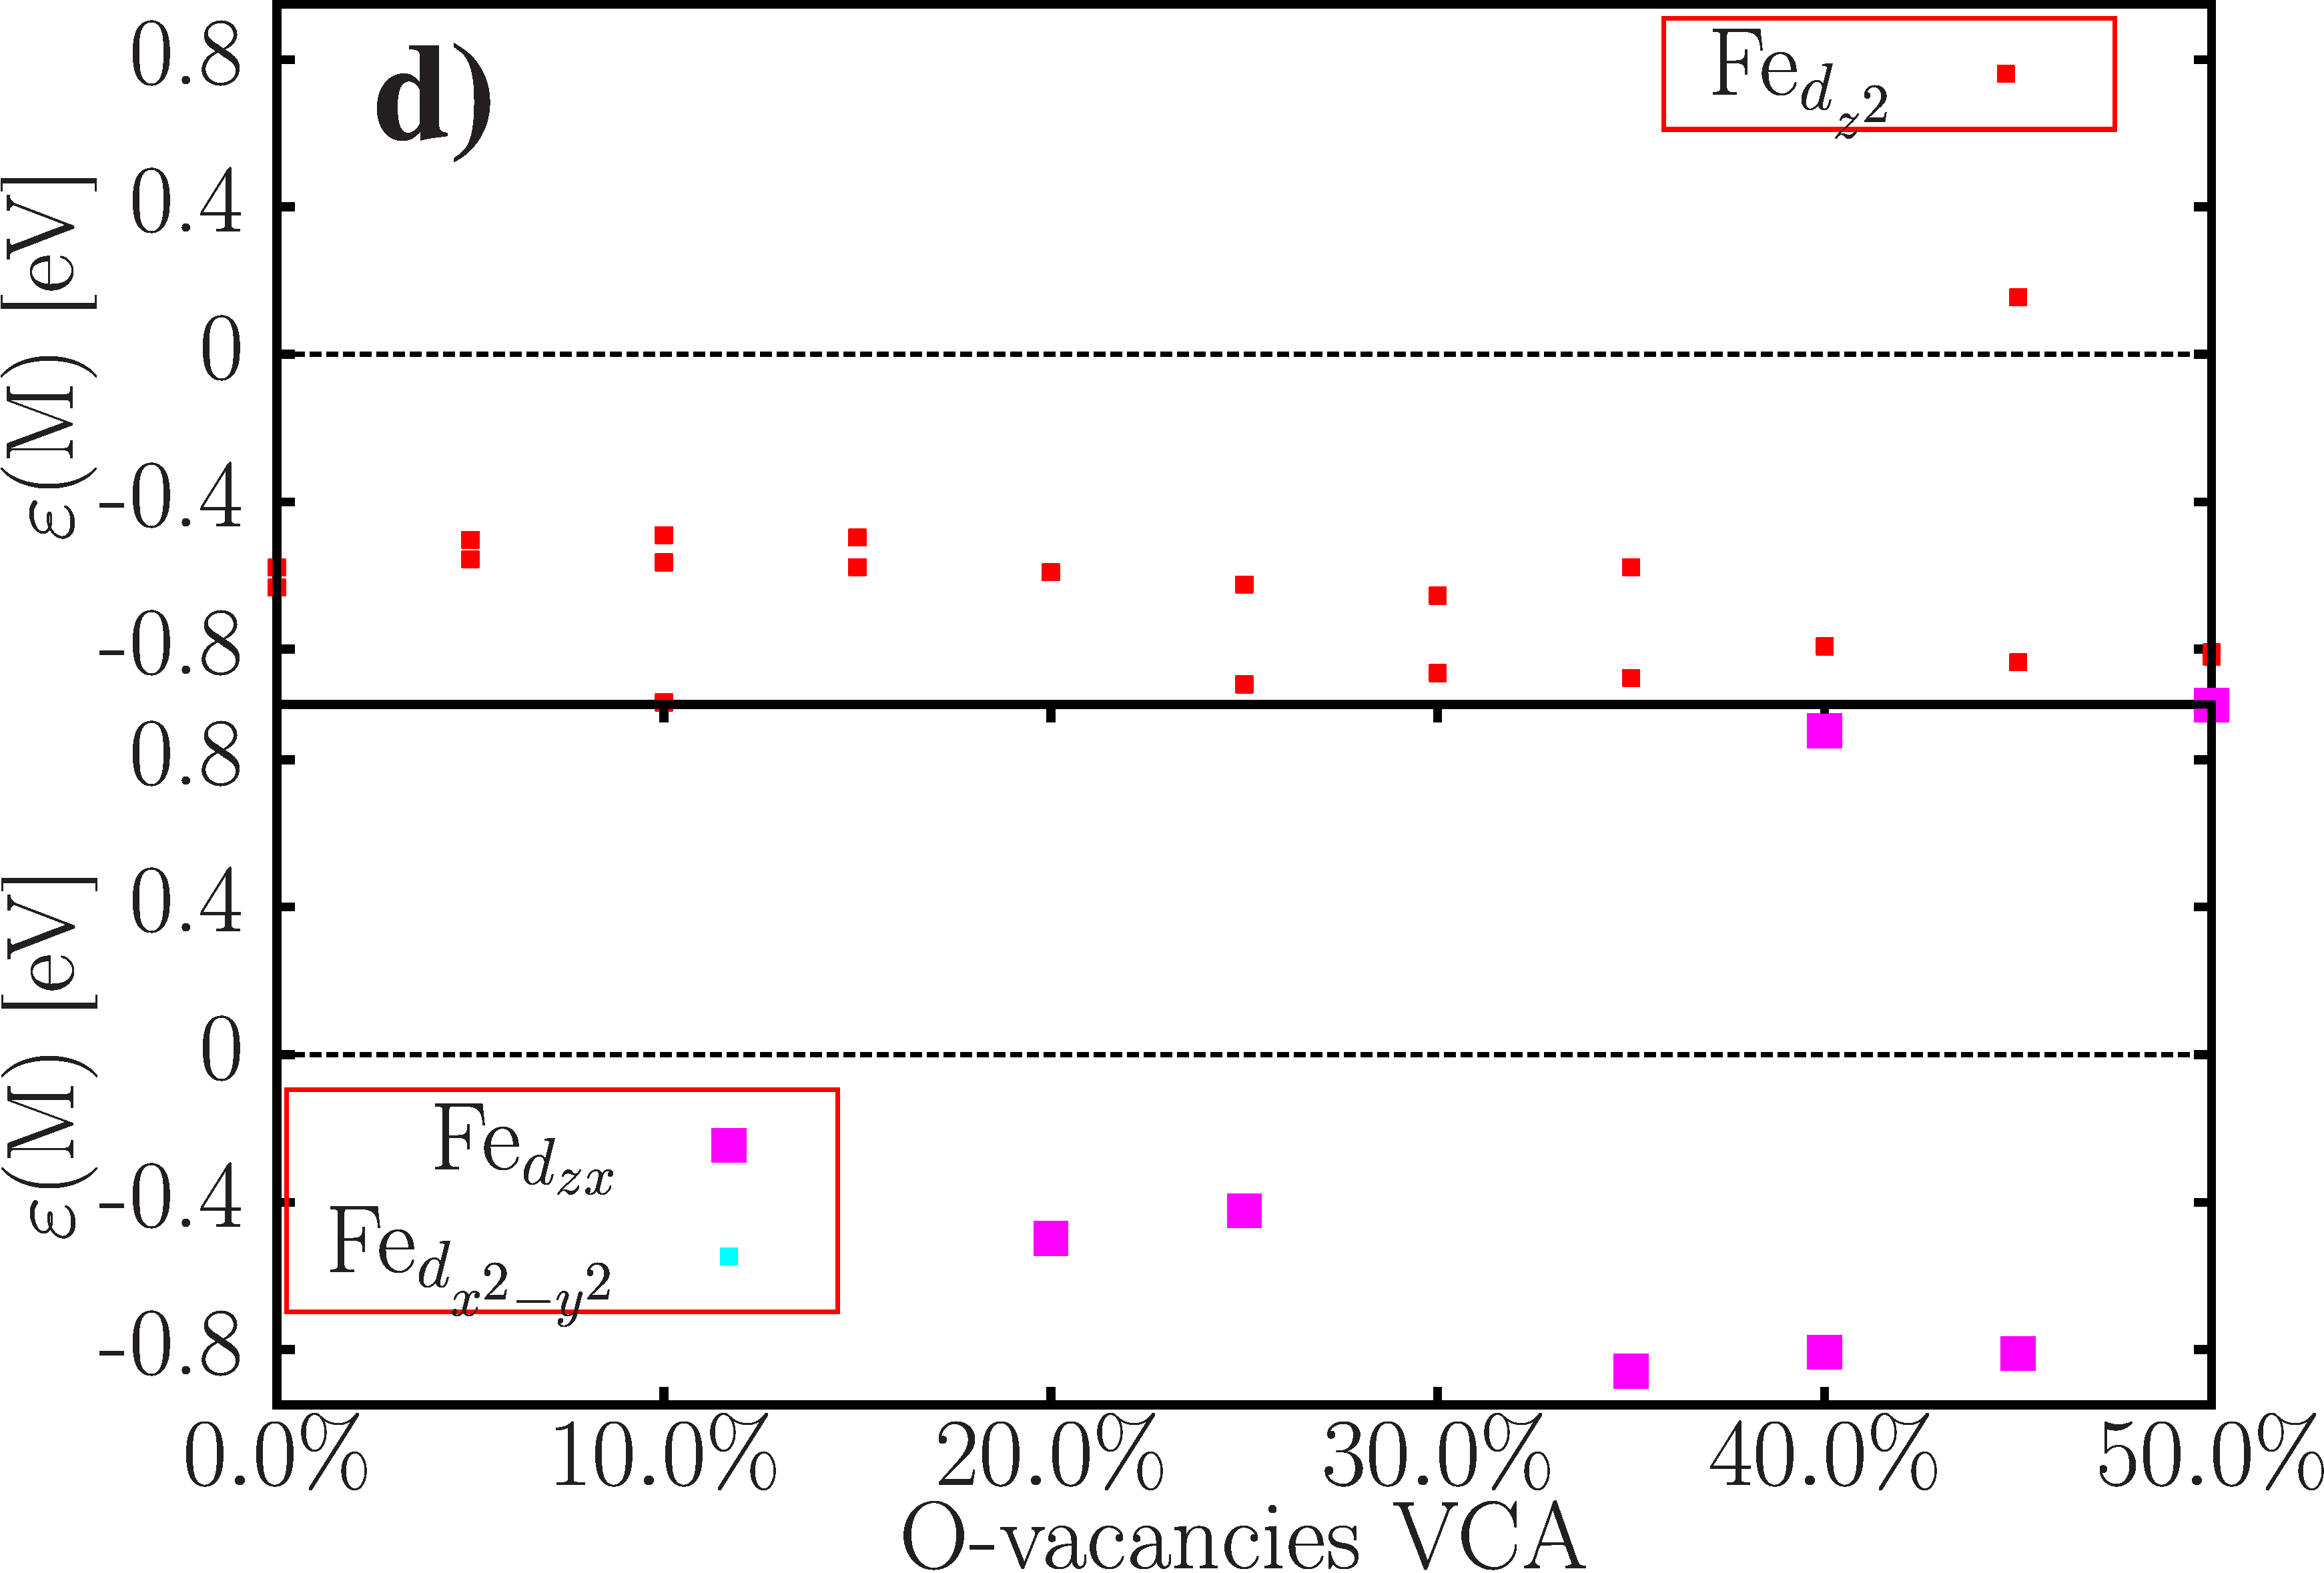
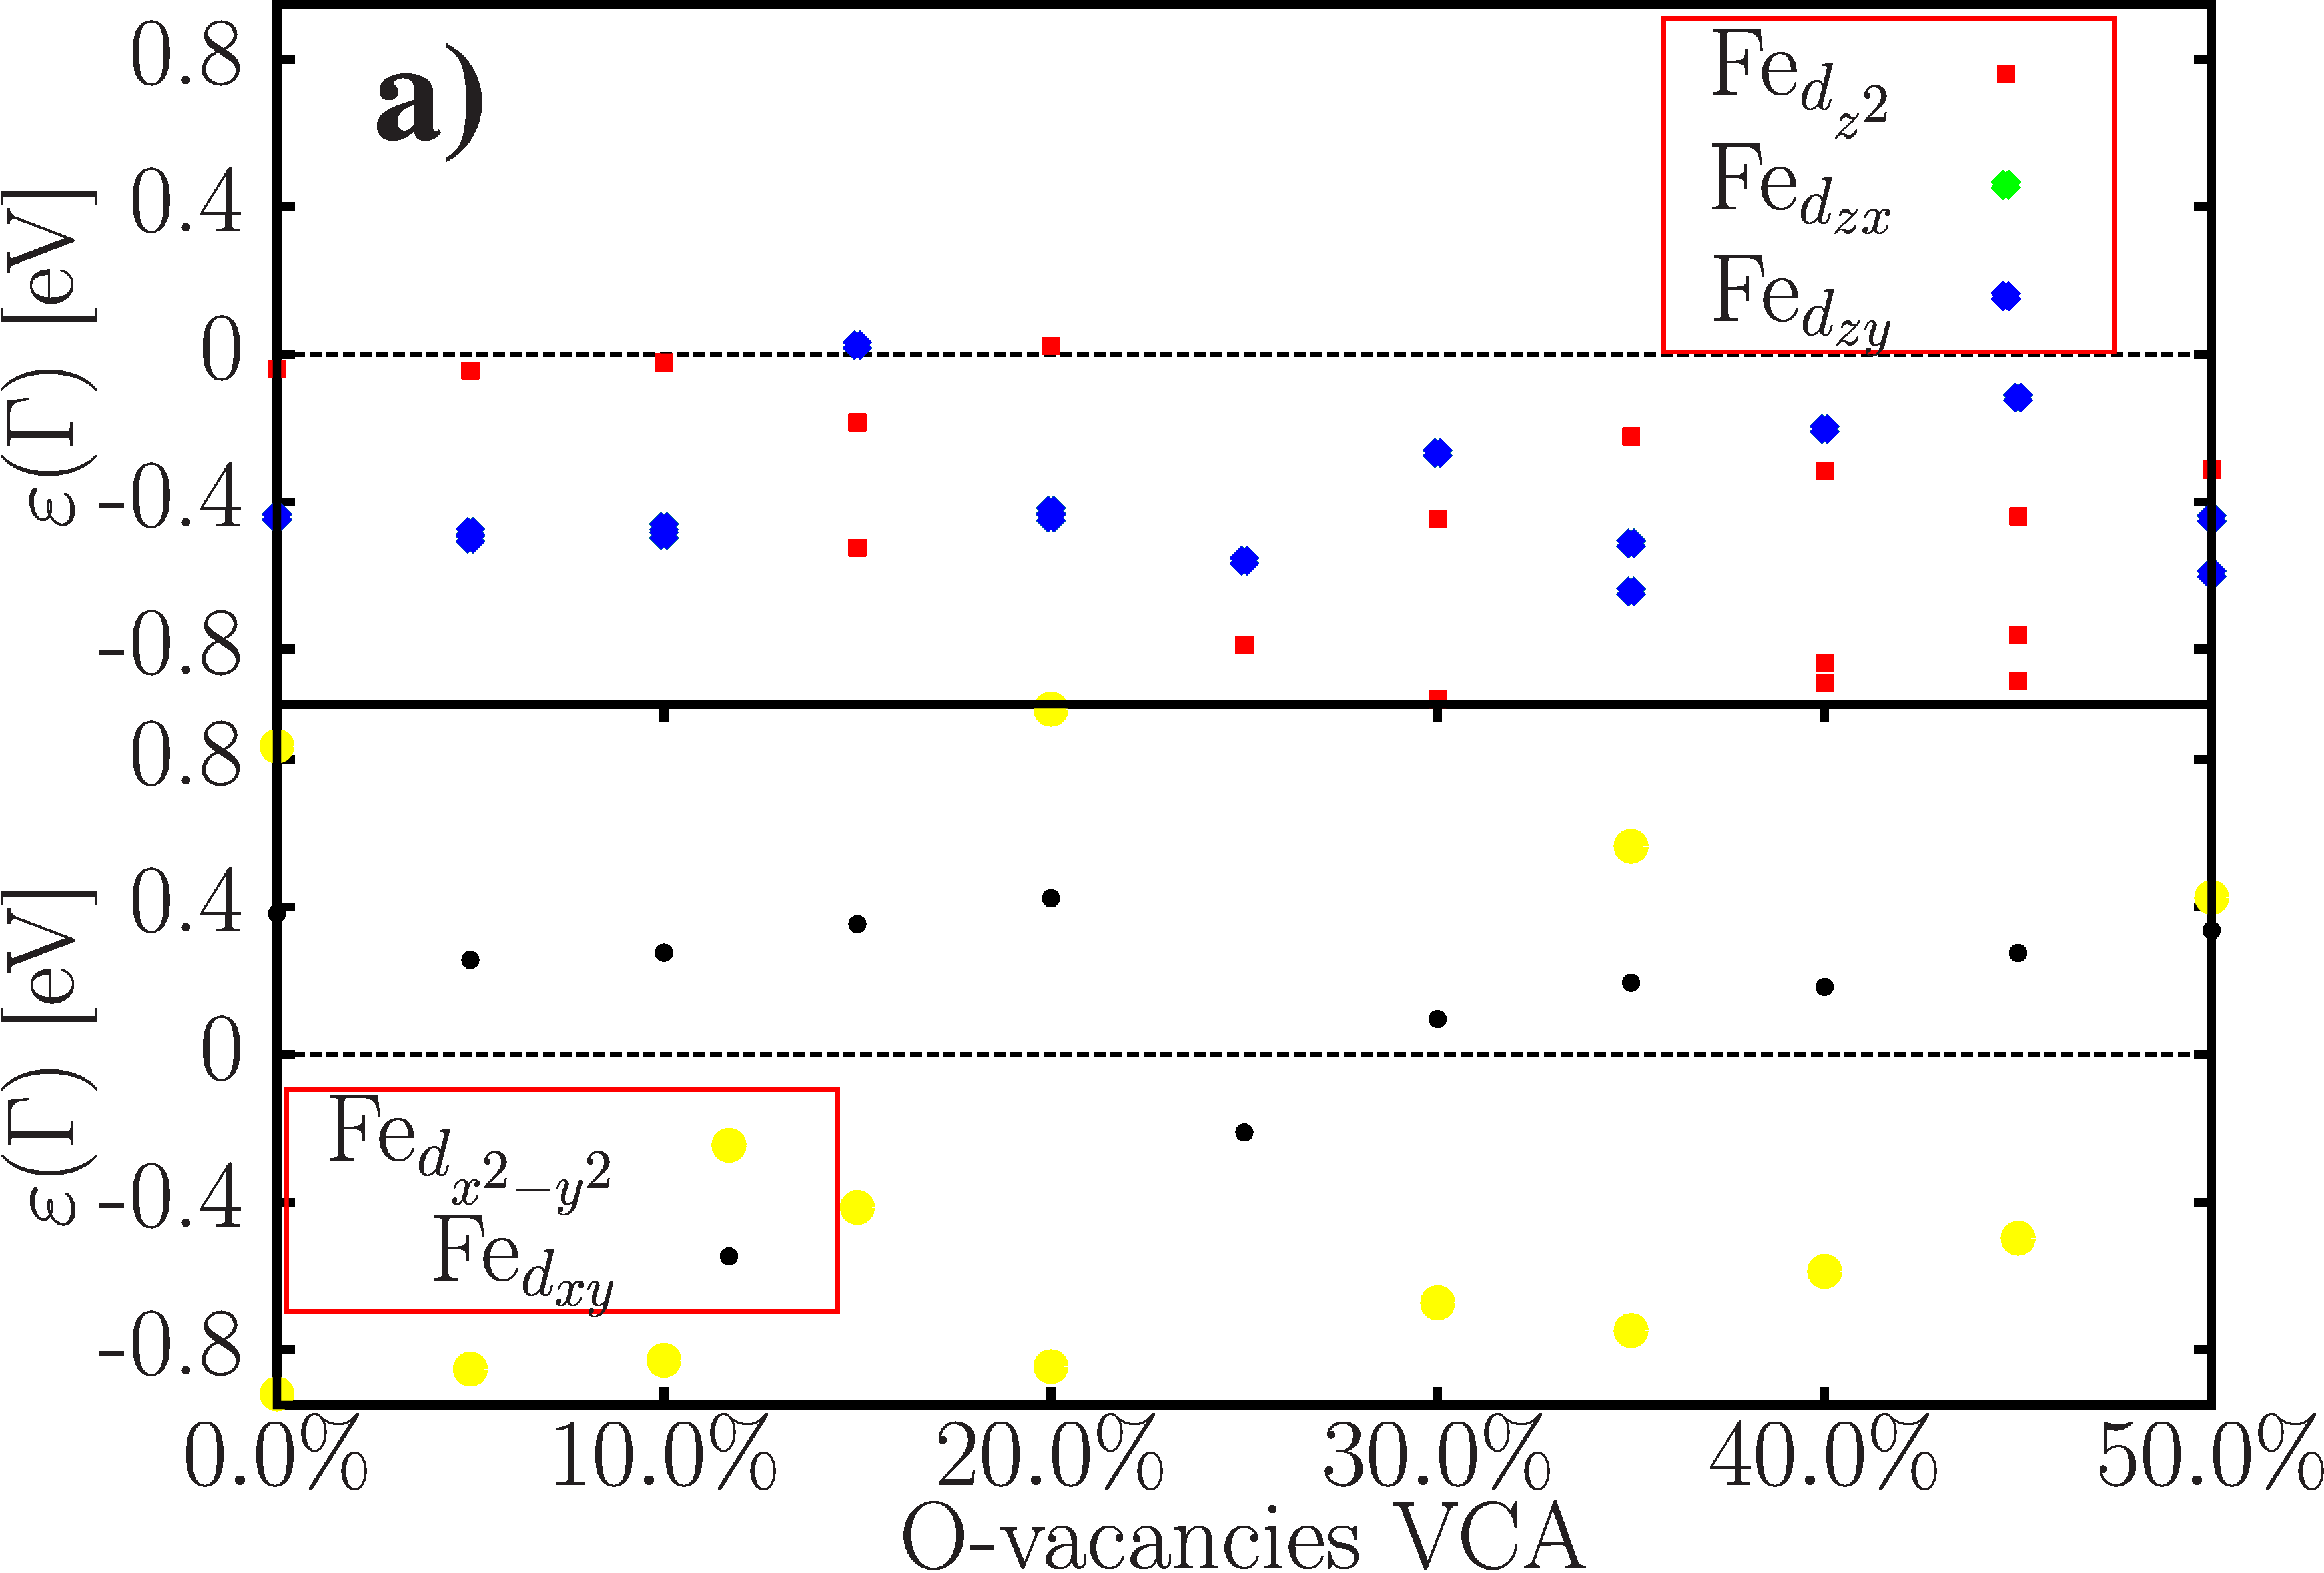
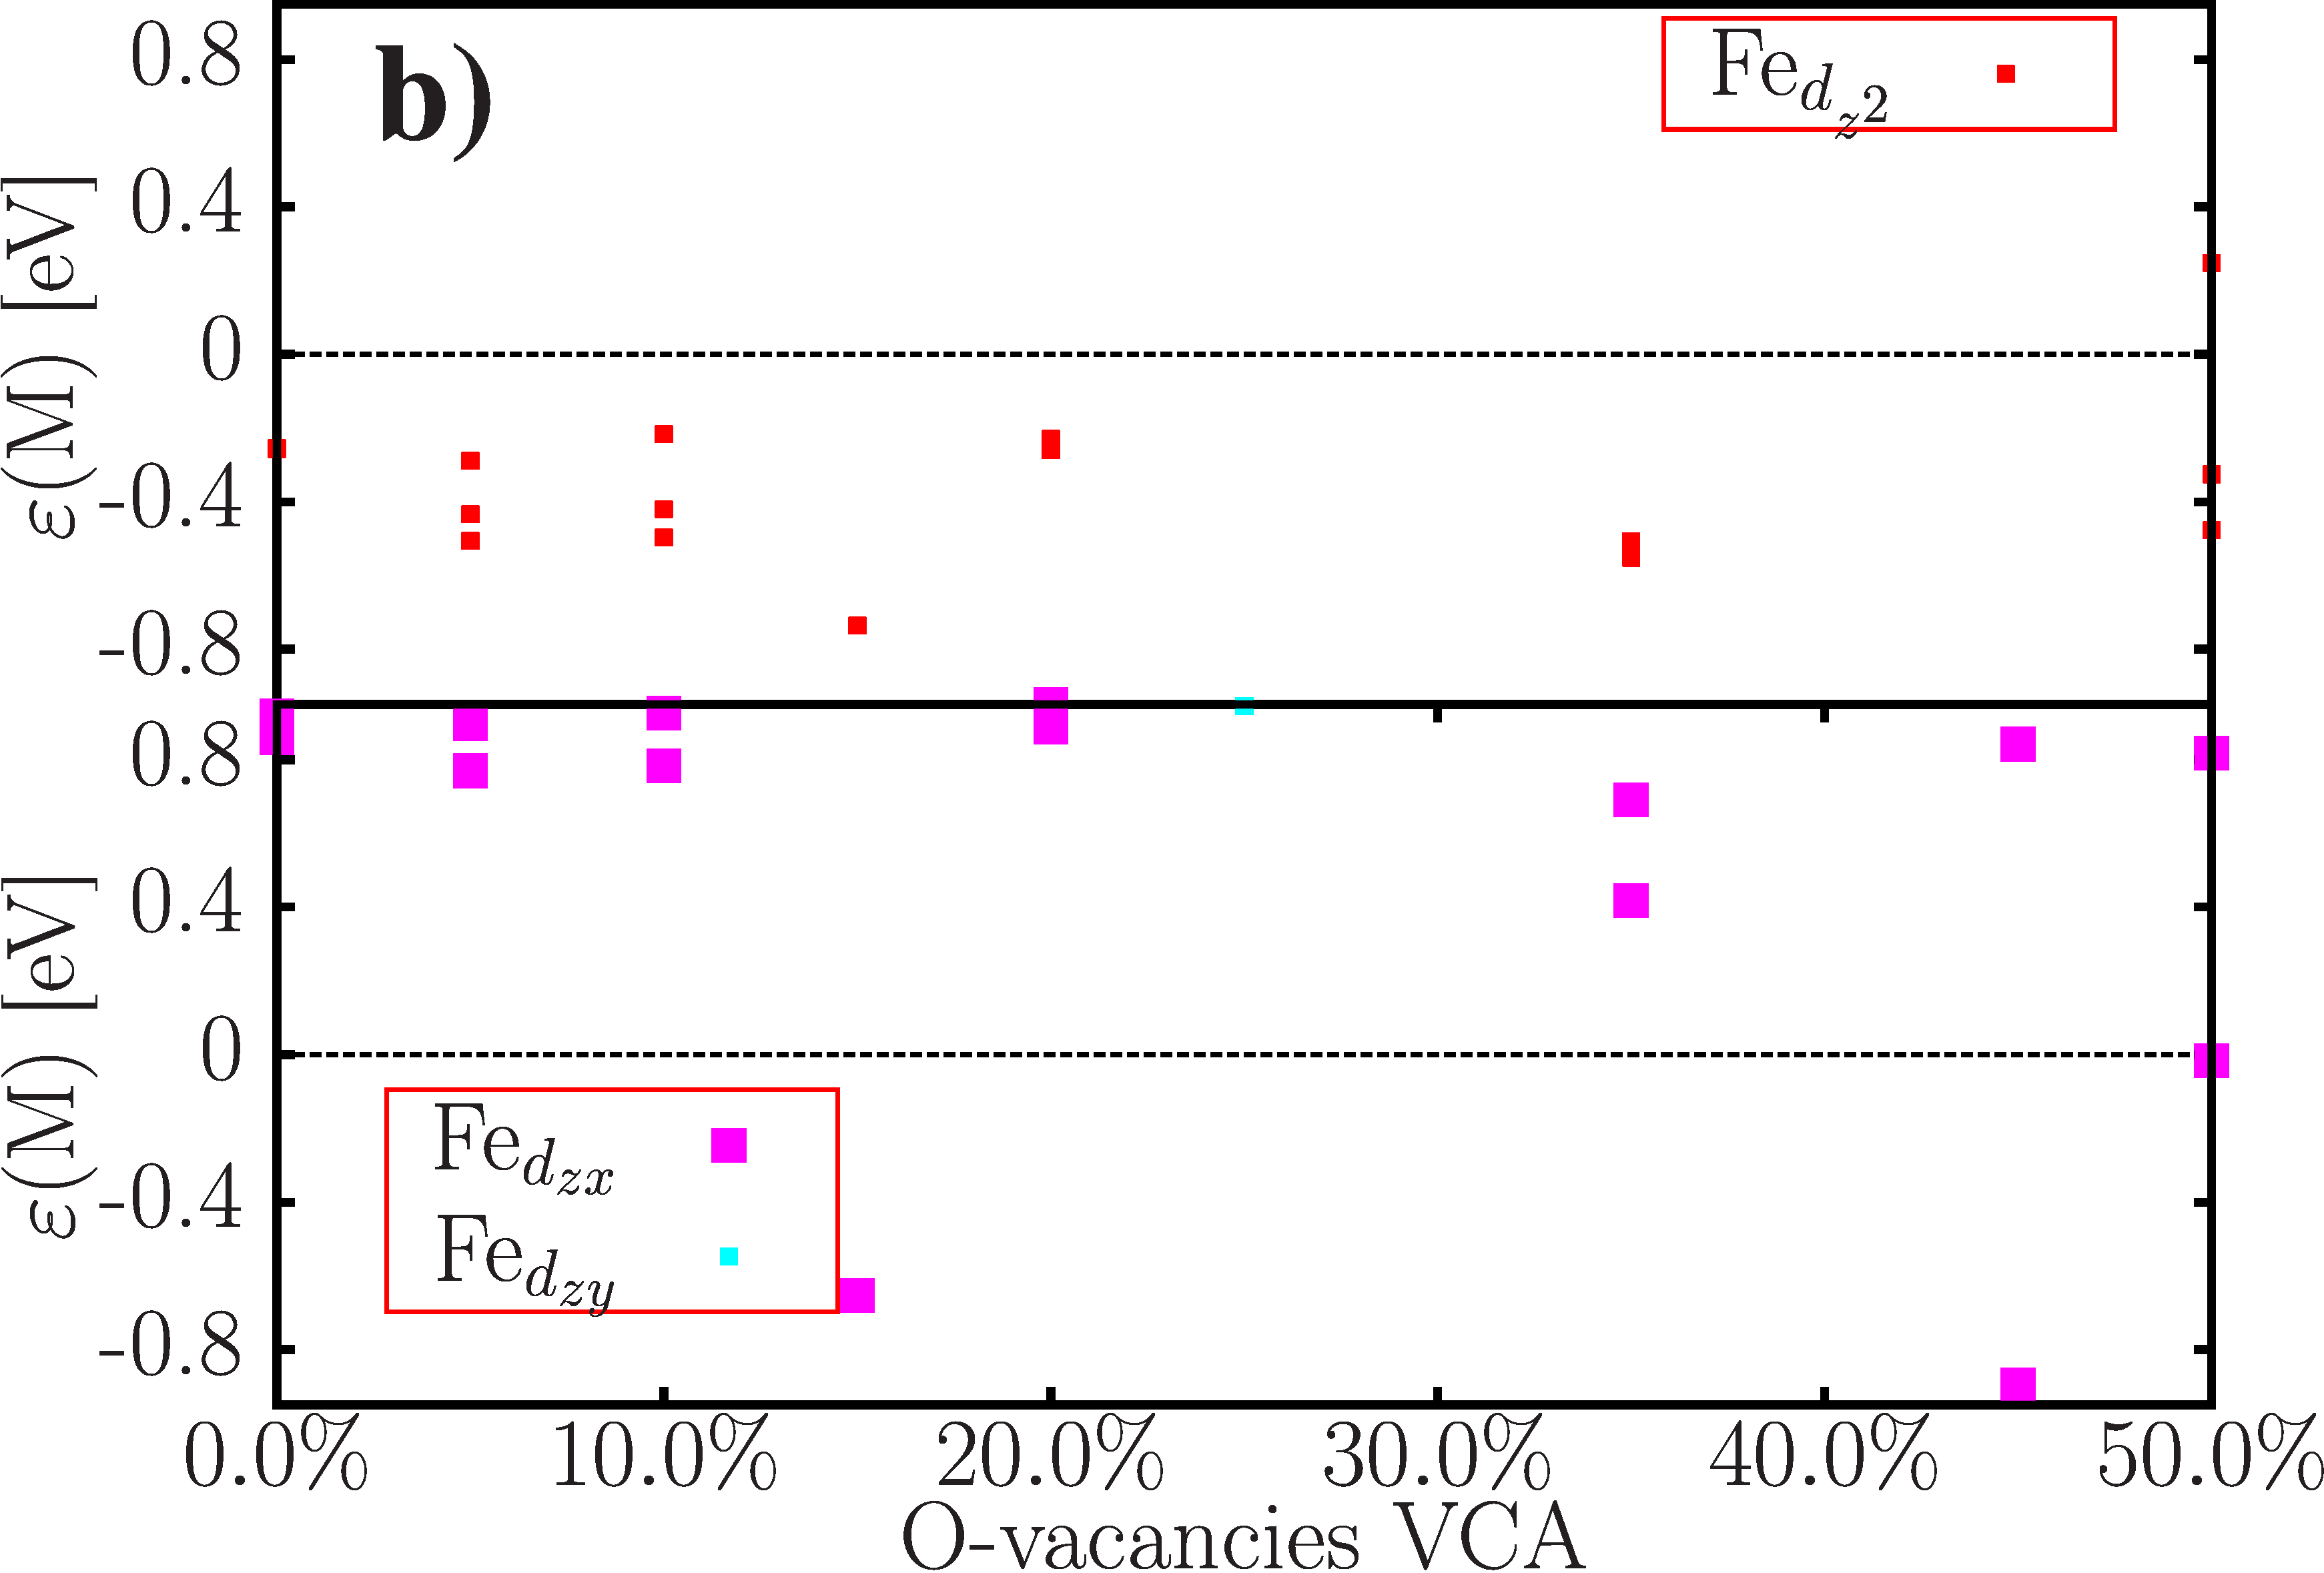
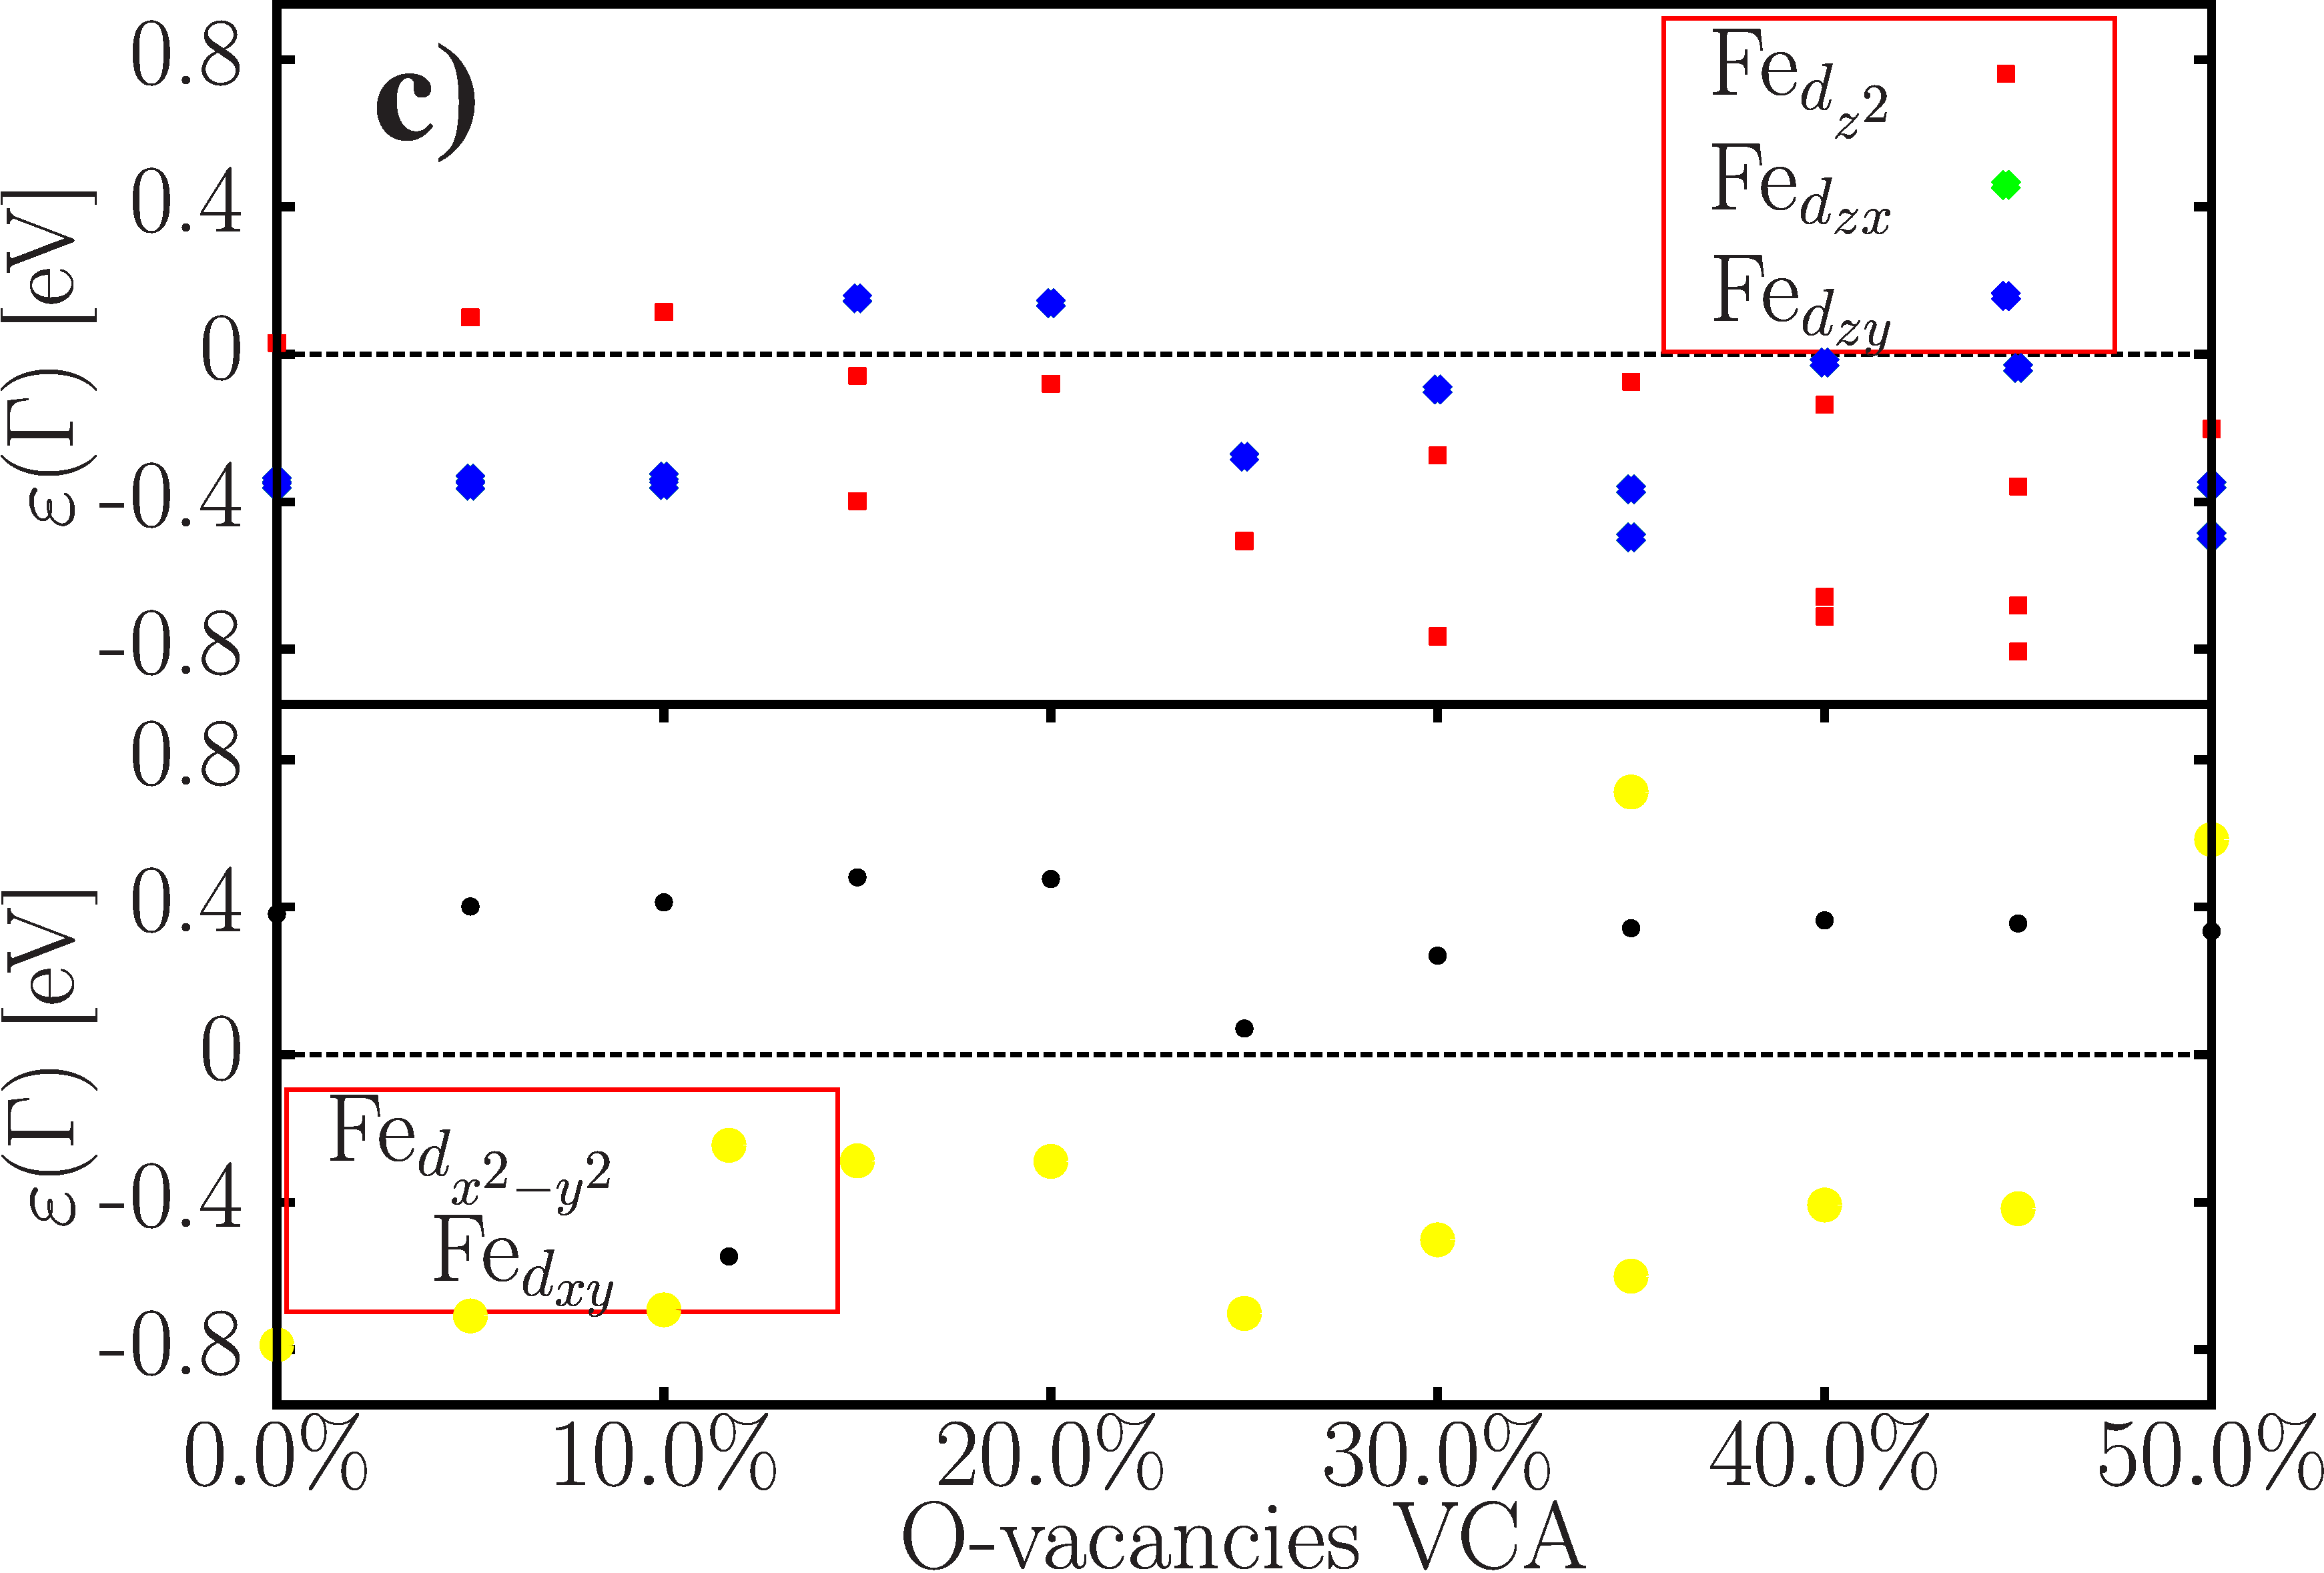
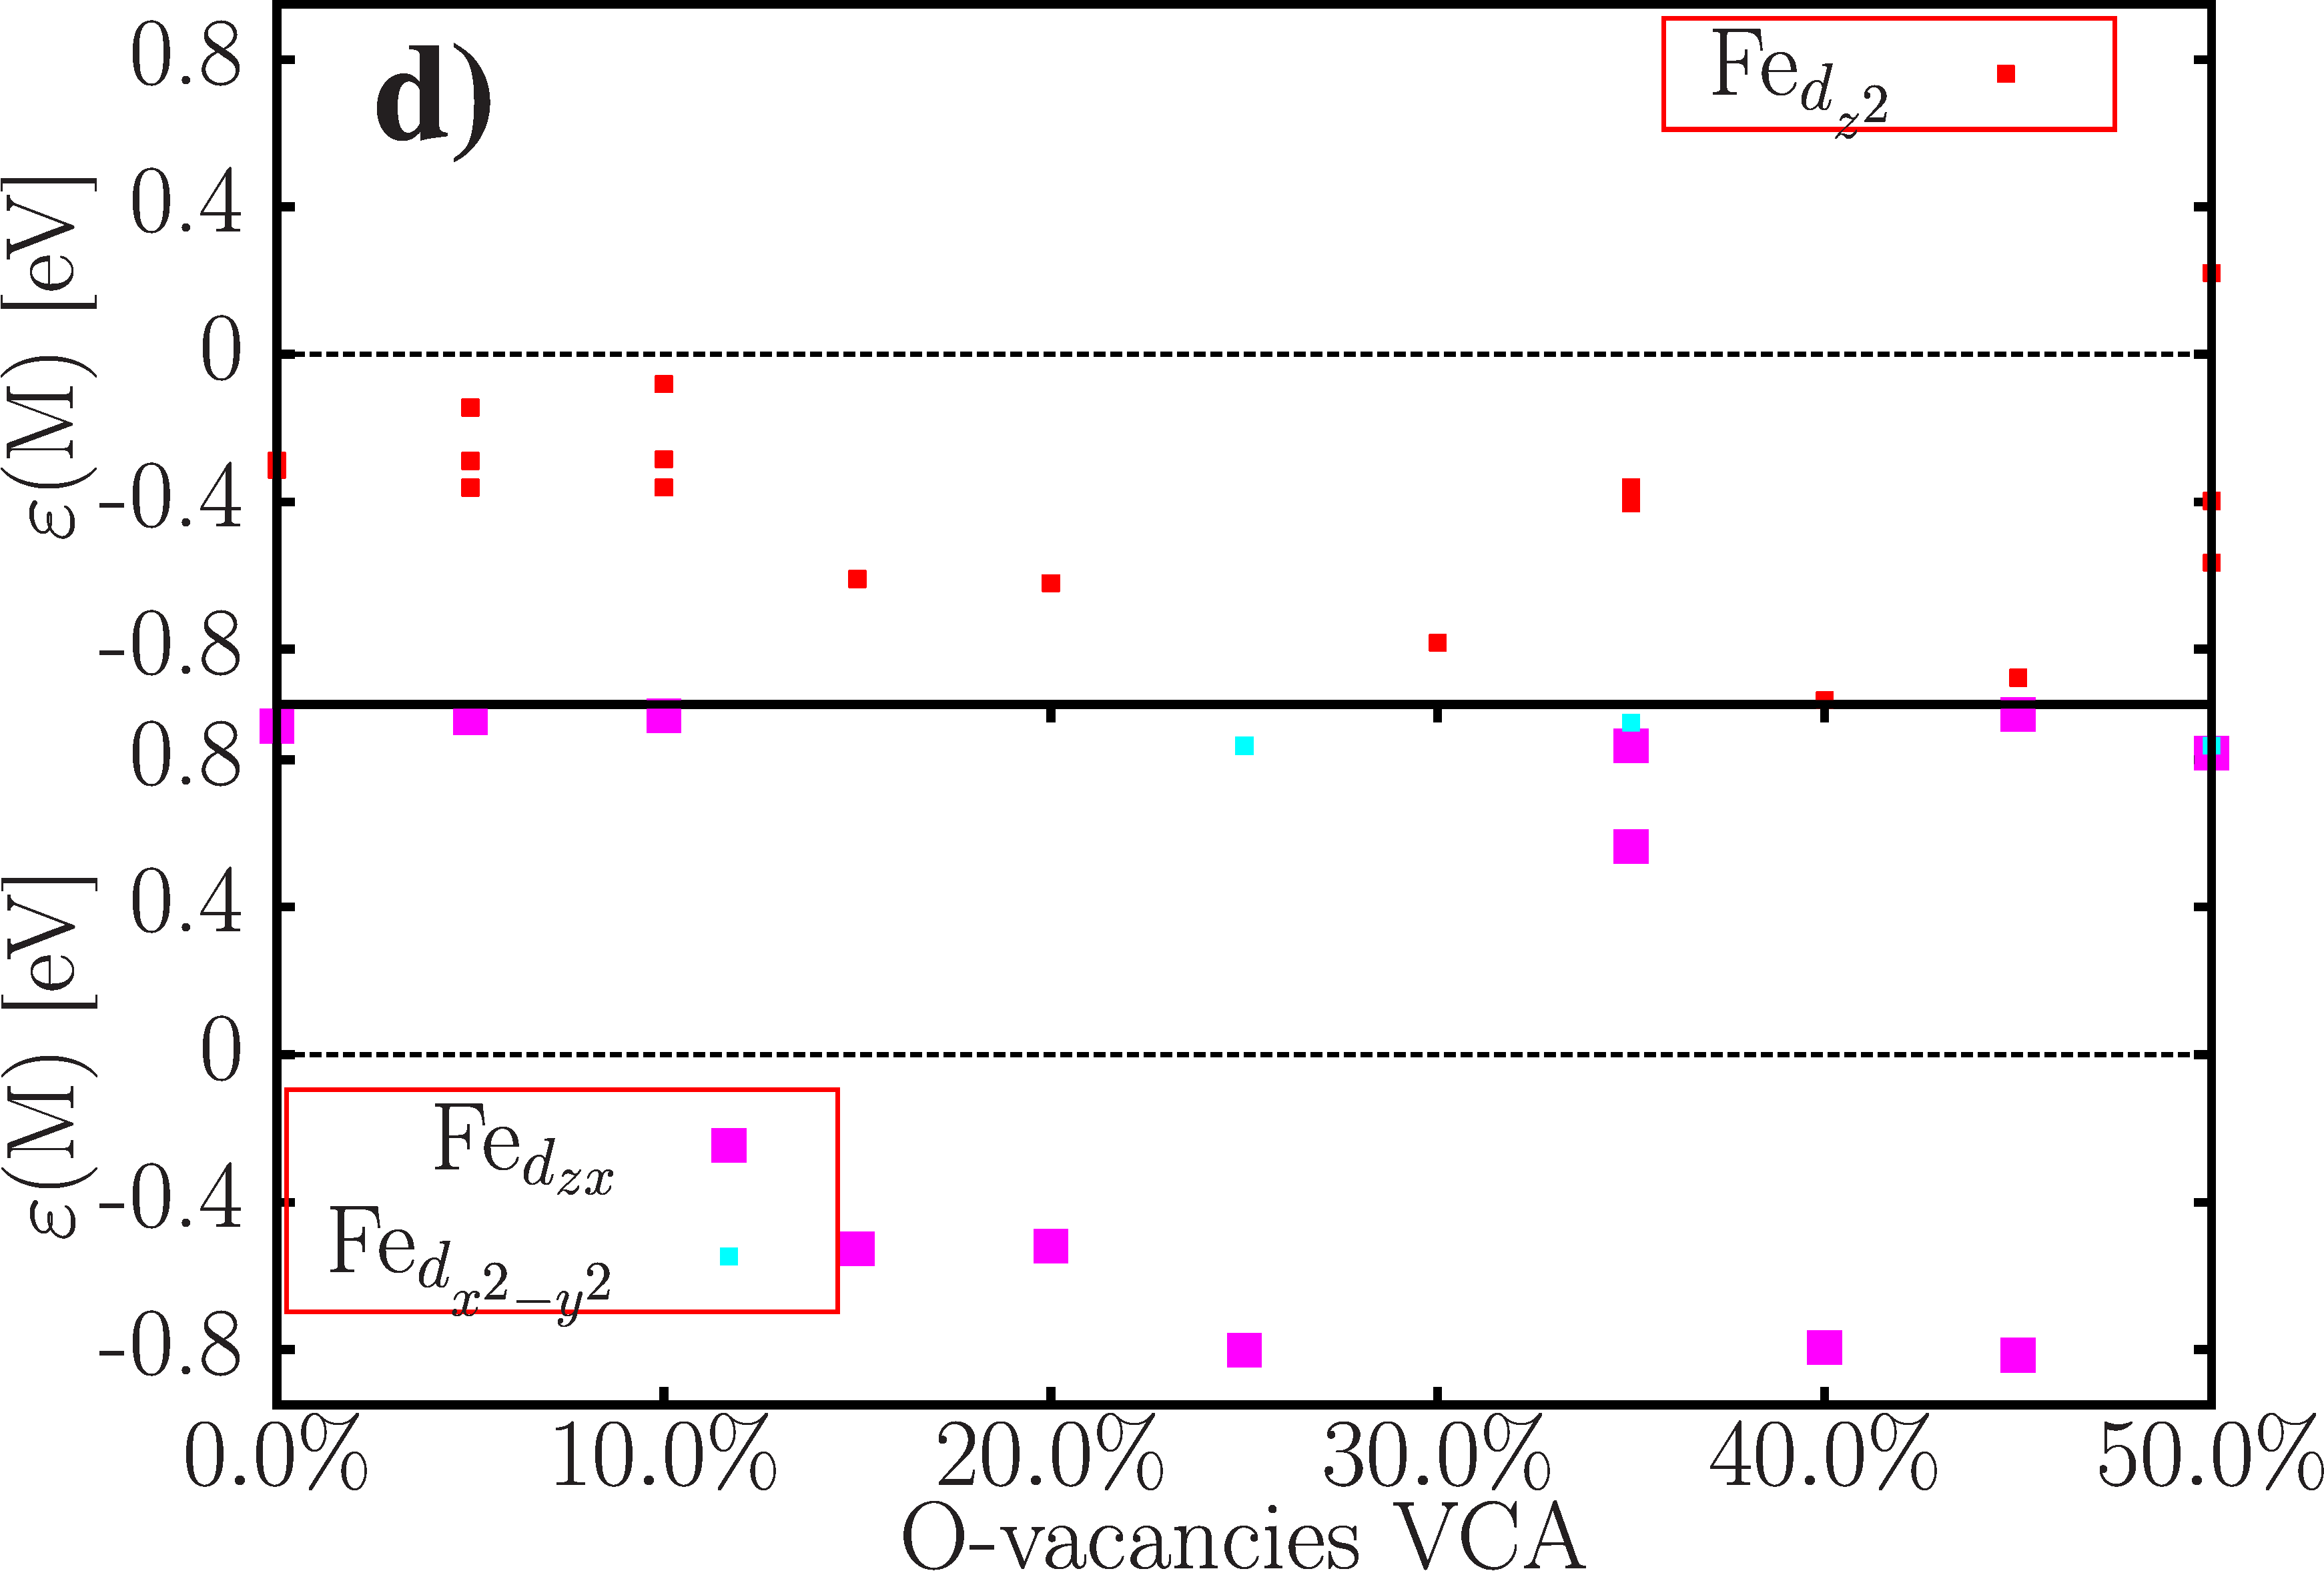
In Fig. 6, we show the evolution of the bands at the and the M point for PBE and PBEsol as a function of O vacancy concentration. We find that the hole pocket at with the majority character is barely modified at first and starts to shift downwards only for rather large vacancy concentrations. It crosses the Fermi level away from the point in all cases considered. Similarly at the M point, the bands are getting slowly electron doped. The differences between PBE and PBEsol are minor.
We repeat the analysis within the AFM state. As before, since the numbers are close, we only perform the analysis for the experimental lattice parameters. In Fig. 7,
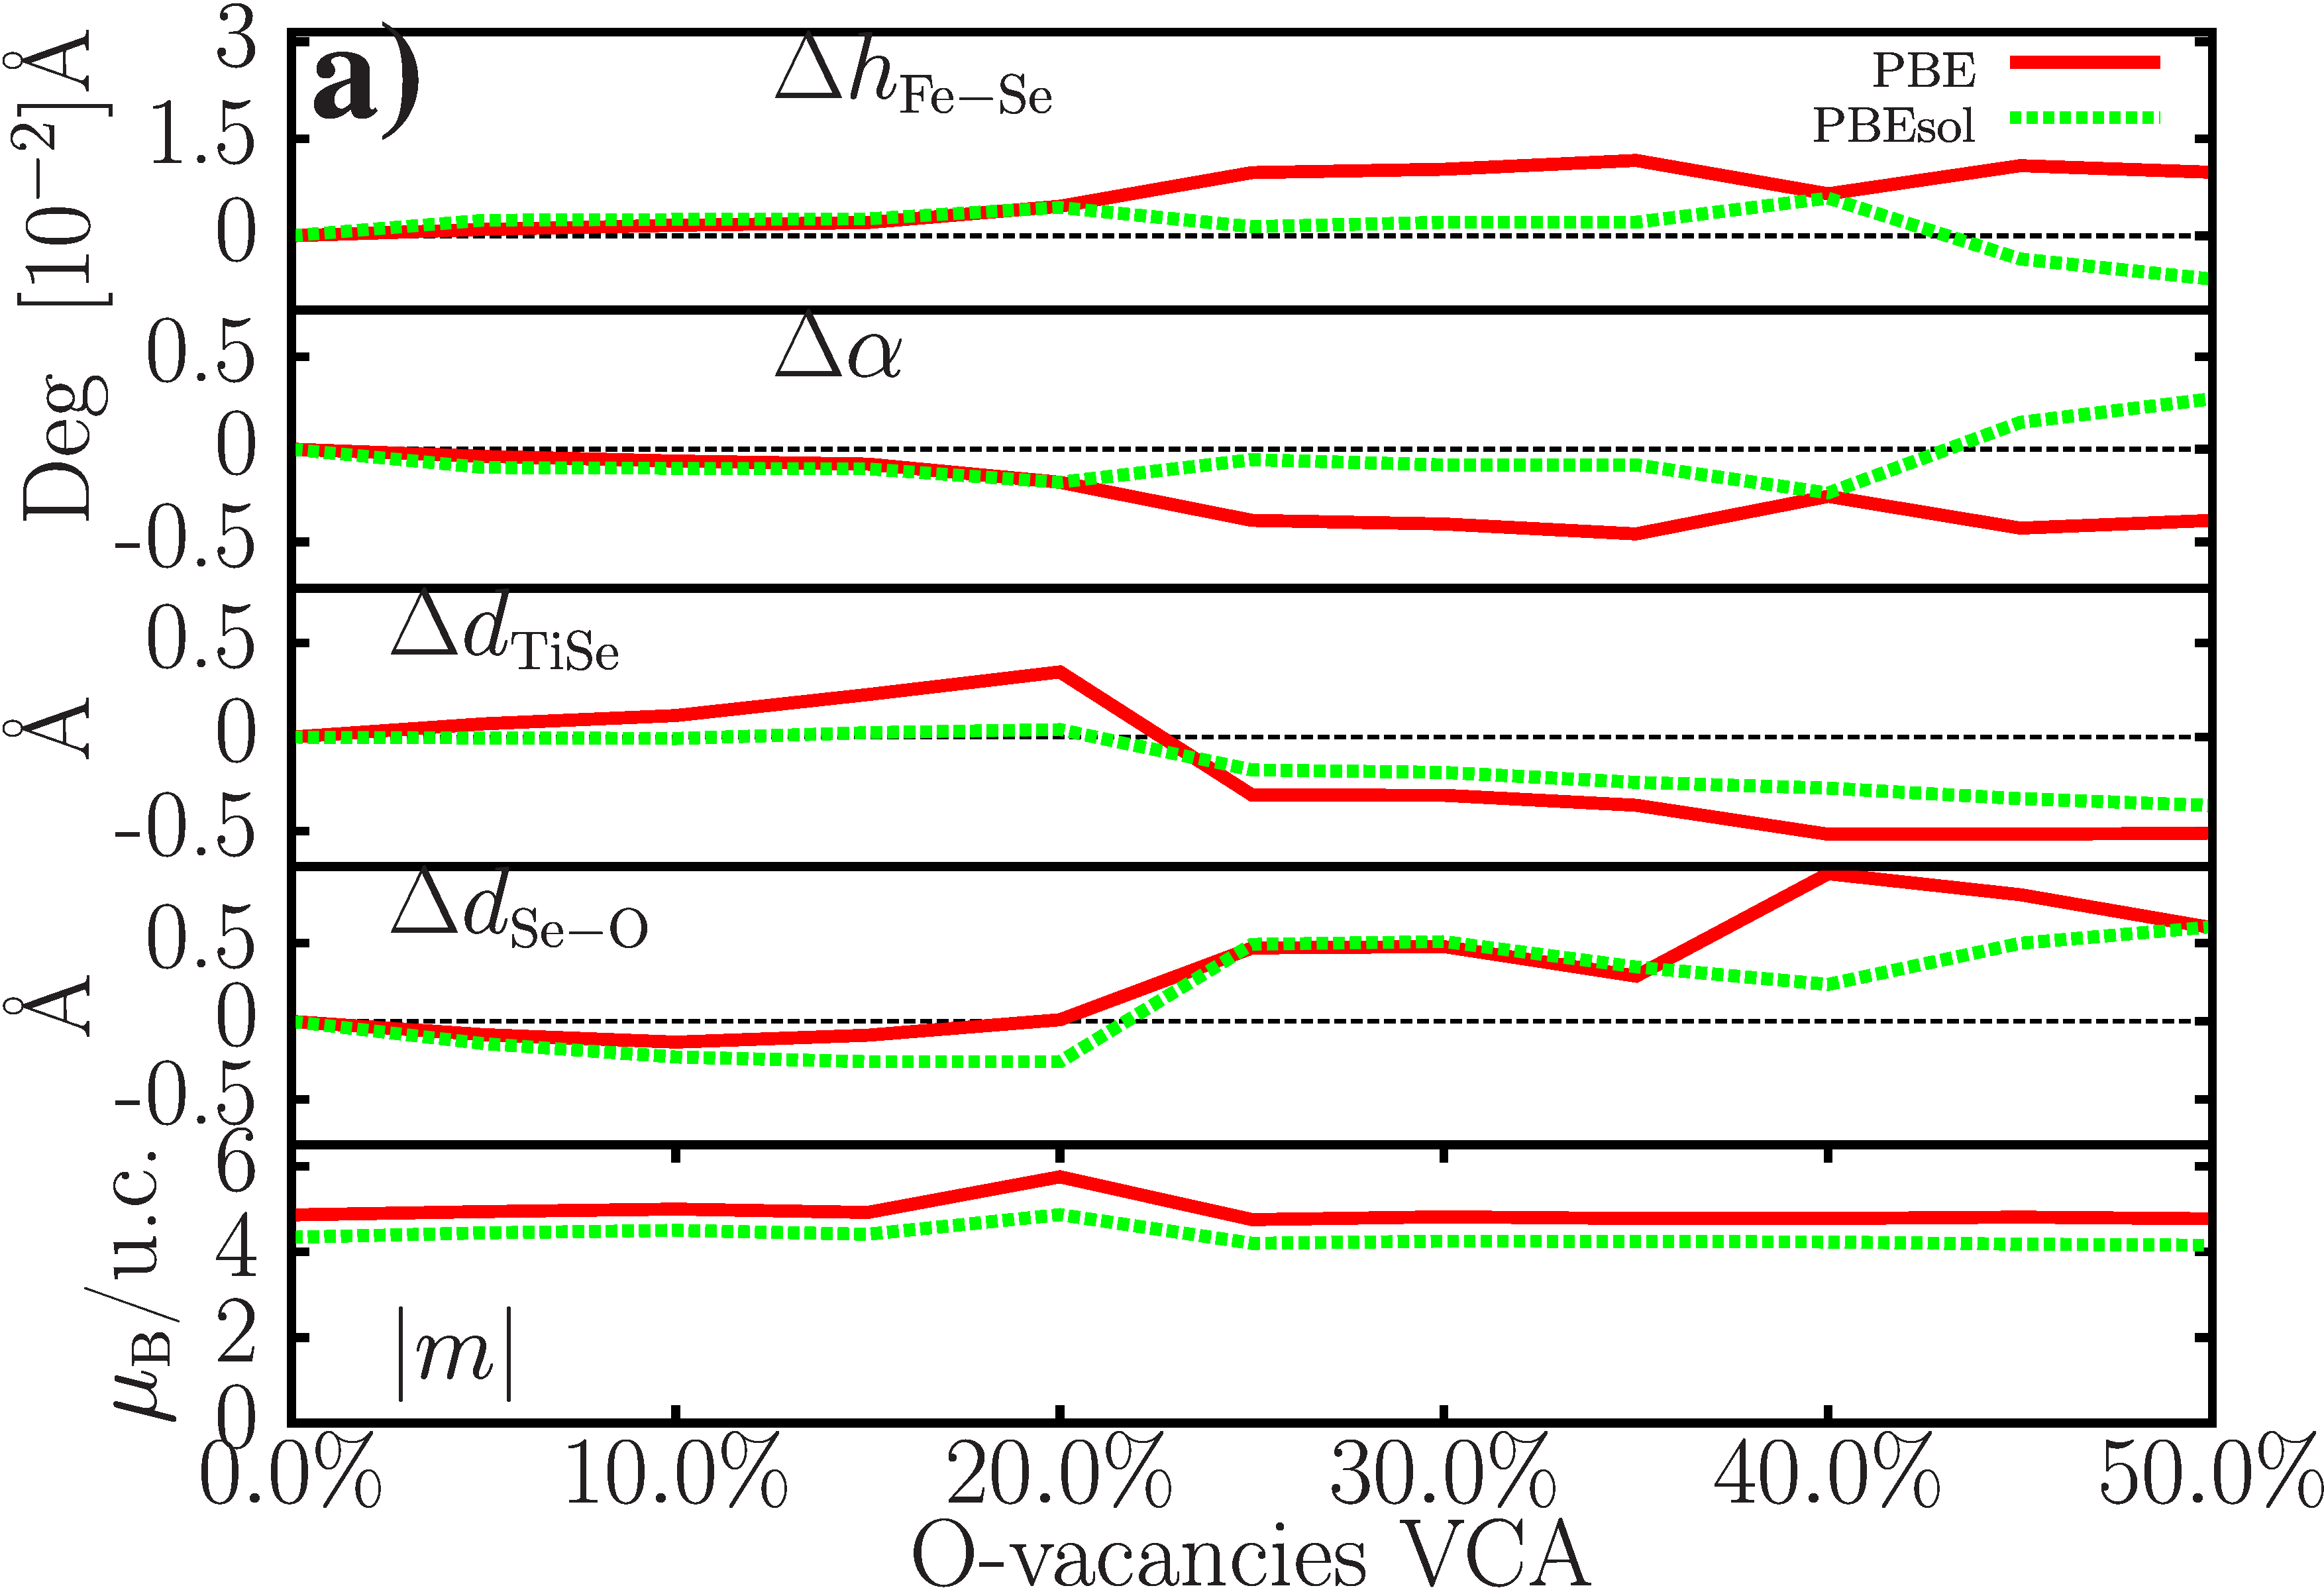
we see that the structure follows a similar trend as the non-magnetic state in the sense that vacancy doping has barely any effect on structure parameters within the FeSe film. As before, we recover the behavior of the increasing bonding distance of the FeSe film for low vacancy concentrations. Again, the effect is only prominent in PBE.
As a side note, we observe that the magnetic moment is increased as compared to a bulk calculation. Interestingly, there is a small antiferromagnetic polarization induced in the first oxygen layer at 20% vacancy doping. The moments are of order 0.2/O in PBE and thus contribute 10% to the total magnetization. The moments of the O are aligned with the Fe at the same position in the unit cell. Otherwise the magnetization of the FeSe layer which itself is only weakly affected by vancacy doping, does not extend to the STO.
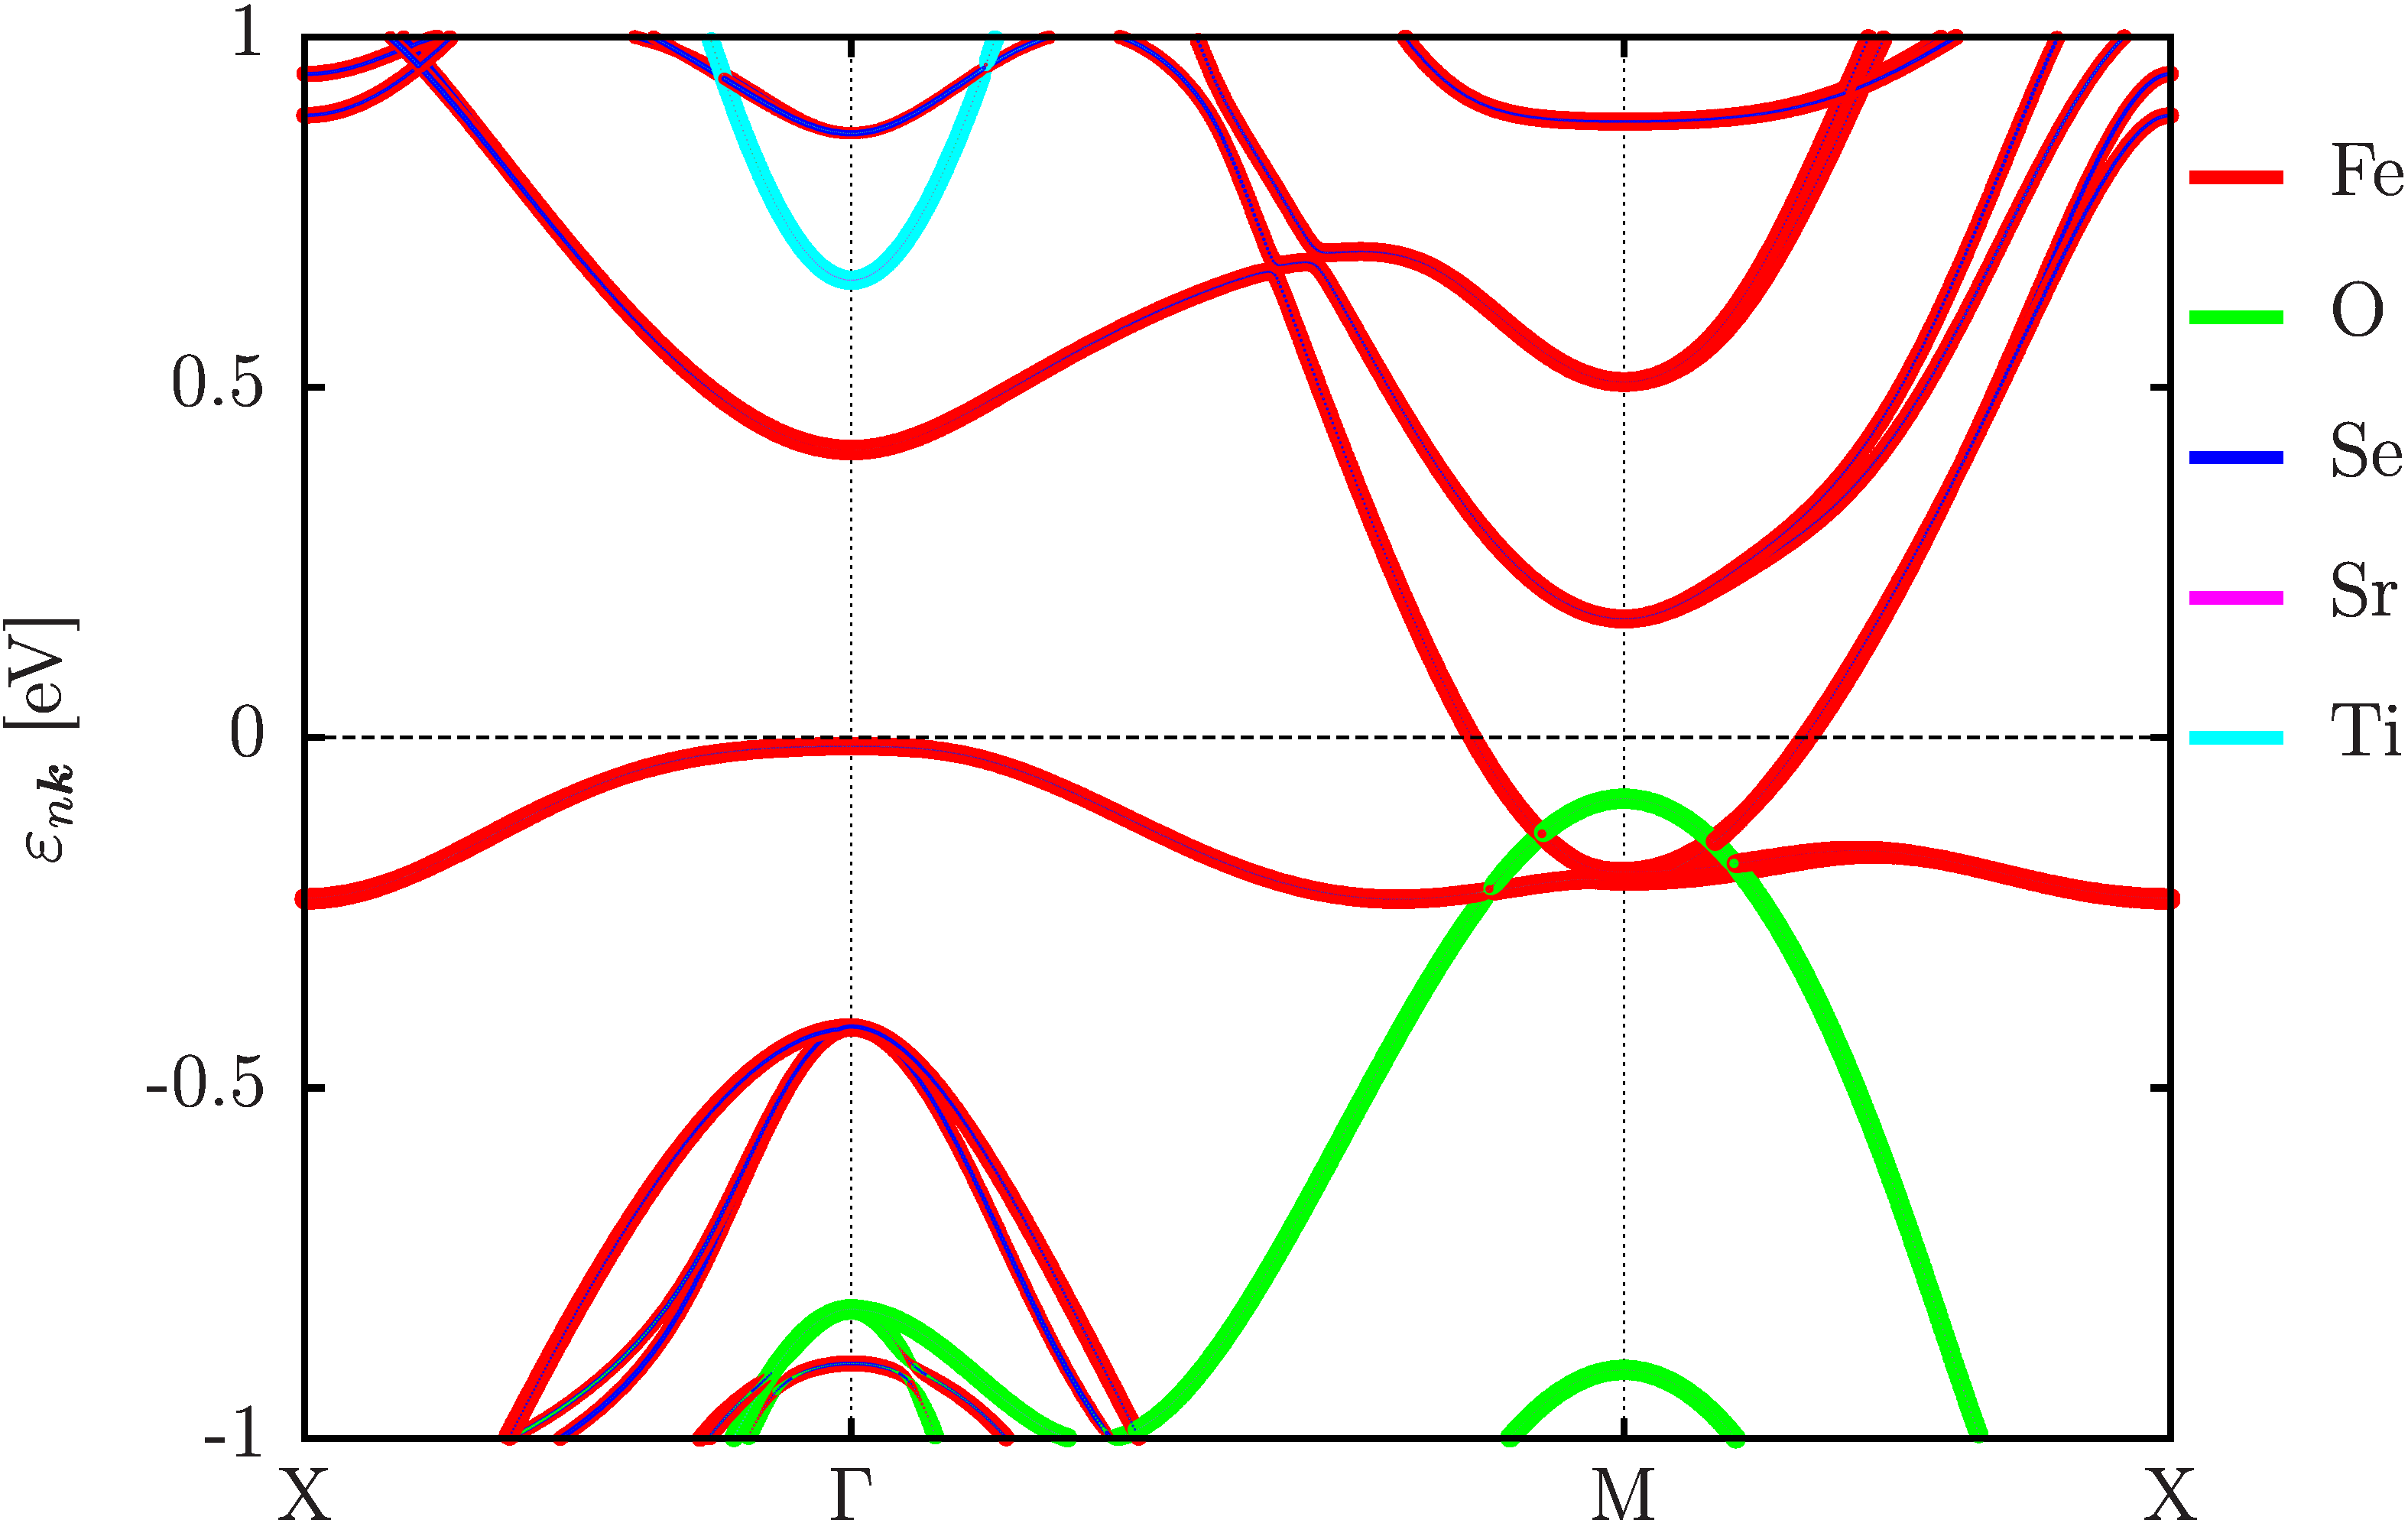
The charges on the Fe site, on the other hand, first increase indicating that the surface gets, in fact, slightly hole doped for very low concentrations before the trend is turned around and the expected electron doping is recovered. In Fig. 8, we investigate the behavior of the bands at and M as a function of vacancy concentration. As was to be expected from the Bader analysis, there is only a minor effect on the Fe orbital bands at the Fermi level for low vacancy concentrations. Starting at about 25%, the hole band at sinks below the Fermi level.
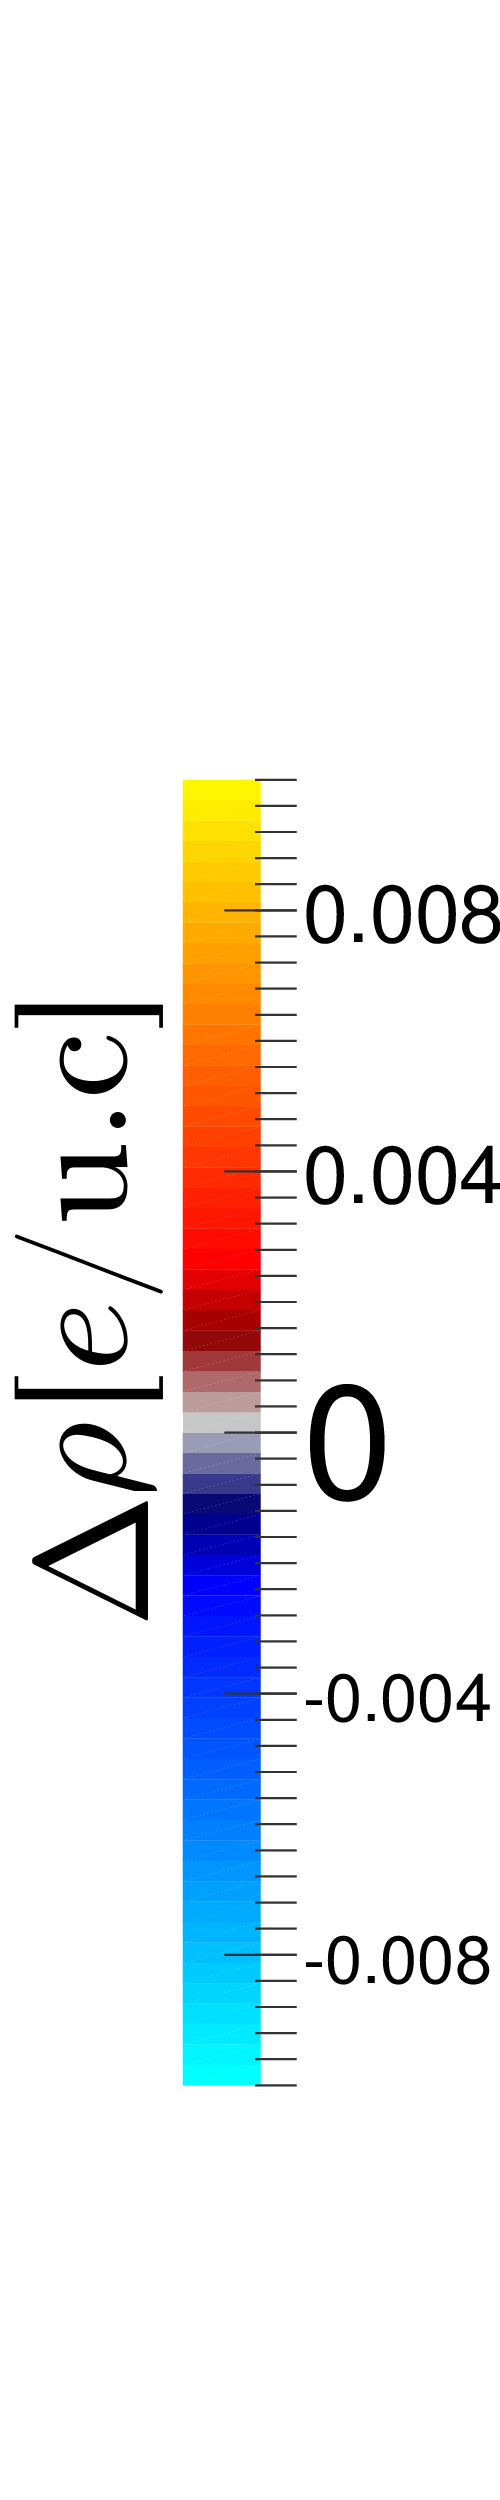
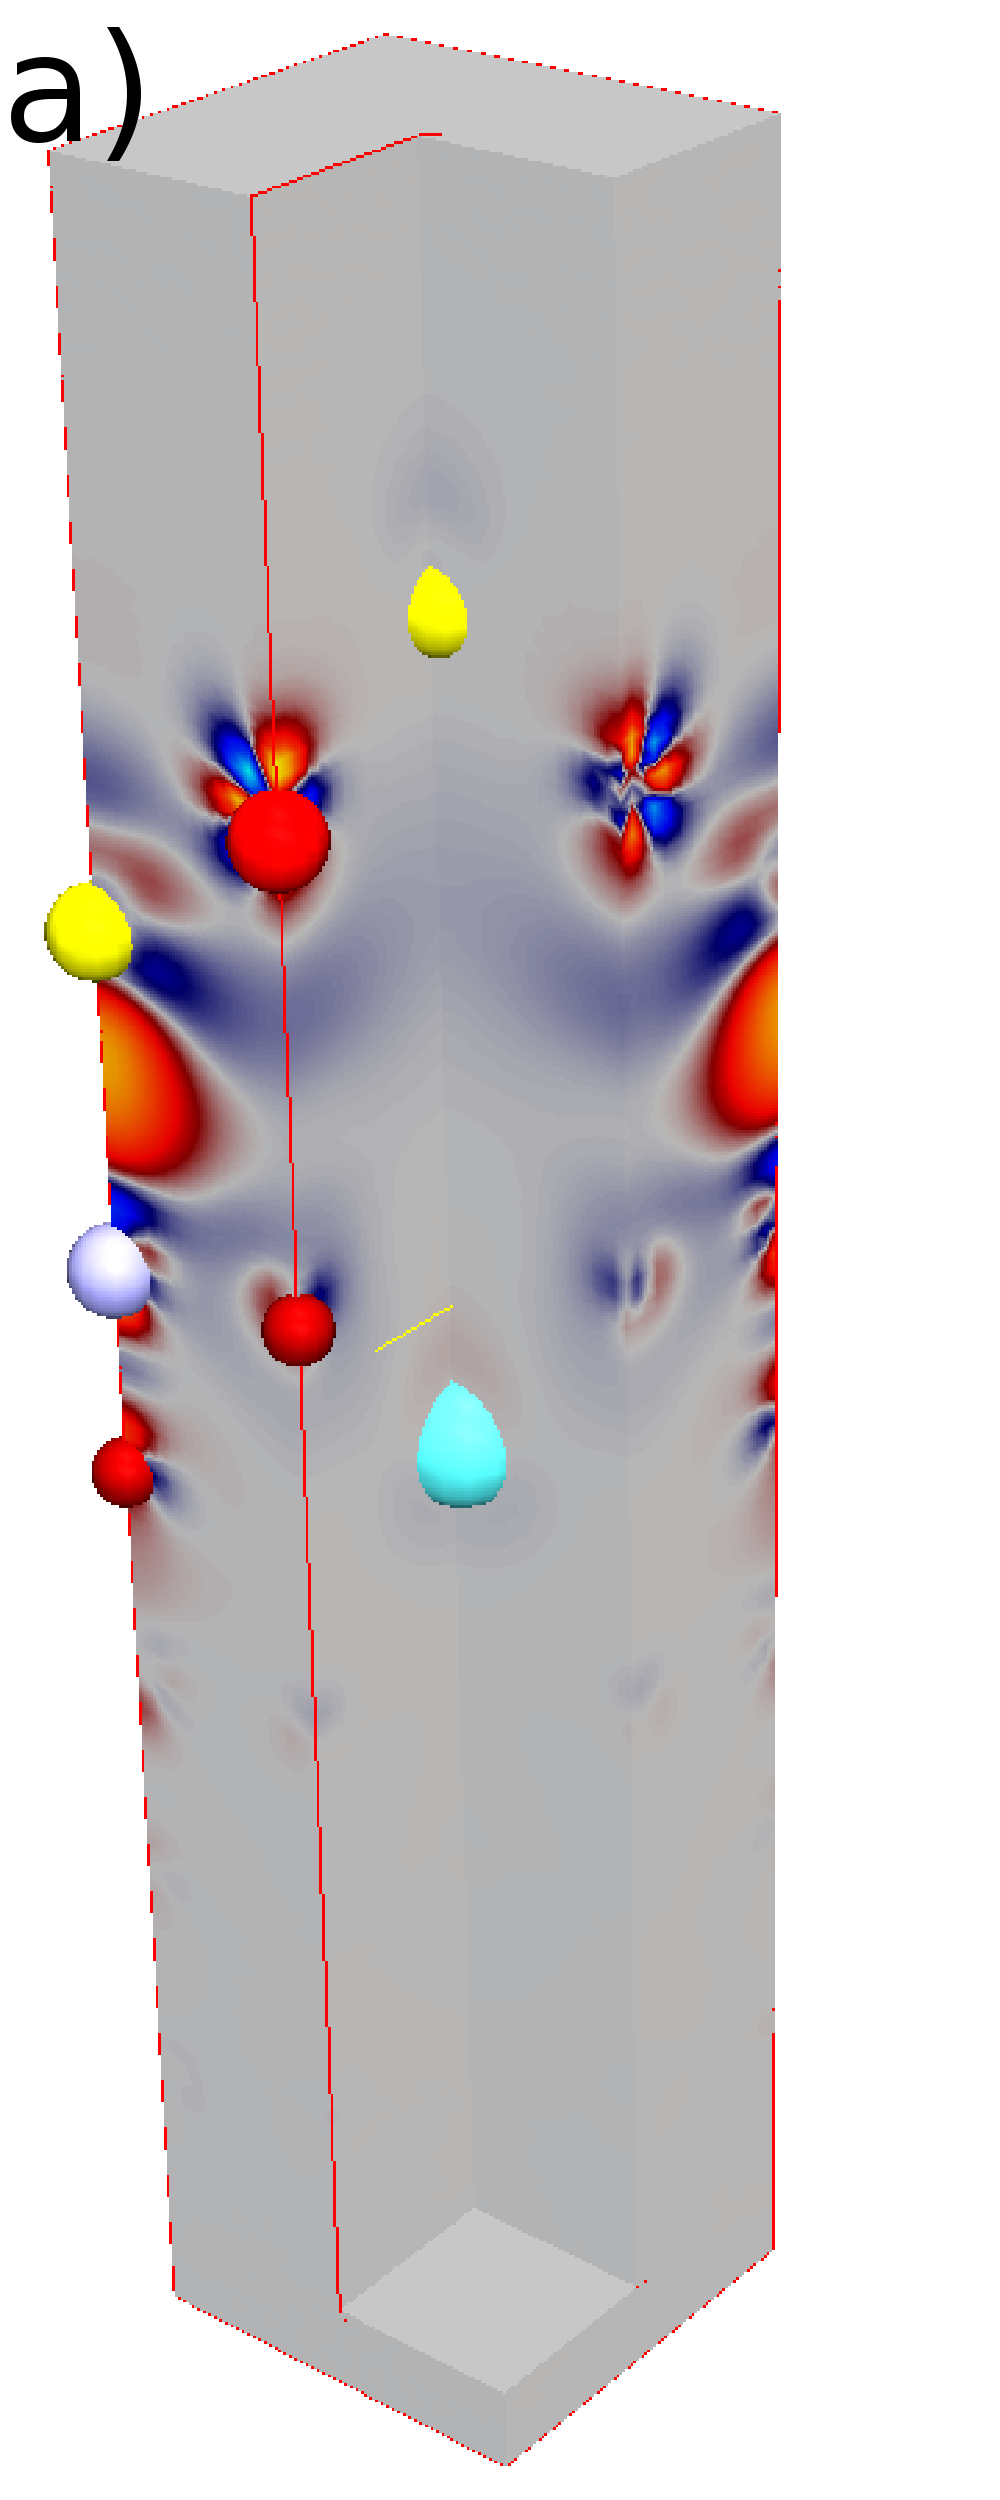
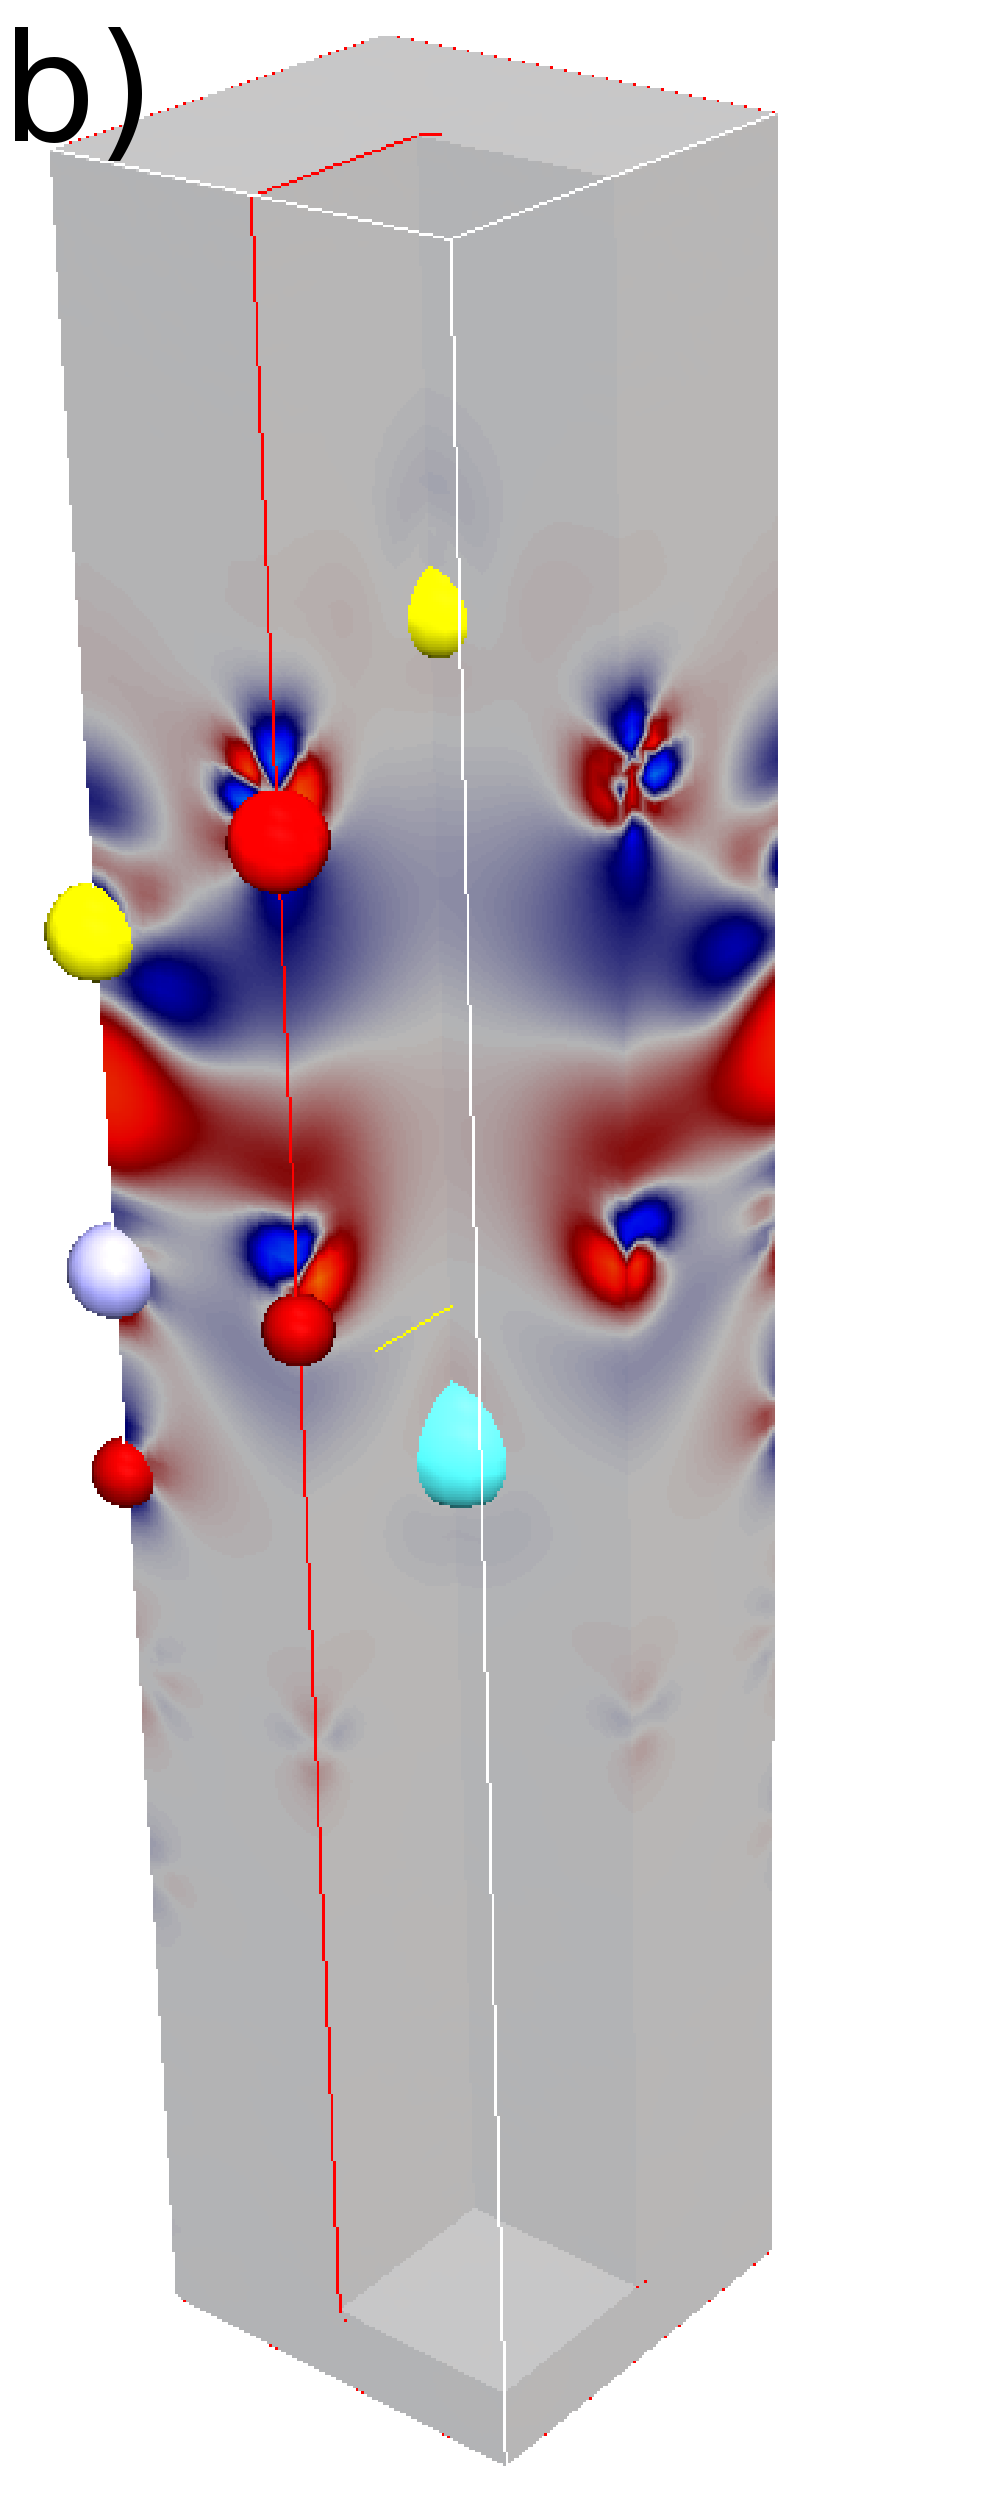
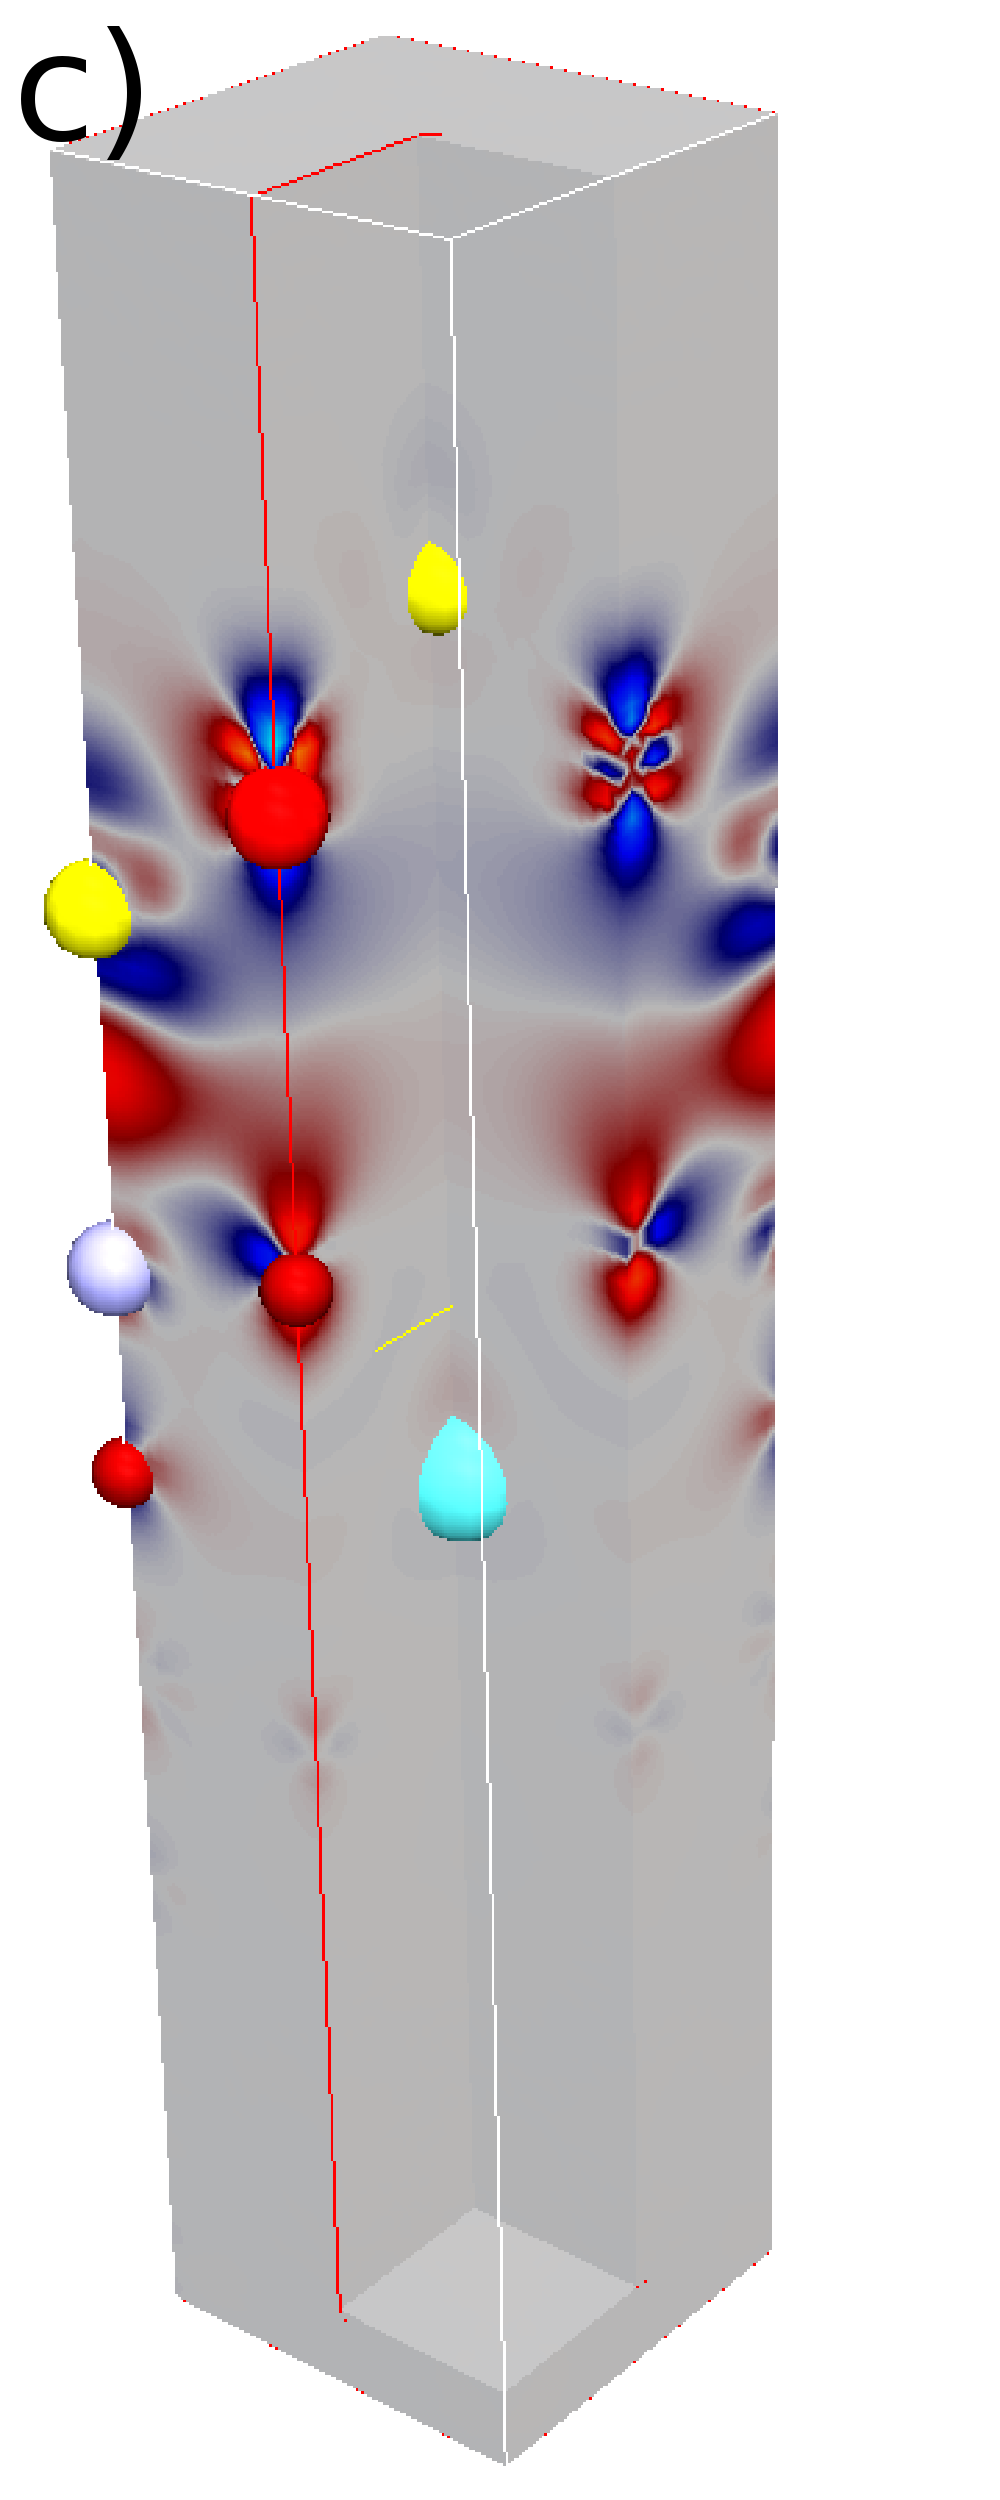
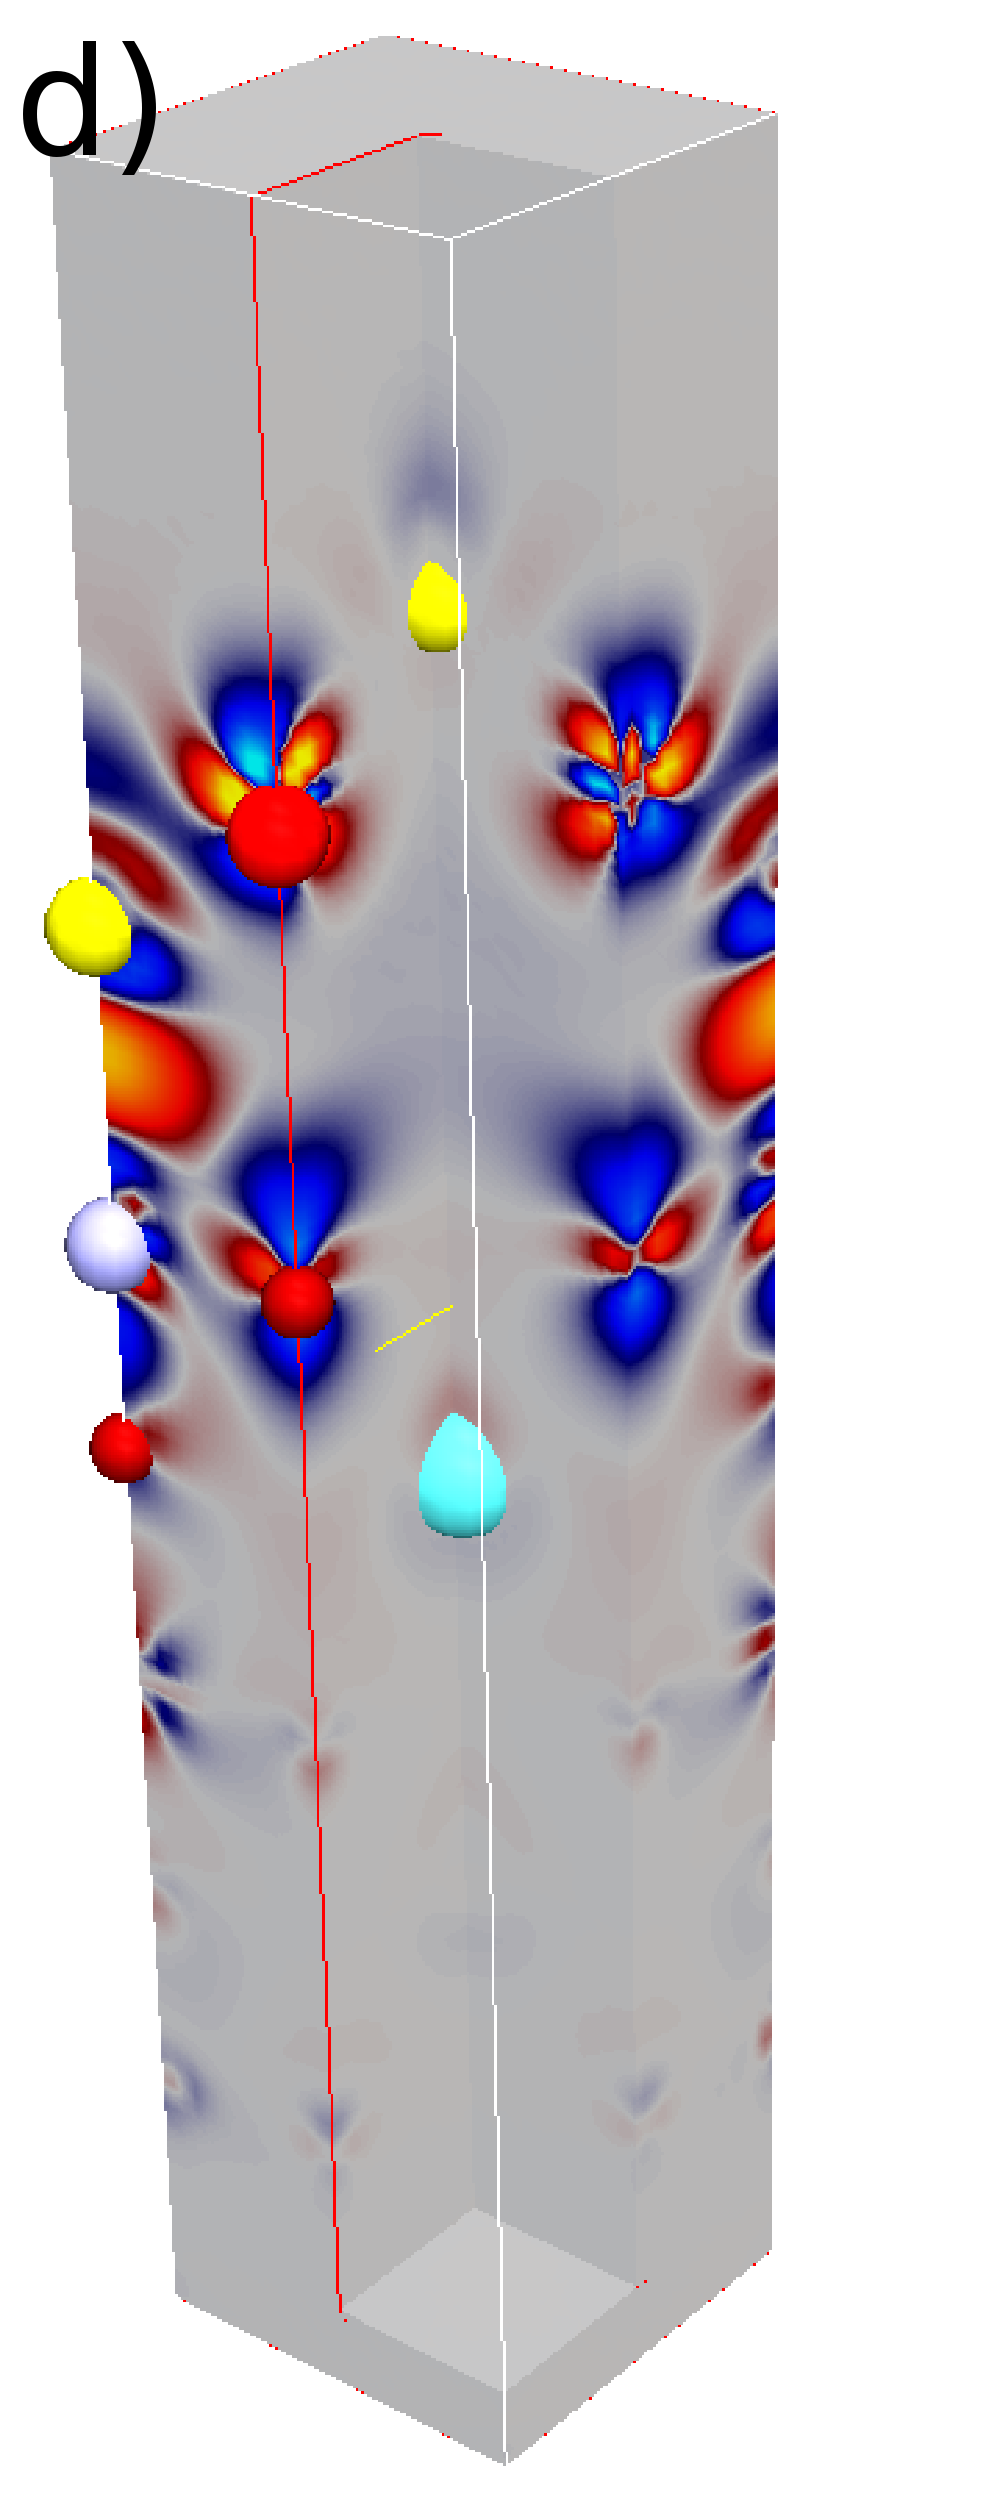
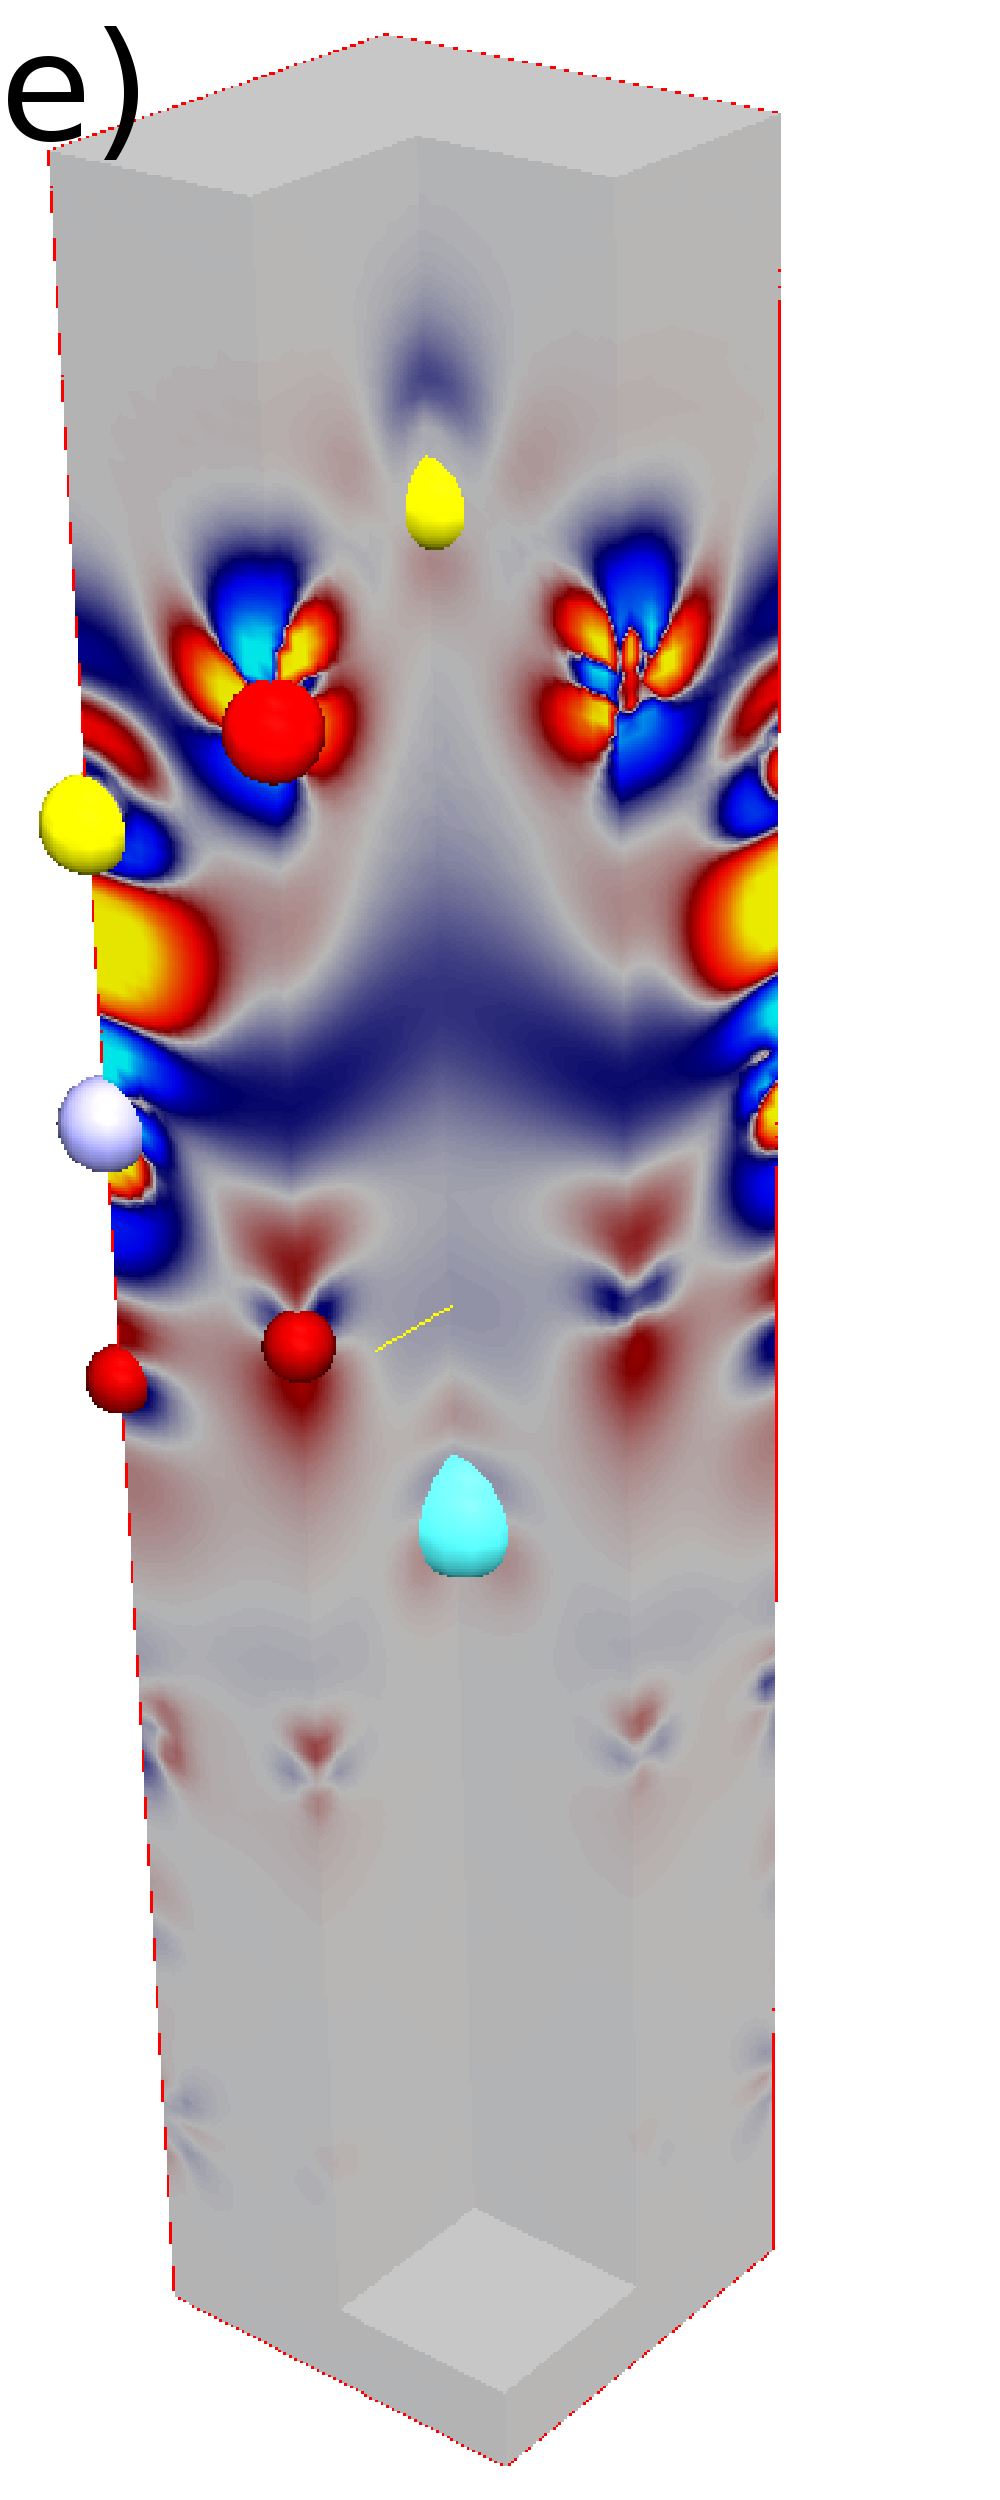

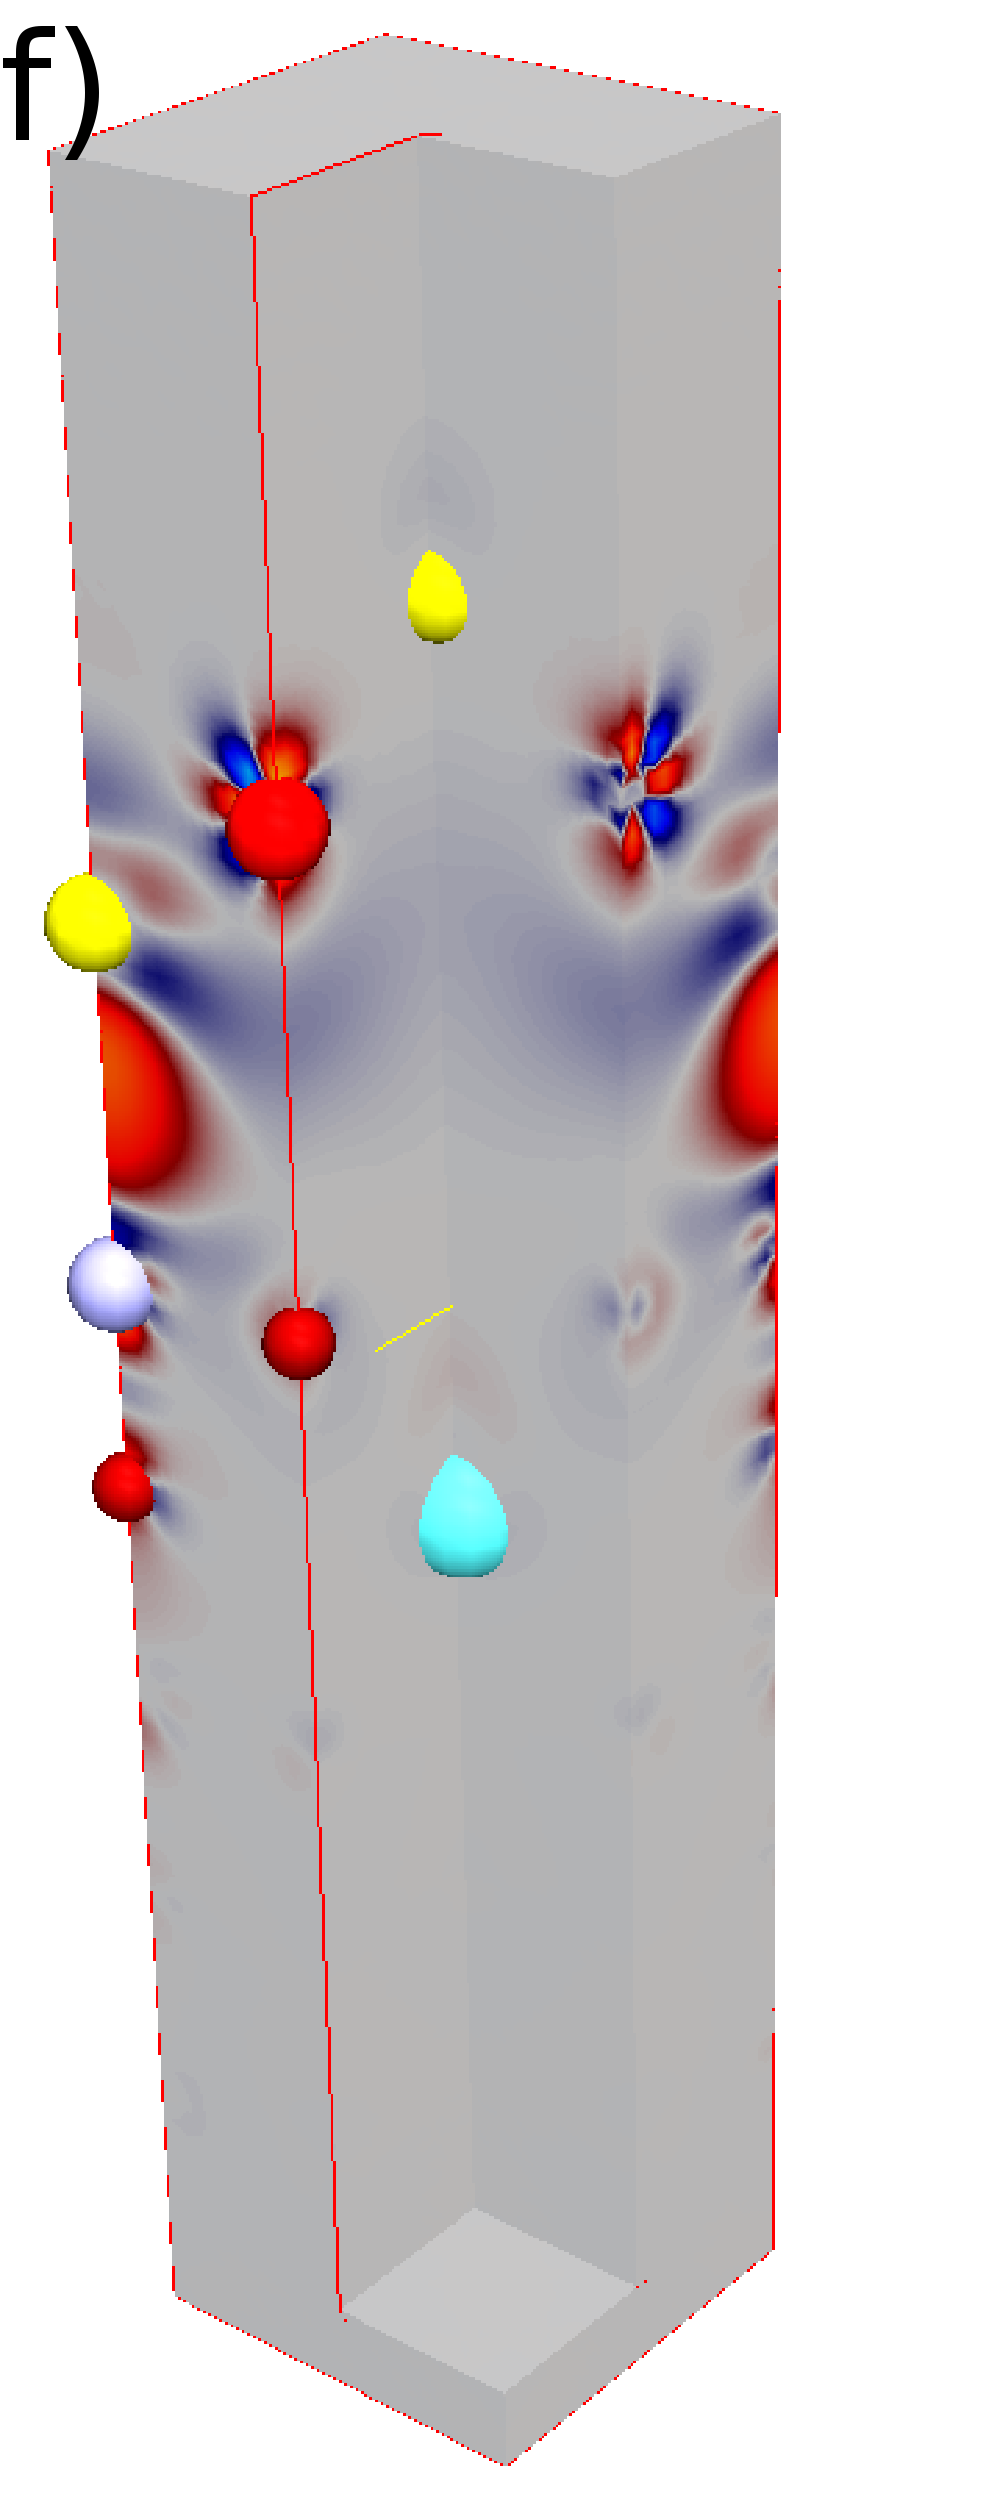
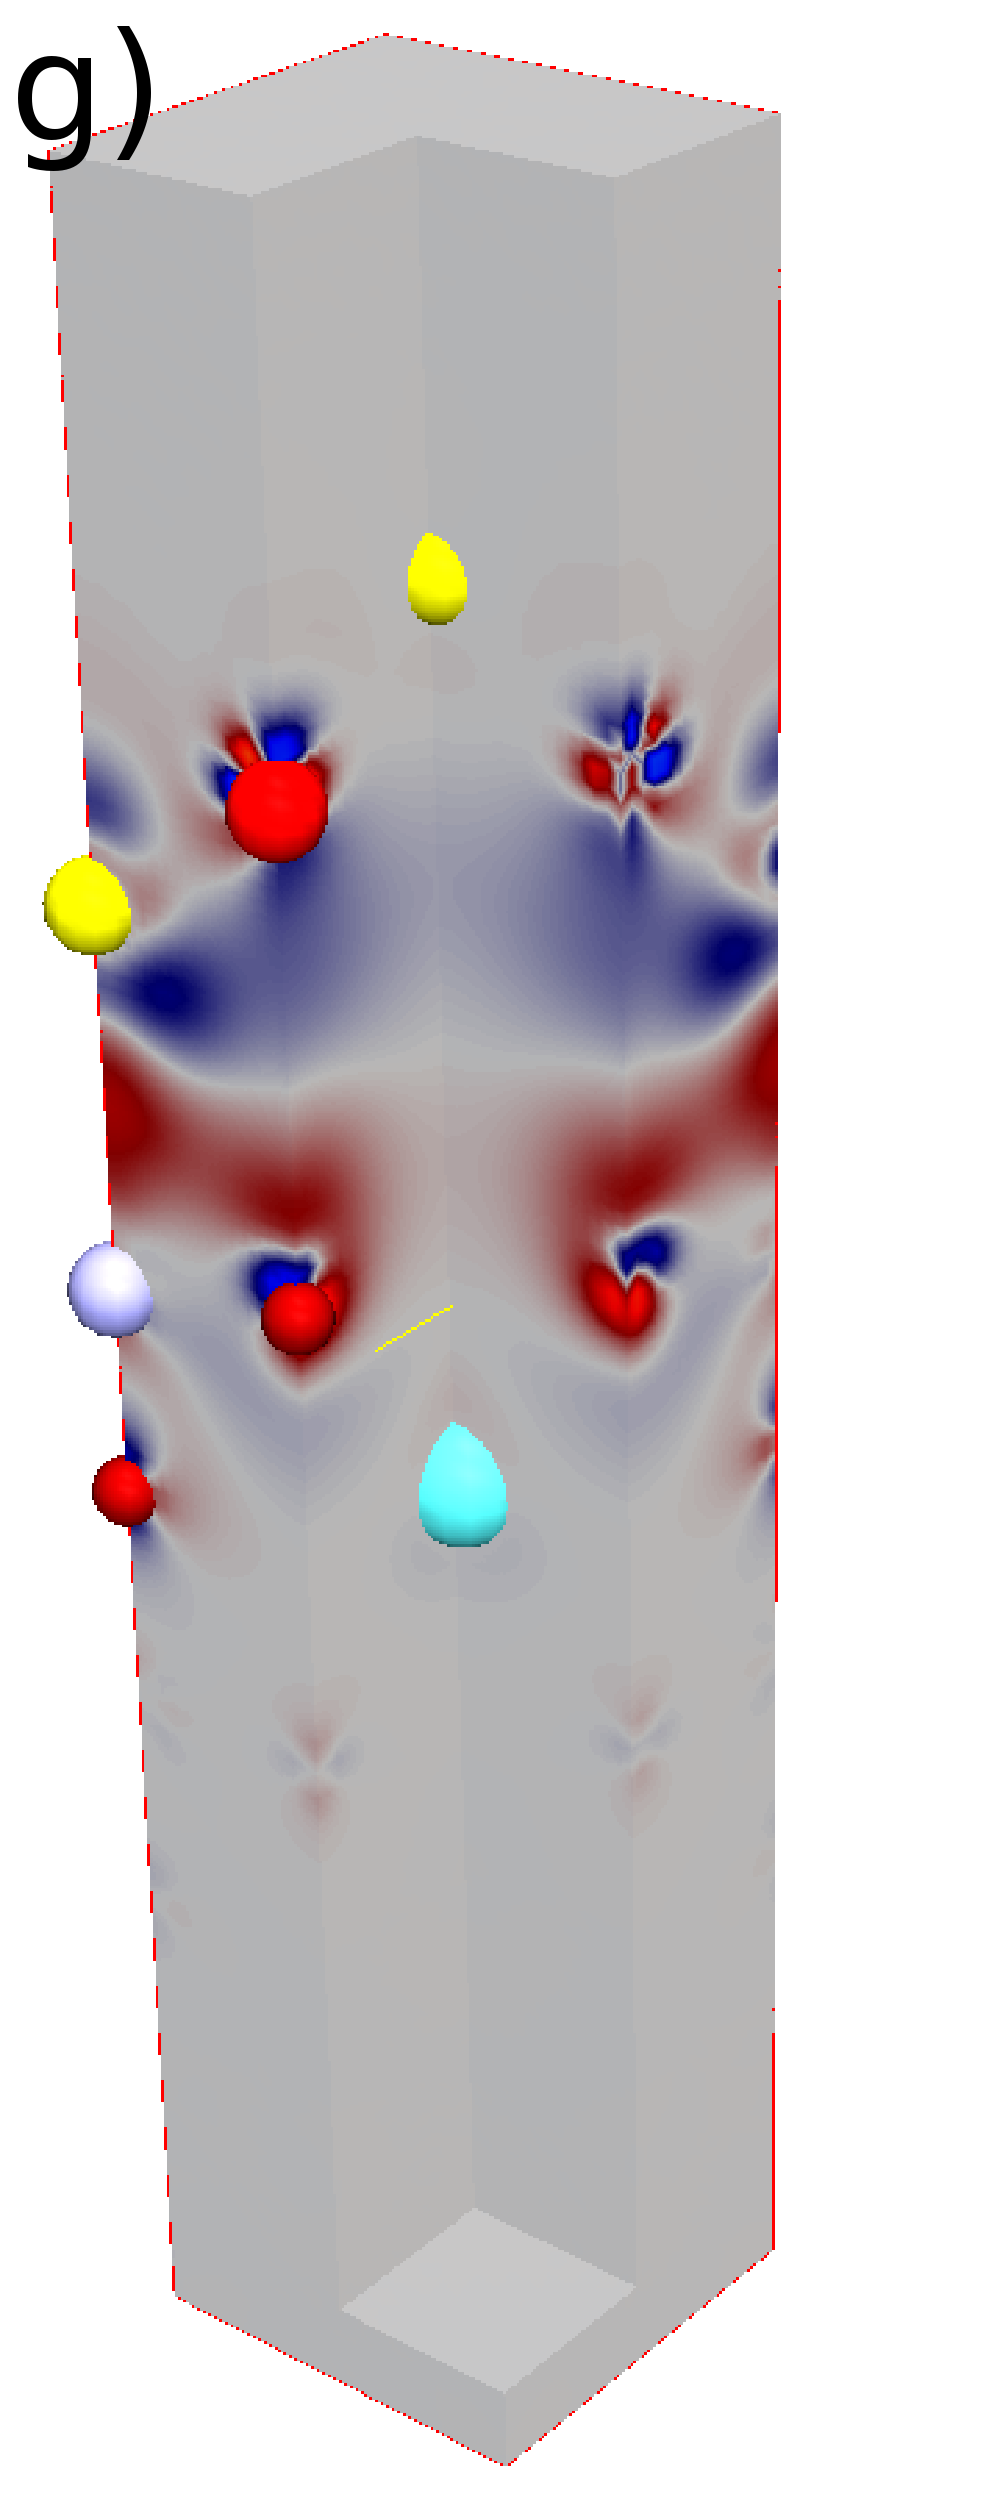
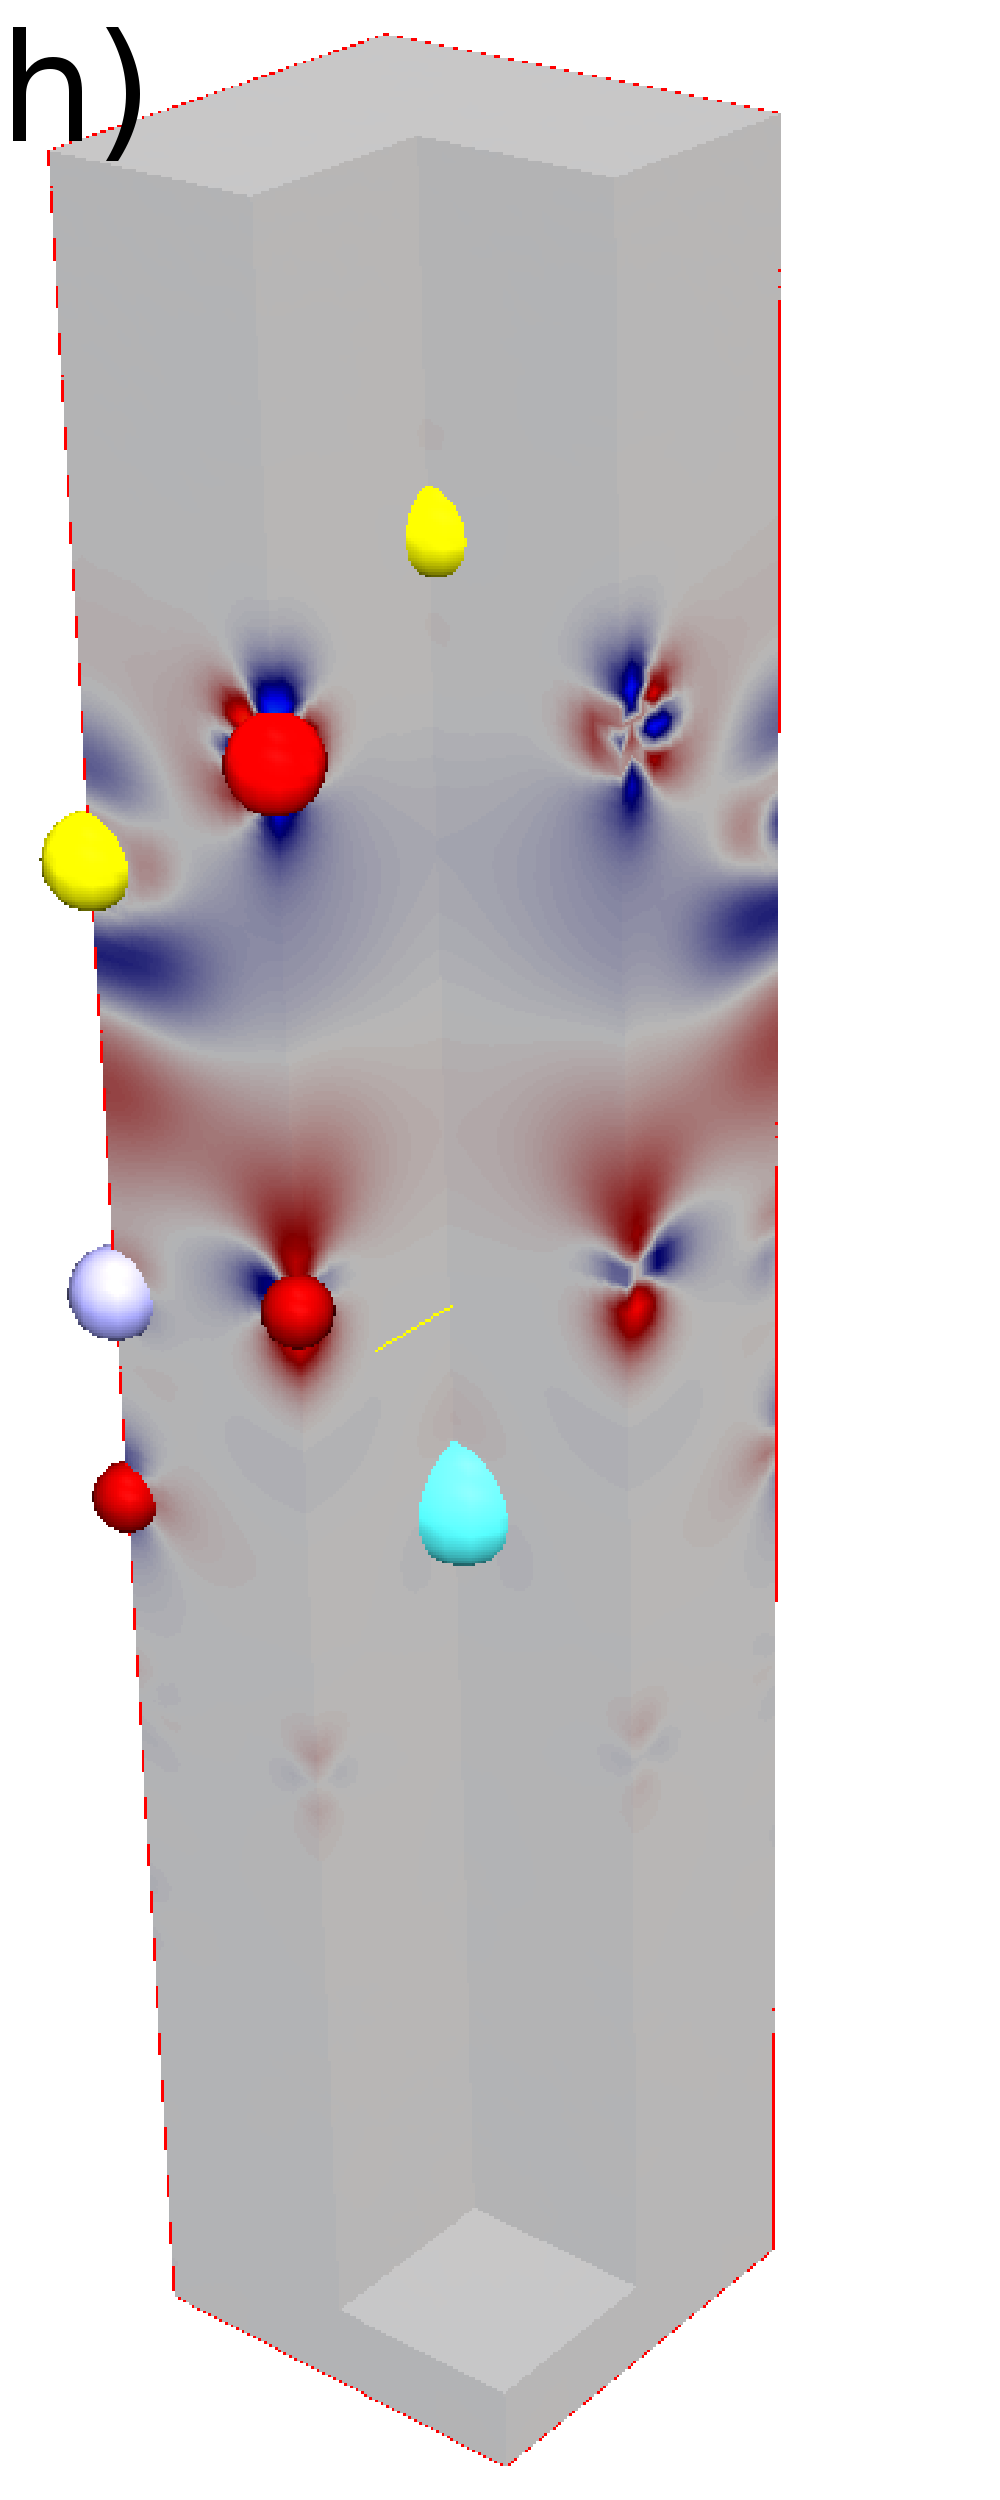
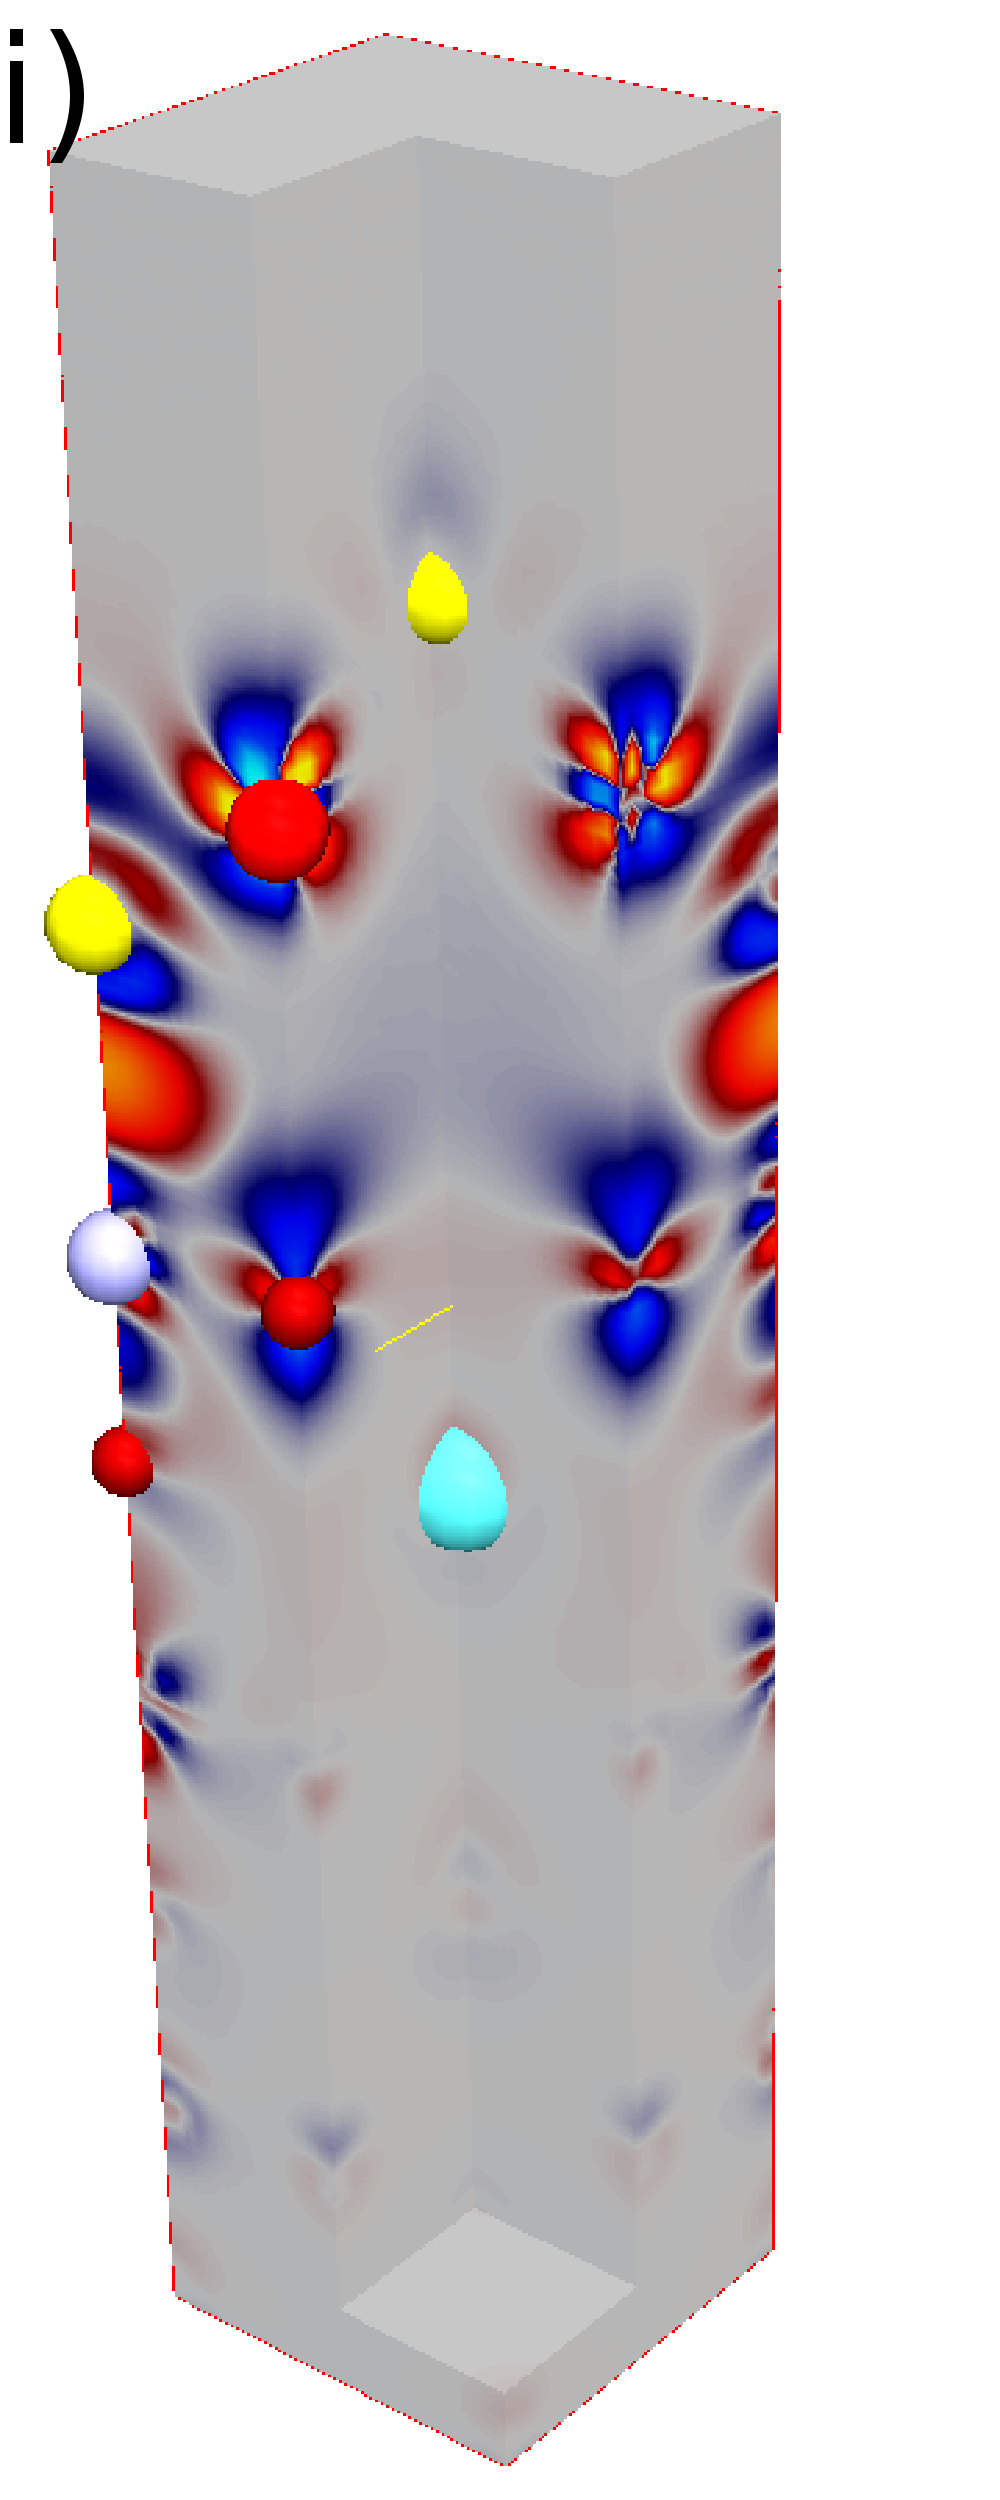
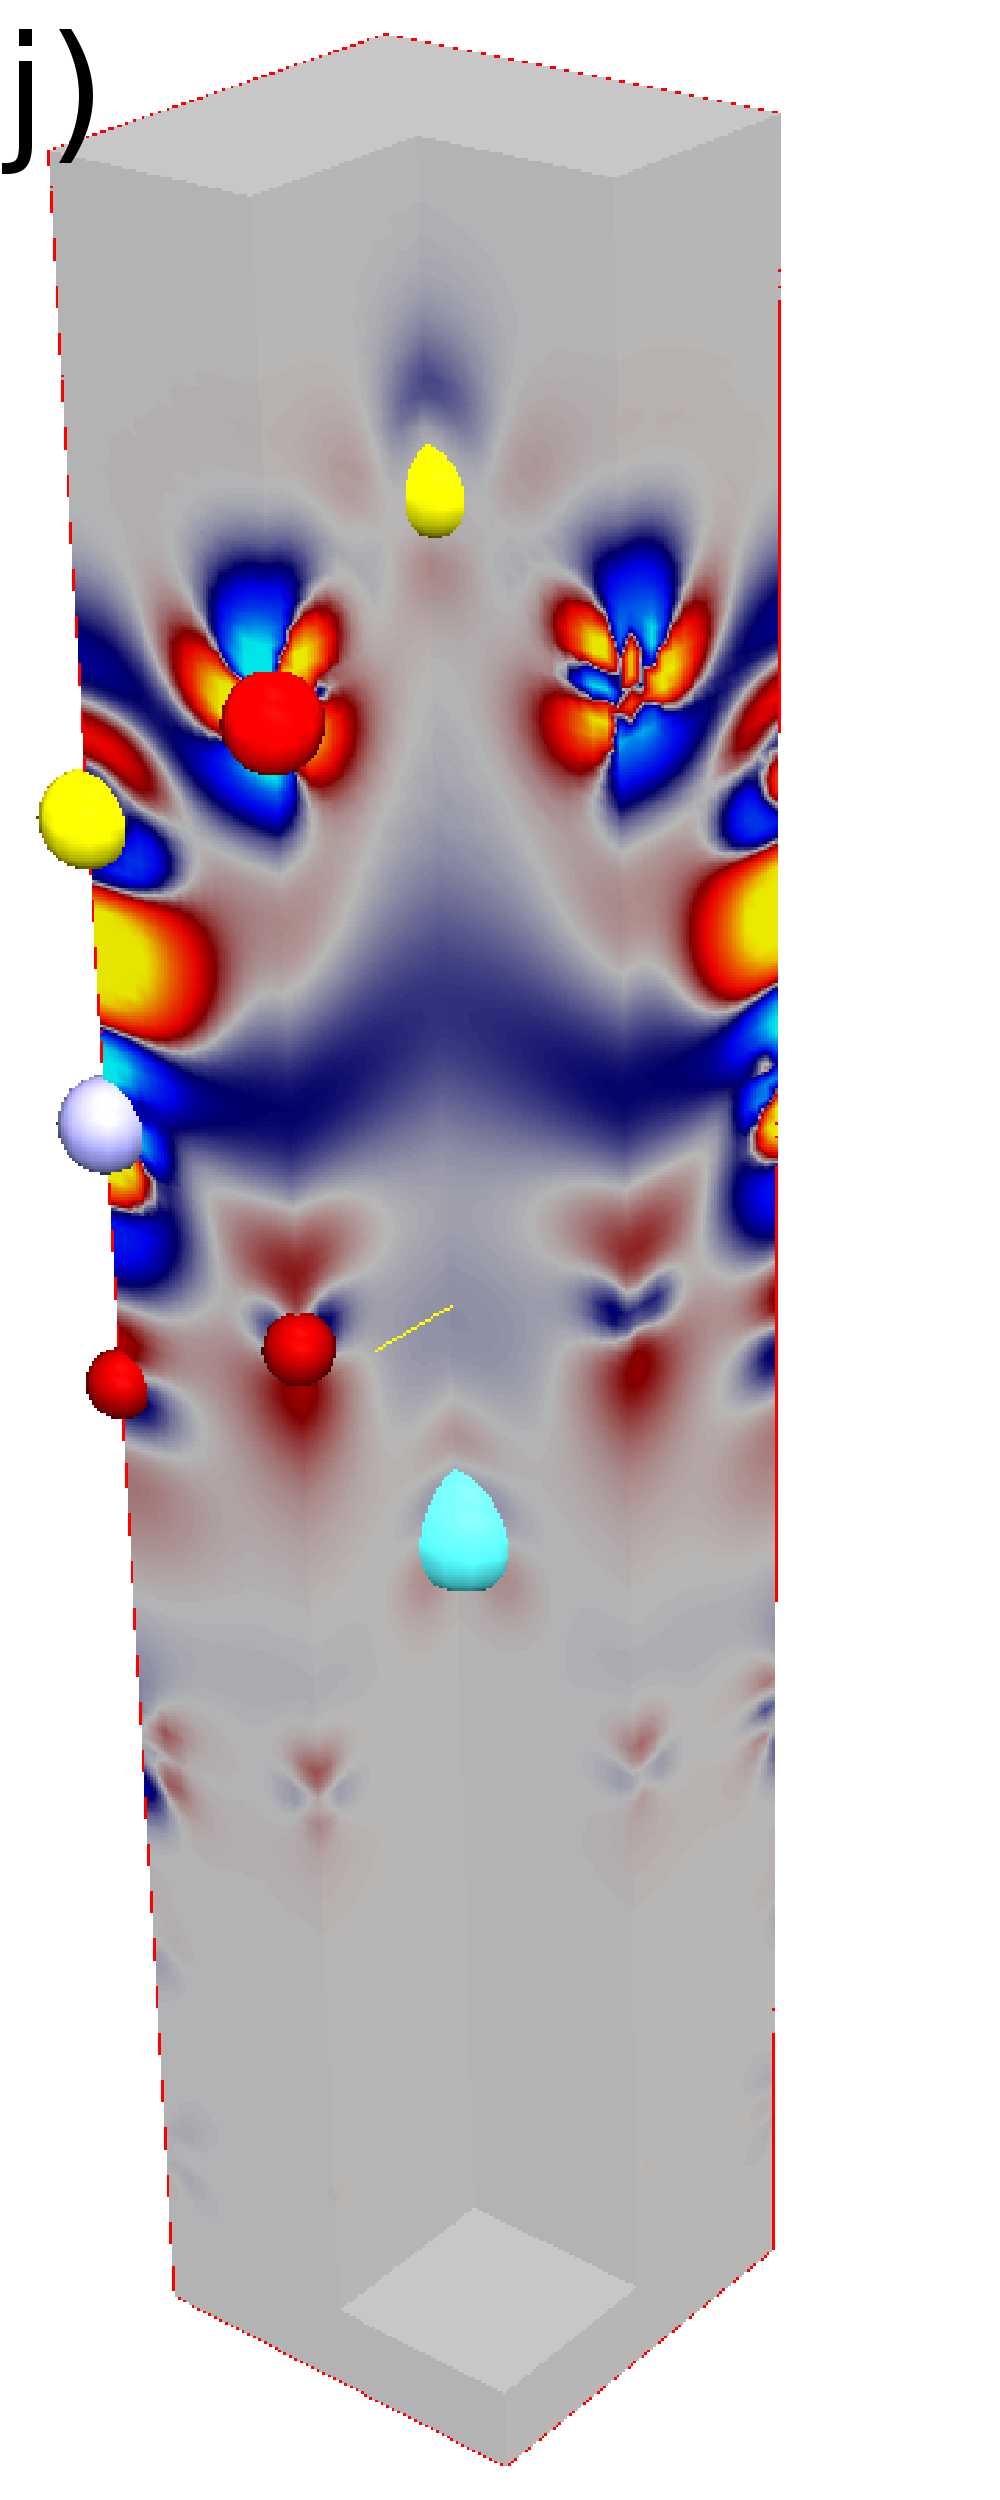
We conclude this analysis by highlighting the nature of the chemical bonding structure that causes the initial unexpected increase of the bond length with vacancy concentration. In Fig. 9, we show the differences of first the combined layer plus substrate where we subtract the sum of individual densities of surface and substrate alone. This way, we can see where the chemical bonding of atoms redistributes charge. As we focus on the interface interlayer bond length, we perform this analysis in the NM state. We show the evolution of the bonding structure in steps of 10% oxygen vacancies, on the top in Fig. 9 for PBEsol and on the bottom for PBE. The structure is, again, very similar for PBE and PBEsol. For the stoichiometric interface [Fig. 9 a) and f)], we find a predominately covalent bond, where the charge is pulled in between the Ti and the Se atom. There is also a charge redistribution among the Fe orbitals visible. Then, the bond obtains an ionic character at and [Fig. 9 b)-c) and g)-h)], where charge from the Se part of the FeSe layer is pulled to the STO region before a more covalent nature reappears in Fig. 9 d) and i) while for even higher vacancy concentrations of 40% [Fig. 9 e) and j)] charge is predominantly pulled from the STO region to form a covalent bond of Ti with Se that also has a partly ionic charracter visible by the blue regions close to the Ti atom. The only significant difference between the two functionals is the strength of the bond, which turns out to be weaker in PBE.
VII Discussion and conclusion
In conclusion, we find that the electronic and lattice structure of the FeSe monolayer on STO in the antiferromagnetic state is in much better agreement with experimental findings than the non magnetic calculation. This goes hand in hand with the observation that the binding distance is strongly underestimated in the non-magnetic state and thus puts a unrealistically large artificial strain on the FeSe in a calculation that uses bulk STO as a lattice constant. PBEsol seems to be predicting the layer internal structure best. While magnetism is important to describe the internal structure of the FeSe layer, the binding distance to STO is weakly affected by it. Here, however, we observe large differences in the functionals following their usual hierarchy from short to long bond lengths: LDA, PBEsol and PBE. Compared to recent experimental dataLi et al. (2015), and assuming the non-superconducting sample is in the 0% oxygen vacancy limit, the distances are all to short with the minimal error of 6.3% in PBE. Comparing the calculated step height from the FeSe covered to uncovered STO areas with the original experimental value of 5.5ÅWang et al. (2012), we find that PBEsol agrees best. As an interesting observation we find that the FeSe layer separation from STO in fact increases upon increasing the oxygen vacancy concentration. The effect is present in PBE as well as PBEsol even though the effect is weak in the latter case. Assuming that the annealing steps in Ref. Li et al., 2015 are mainly causing oxygen vacancies to form, this is in line with experiment where the separation increases significantly from to Å. We believe that this effect is caused by the tendency of O vacancies to reduce the strength of the covalent bond Se to Ti at low concentrations. In the calculations, PBE tends to soften the covalent bonds at a point where the charge transfer due to vacancies have has not created a compensating ionic bonding. Ordered vacancies in a super-cell calculation may locally distort the bonding structure much more than the same vacancy percentage in the disordered experimental system where we would expect a more isotropic influence on electronic properties. This may explain why a super cell calculation results in a strengthening of a covalent bond that is suppressed if the deficiencies is disordered. The homogeneous averaged potential, however, is better described within the VCA.
Note also, that the incommensurate alignment of STO with the FeSe, as seen in the data of Ref. Li et al., 2015, may weaken the covalent bonding of FeSe to STO and, thus, explain why PBE calculations of the bond length agree better with experiment in our commensurate approximation of the system.
We believe that more experimental data would be desirable to investigate the precise nature of the interface. For example, Ref. Li et al., 2015 concluded that the STO is terminated by a double layer of . Here, we found that a relaxation within DFT starting from the suggested positions leads to an incorrect description of the system where the double layer bind closely together leaving the FeSe monolayer almost unbound.
Ref. Zhou and Millis, 2016 suggested that the slight Nb doping of STO is important to understand the charge transfer and the electron phonon coupling. In a future calculation it would be interesting to investigate the effect of Nb impurities further. Especially in the low vacancy region, our calculation finds that the FeSe bands are almost unaffected. The presence of impurity states my well enhance the electron transfer to STO and thus affect, both the resulting binding distance as well as the charge transfer. On the other hand, Ref. Zhang et al., 2014 showed that SC is similarly found in a FeSe monolayer on insulating STO substrate, without Nb doping.
Furthermore it would be desirable to validate the findings of this work with alternative methods to investigate the effect of disordered oxygen vacancies such as the coherent potential approximation.
Acknowledgements.
We have enjoyed stimulating discussion with S. Johnston, P.J. Hirschfeld, Y. Wang, T. Berlijn, S. Maiti and D.B. Tanner. This work was supported by Grant No. DE- FG02-05ER46236.References
- Wang et al. (2012) Q.-Y. Wang, Z. Li, W.-H. Zhang, Z.-C. Zhang, J.-S. Zhang, W. Li, H. Ding, Y.-B. Ou, P. Deng, K. Chang, J. Wen, C.-L. Song, K. He, J.-F. Jia, S.-H. Ji, Y.-Y. Wang, L.-L. Wang, X. Chen, X.-C. Ma, and Q.-K. Xue, Chinese Physics Letters 29, 037402 (2012).
- Liu et al. (2012) D. Liu, W. Zhang, D. Mou, J. He, Y.-B. Ou, Q.-Y. Wang, Z. Li, L. Wang, L. Zhao, S. He, Y. Peng, X. Liu, C. C. Chen, L. Yu, G. Liu, X. Dong, J. Zhang, C. C. Chen, Z. Xu, J. Hu, X. Chen, X. Ma, Q. Xue, and X. Zhou, Nature Communications 3, 931 (2012), arXiv:1202.5849 .
- He et al. (2013) S. He, J. He, W. Zhang, L. Zhao, D. Liu, X. Liu, D. Mou, Y.-B. Ou, Q.-Y. Wang, Z. Li, L. Wang, Y. Peng, Y. Liu, C. C. Chen, L. Yu, G. Liu, X. Dong, J. Zhang, C. C. Chen, Z. Xu, X. Chen, X. Ma, Q. Xue, and X. J. Zhou, Nature Materials 12, 605 (2013).
- Fan et al. (2015) Q. Fan, W. H. Zhang, X. Liu, Y. J. Yan, M. Q. Ren, R. Peng, H. C. Xu, B. P. Xie, J. P. Hu, T. Zhang, and D. L. Feng, Nature Physics 11, 946 (2015), arXiv:1504.02185 .
- Zhang et al. (2015) Y. Zhang, J. J. Lee, R. G. Moore, W. Li, M. Yi, M. Hashimoto, D. H. Lu, T. P. Devereaux, D. H. Lee, and Z. X. Shen, , 15 (2015), arXiv:1512.06322 .
- Qian et al. (2011) T. Qian, X.-P. Wang, W.-C. Jin, P. Zhang, P. Richard, G. Xu, X. Dai, Z. Fang, J.-G. Guo, X.-L. Chen, and H. Ding, Physical review letters 106, 187001 (2011).
- Burrard-Lucas et al. (2013) M. Burrard-Lucas, D. G. Free, S. J. Sedlmaier, J. D. Wright, S. J. Cassidy, Y. Hara, A. J. Corkett, T. Lancaster, P. J. Baker, S. J. Blundell, and S. J. Clarke, Nature materials 12, 15 (2013).
- Miyata et al. (2015) Y. Miyata, K. Nakayama, K. Sugawara, T. Sato, and T. Takahashi, Nature Materials 14, 775 (2015).
- Linscheid et al. (2016) A. Linscheid, S. Maiti, Y. Wang, S. Johnston, and P. J. Hirschfeld, (2016), arXiv:1603.03739 .
- Mishra et al. (2016) V. Mishra, D. J. Scalapino, and T. A. Maier, , 4 (2016), arXiv:1603.03756 .
- Song et al. (2016) C.-L. Song, H.-M. Zhang, Y. Zhong, X.-P. Hu, S.-H. Ji, L. Wang, K. He, X.-C. Ma, and Q.-K. Xue, Physical Review Letters 116, 157001 (2016).
- Hanzawa et al. (2015) K. Hanzawa, H. Sato, H. Hiramatsu, T. Kamiya, and H. Hosono, (2015), arXiv:1508.07689 .
- Lei et al. (2015) B. Lei, J. H. Cui, Z. J. Xiang, C. Shang, N. Z. Wang, G. J. Ye, X. G. Luo, T. Wu, Z. Sun, and X. H. Chen, , 15 (2015), arXiv:1509.00620 .
- Wang et al. (2016a) Y. Wang, K. Nakatsukasa, L. Rademaker, T. Berlijn, and S. Johnston, Superconductor Science and Technology 29, 054009 (2016a).
- Shanavas and Singh (2015) K. V. Shanavas and D. J. Singh, Physical Review B 92, 035144 (2015).
- Chen et al. (2016) M. X. Chen, D. F. Agterberg, and M. Weinert, (2016), arXiv:1603.03841 .
- Lee et al. (2014) J. J. Lee, F. T. Schmitt, R. G. Moore, S. Johnston, Y.-T. Cui, W. Li, M. Yi, Z. K. Liu, M. Hashimoto, Y. Zhang, D. H. Lu, T. P. Devereaux, D.-H. Lee, and Z.-X. Shen, Nature 515, 245 (2014).
- Lee (2015) D.-H. Lee, Chinese Physics B 24, 117405 (2015), arXiv:1508.02461 .
- Chen et al. (2015) X. Chen, S. Maiti, A. Linscheid, and P. J. Hirschfeld, Physical Review B 92, 224514 (2015).
- Hohenberg and Kohn (1964) P. Hohenberg and W. Kohn, Phys. Rev. 136, B864 (1964).
- Kohn and Sham (1965) W. Kohn and L. J. Sham, Phys. Rev. 140, A1133 (1965).
- Singh and Du (2008) D. J. Singh and M.-H. Du, Physical Review Letters 100, 237003 (2008).
- Mazin et al. (2008a) I. I. Mazin, D. J. Singh, M. D. Johannes, and M. H. Du, Physical Review Letters 101, 057003 (2008a).
- Kimber et al. (2009) S. A. J. Kimber, A. Kreyssig, Y.-Z. Zhang, H. O. Jeschke, R. Valentí, F. Yokaichiya, E. Colombier, J. Yan, T. C. Hansen, T. Chatterji, R. J. McQueeney, P. C. Canfield, A. I. Goldman, and D. N. Argyriou, Nature Materials 8, 471 (2009).
- Hirschfeld et al. (2011) P. J. Hirschfeld, M. M. Korshunov, and I. I. Mazin, Reports on Progress in Physics 74, 124508 (2011).
- Mazin et al. (2008b) I. I. Mazin, M. D. Johannes, L. Boeri, K. Koepernik, and D. J. Singh, Physical Review B 78, 085104 (2008b).
- Kumar et al. (2012) J. Kumar, P. K. Ahluwalia, S. Auluck, and V. P. S. Awana (2012) pp. 893–894.
- Ricci and Profeta (2013) F. Ricci and G. Profeta, Physical Review B 87, 184105 (2013).
- Ortenzi et al. (2009) L. Ortenzi, E. Cappelluti, L. Benfatto, and L. Pietronero, Physical Review Letters 103, 046404 (2009).
- Bazhirov and Cohen (2013) T. Bazhirov and M. L. Cohen, Journal of Physics: Condensed Matter 25, 105506 (2013).
- Shen et al. (2012) J. Shen, H. Lee, R. Valentí, and H. O. Jeschke, Physical Review B 86, 195119 (2012).
- Wang et al. (2016b) Y. Wang, A. Linscheid, T. Berlijn, and S. Johnston, Physical Review B 93, 134513 (2016b), arXiv:1602.03288 .
- Coh et al. (2015) S. Coh, M. L. Cohen, and S. G. Louie, New Journal of Physics 17, 073027 (2015).
- Li et al. (2014) B. Li, Z. W. Xing, G. Q. Huang, and D. Y. Xing, Journal of Applied Physics 115, 193907 (2014).
- Coh et al. (2016) S. Coh, D.-H. Lee, S. G. Louie, and M. L. Cohen, (2016), arXiv:1603.03377 .
- Perdew et al. (1996) J. P. Perdew, K. Burke, and M. Ernzerhof, Physical Review Letters 77, 3865 (1996).
- Li et al. (2015) F. Li, Q. Zhang, C. Tang, C. Liu, J. Shi, C. Nie, G. Zhou, Z. Li, W. Zhang, C.-L. Song, K. He, S. Ji, S. Zhang, L. Gu, L. Wang, X.-C. Ma, and Q.-K. Xue, arXiv 3 (2015), arXiv:1512.05203 .
- Perdew et al. (2008) J. P. Perdew, A. Ruzsinszky, G. I. Csonka, O. A. Vydrov, G. E. Scuseria, L. A. Constantin, X. Zhou, and K. Burke, Physical Review Letters 100, 136406 (2008).
- Giannozzi et al. (2009) P. Giannozzi, S. Baroni, N. Bonini, M. Calandra, R. Car, C. Cavazzoni, D. Ceresoli, G. L. Chiarotti, M. Cococcioni, I. Dabo, A. Dal Corso, S. de Gironcoli, S. Fabris, G. Fratesi, R. Gebauer, U. Gerstmann, C. Gougoussis, A. Kokalj, M. Lazzeri, L. Martin-Samos, N. Marzari, F. Mauri, R. Mazzarello, S. Paolini, A. Pasquarello, L. Paulatto, C. Sbraccia, S. Scandolo, G. Sclauzero, A. P. Seitsonen, A. Smogunov, P. Umari, and R. M. Wentzcovitch, Journal of Physics: Condensed Matter 21, 395502 (19pp) (2009).
- Garrity et al. (2014) K. F. Garrity, J. W. Bennett, K. M. Rabe, and D. Vanderbilt, Computational Materials Science 81, 446 (2014).
- Monkhorst and Pack (1976) H. J. Monkhorst and J. D. Pack, Physical Review B 13, 5188 (1976).
- Methfessel and Paxton (1989) M. Methfessel and A. T. Paxton, Physical Review B 40, 3616 (1989).
- Zhou and Millis (2016) Y. Zhou and A. J. Millis, (2016), arXiv:1603.02728 .
- Cao et al. (2000) L. Cao, E. Sozontov, and J. Zegenhagen, physica status solidi (a) 181, 387 (2000).
- Louca et al. (2010) D. Louca, K. Horigane, A. Llobet, R. Arita, S. Ji, N. Katayama, S. Konbu, K. Nakamura, T.-Y. Koo, P. Tong, and K. Yamada, Physical Review B 81, 134524 (2010).
- Winiarski et al. (2012) M. J. Winiarski, M. Samsel-Czekała, and A. Ciechan, EPL (Europhysics Letters) 100, 47005 (2012).
- Richter et al. (2013) N. A. Richter, S. Sicolo, S. V. Levchenko, J. Sauer, and M. Scheffler, Physical Review Letters 111, 045502 (2013).
- Zhang et al. (2014) W. Zhang, Z. Li, F. Li, H. Zhang, J. Peng, C. Tang, Q. Wang, K. He, X. Chen, L. Wang, X. Ma, and Q.-K. Xue, Physical Review B 89, 060506 (2014).