Survey Observations of a Possible Glycine Precursor, Methanimine (CH2NH)
Abstract
We conducted survey observations of a glycine precursor, methanimine or methylenimine (CH2NH), with the NRO 45 m telescope and the SMT telescope towards 12 high-mass and two low-mass star-forming regions in order to increase number of CH2NH sources and to better understand the characteristics of CH2NH sources. As a result of our survey, CH2NH was detected in eight sources, including four new sources. The estimated fractional abundances were 10-8 in Orion KL and G10.47+0.03, while they were 10-9 towards the other sources. Our hydrogen recombination line and past studies suggest that CH2NH-rich sources have less evolved HII regions. The less destruction rates by UV flux from the central star would be contributed to the high CH2NH abundances towards CH2NH-rich sources. Our gas-grain chemical simulations suggest that CH2NH is mostly formed in the gas-phase by neutral-neutral reactions rather than the product of thermal evaporation from the dust surfaces.
1 Introduction
It is widely thought that prebiotic chemical evolution from small to large and complex molecules would have resulted in the origin of life. There are two conflicting views regarding how complex organic molecules (COMs) were formed on the early Earth: formation on planetary surface or exogenous delivery.
Miller (1953) conducted the very famous experiment - Miller-Urey’s experiment. He demonstrated that organic materials can be synthesized from “inorganic material”, which was against the “common sense” at that time. He synthesized several organic compounds such as the amino acids glycine or alanine, by discharging a gas mixture of H2O, NH3, CH4, and H2, which was thought as the atmospheric composition of the early Earth. However, recent studies have suggested that the amount of synthesized organic molecules would decrease dramatically under the currently suggested CO2 dominant atmosphere (Ehrenfreund et al., 2002).
In the interstellar medium (ISM), more than 190 molecules ranging from simple linear molecules to COMs were detected mainly towards dark clouds, low-mass and high-mass star-forming regions (CDMS: https://www.astro.uni-koeln.de/cdms/molecules). Ehrenfreund et al. (2002) argued that the exogenous delivery of COMs to the early Earth by comets and/or asteroids could be more than their terrestrial formation by three orders of magnitude; molecules delivered from the Universe might have played a crucial role in early Earth chemistry. If this is the case, understanding of the interstellar chemistry will enable us to better understand the first stage of chemical evolution regarding to the origin of life: from atoms to very simple prebiotic species.
Among prebiotic species, great attention has been paid to amino acids, essential building blocks of terrestrial life; many surveys were made unsuccessfully to search for the simplest amino acid, glycine (NH2CH2COOH), towards Sgr B2 and other high-mass star forming regions (e.g., Brown et al., 1979; Snyder et al., 1983; Combes et al., 1996, and References therein). Although Kuan et al. (2003) claimed the first detection of glycine in 2003, several follow-up observations denied the detection (e.g., Jones et al., 2007). The difficulty of the past glycine surveys would be due to potential weakness of glycine lines and the low sensitivities of telescopes used for the surveys. In these days, the Atacama Large Millimeter/submillimeter Array (ALMA) is expected to overcome such difficulties associated with glycine surveys. Garrod (2013) used his three phase chemical model that simulates fully coupled gas phase, grain surface and bulk ice chemistry and suggested the possibility in detecting glycine by using ALMA.
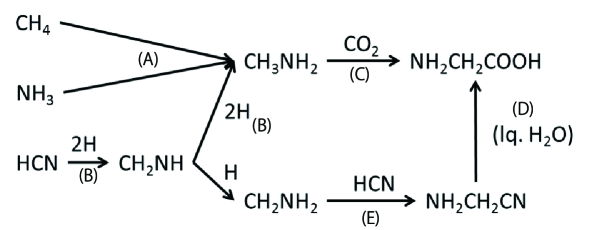
Formation processes of glycine have been studied by many researchers. Theoretical and laboratory studies have demonstrated that glycine is formed on icy grain surface from methylamine (CH3NH2) and CO2 under UV irradiation (Holtom et al., 2005). It is suggested that CH3NH2 can be formed from abundant species, CH4 and NH3, on icy dust surface (Kim & Kaiser, 2011). Alternatively methanimine (CH2NH) would be related to the formation of CH3NH2. Another possible route to form these species is hydrogenation to HCN on the dust surface, as investigated both in experimentally and theoretically (Woon, 2002; Theule et al., 2011). These issues also have been discussed in details by Majumdar et al. (2013) where they identified CH2NH2 as another possible precursor for glycine formation.
HCN CH2NH
CH2NH CH3NH2
Theule et al. (2011) mentioned that the hydrogenation process to CH2NH might be much quicker compared to that of HCN. It is also suggested that CH2NH may be formed in the gas phase reactions among radicals (Turner et al., 1999; Halfen et al., 2013). Halfen et al. (2013) showed that the excitation temperatures of CH2NH and CH3NH2 are different, suggesting different formation paths for CH2NH and CH3NH2. If this is the case, CH2NH might not be a direct precursor to CH3NH2.
CH2NH is related to another formation path to glycine; if H atom and HCN are added to CH2NH on the grain surface, aminoacetonitrile (NH2CH2CN) would be formed (Danger et al., 2011). NH2CH2CN yields glycine via hydrolysis (Peltzer et al., 1984). These formation processes are shown in Figure 1.
Such precursor candidate molecules were reported in the ISM. First detection of CH2NH was made towards Sgr B2 (Godfrey et al., 1973). CH2NH was confirmed towards Sgr B2 by many authors, and in particular, Halfen et al. (2013) reported 27 transitions of CH2NH towards Sgr B2. Dickens et al. (1997) reported new detections of CH2NH in three high-mass star forming regions, W51 e1/e2, Orion KL, and G34.3+0.15. Recently, Qin et al. (2010) reported the detection of CH2NH towards G19.61-0.23 through a line survey with the Sub-Millimeter Array. The past results of CH2NH surveys are summarized in Table 1. Further CH3NH2 was detected towards Sgr B2 (Kaifu et al., 1974) and Orion KL (Fourikis et al., 1974). Isokoski et al. (2013) conducted a line survey towards G31.41+0.3, and reported detection of CH3NH2. NH2CH2CN was detected towards Sgr B2 (Belloche et al., 2008).
Investigation of glycine formation processes described in Figure 1 would be an important step to know how “seed of life” is formed from ubiquitous species. One of the ways to discuss the formation processes would be to compare actual CH2NH abundances in various physical conditions with the chemical modelings. However, the small number of CH2NH sources makes it difficult to discuss the connections of different physical conditions and CH2NH chemistry. The survey observations of possible glycine precursors will help not only to discuss the physical condition where CH2NH is rich, but also to plan promising future glycine surveys with ALMA.
In this paper, we extended the CH2NH survey conducted by Dickens et al. (1997) towards high-mass and low-mass star forming regions, and report four new CH2NH sources. Our new detection of CH2NH sources enabled us to discuss the connection of CH2NH chemistry and their physical properties. The observational method will be described in section 2 (Observations); our results will be described in section 3 (Results); we will compare the evolutionary stages of the CH2NH sources in section 4 (Discussion). We will also discuss the formation path to CH2NH in the discussion section. We will summarize our work in section 5 (Conclusion).
2 Observations
2.1 Observation Procedure
We conducted survey observations of CH2NH with the 45 m radio telescope at the Nobeyama Radio Observatory (NRO), National Astronomical Observatory of Japan in April, May, and December, 2013, and the Sub-Millimeter Radio Telescope (SMT), Arizona Radio Observatory in October, 2013. The observed lines and their parameters are summarized in Table 2. Various species are simultaneously observed in our observations. The observations and analysis of other species will be presented and compared with the chemical modeling in a separate paper, to discuss chemistry to form glycine.
At NRO, we used the TZ receiver (Nakajima et al., 2013) in the dual polarization mode. The 404-313 transition at 105 GHz was observed. The SAM45 spectrometer was used for the backend with a frequency resolution of 122 kHz, corresponding to the velocity resolution of 0.35 km s-1 at 105 GHz. The system temperature ranged from 150 to 300 K. The main beam efficiency () was 0.31, and the beam size (FWHM) was 16”. Observations were performed in the position switching mode. The pointing accuracy was checked by observing nearby SiO masers, and the pointing error was typically 5”, but 10” under windy condition.
With the SMT telescope, the 111-000, 414-313, and 423-322 lines at 225, 245, and 255 GHz regions, respectively, were observed. Their parameters are summarized in Table 2. We used the 1 mm ALMA SBS SIS receiver in the dual polarization mode. The system temperature was between 250 and 400 K. The main beam efficiency was 0.74. The beam sizes (FWHM) were 35” and 40” depending on the observing frequencies. The position switching mode was employed. The pointing accuracy was checked using the Venus, and its accuracy was kept within 10”. We used the Forbes Filters as the spectrometer with a frequency resolution of 250 kHz, which is equivalent to the velocity resolution of 0.29 km s-1. Since the Forbes Filter has 512 channels, the observed frequency range covered 128 MHz wide at 225 GHz. For the transitions in 245 and 255 GHz, we split the Forbes filter into two 256 channel sets, and two lines were observed simultaneously.
2.2 Source Selection
Theule et al. (2011) suggested that CH2NH is formed via the hydrogenation process to HCN (HCN CH2NH). To select our target sources, we noted that CH3OH is well known to be formed via hydrogenation process to CO on the grain surface (CO H2CO CH3OH). If the formation process to CH2NH is similar to that of CH3OH, CH2NH would be potentially rich towards CH3OH-rich sources. Thus, our sources were selected from “The Revised Version of Class I Methanol Maser Catalog” (Val’tts et al., 2012), which is available on the Internet: (http://www.asc.rssi.ru/mmI/), and from CH3OH maser sources (Minier & Booth, 2002). We also took into account the results of survey observations of complex organic molecules towards hot core sources by Ikeda et al. (2001). Hot cores are high-mass star forming regions traced by the high temperature and dense molecular gas, which are sometimes associated with HII regions. Further, we also selected two famous low-mass star forming regions where complex molecules have been observed. These 14 sources for our survey are summarized in Table 3.
In this table, W3(H2O), Orion KL, NGC6334F, G10.47+0.03, G19.61-0.23, G31.41+0.3, W51 e1/e2, and DR21(OH) are molecule-rich sources (Ikeda et al., 2001). G75.78+0.34 and Cep A were selected from the CH3OH maser catalogs. The above sources are high-mass star-forming regions.
3 Results
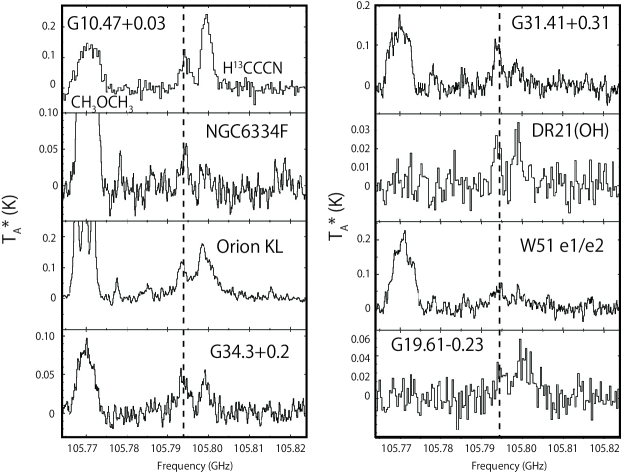
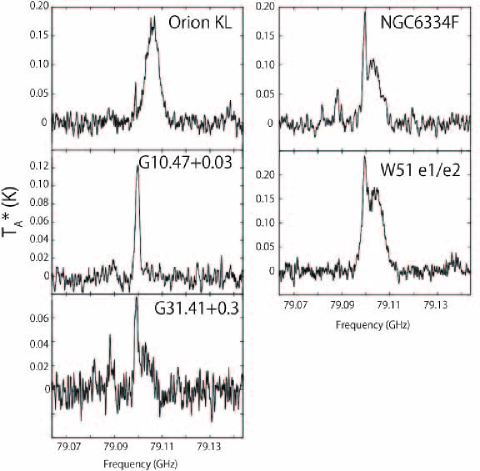
We detected CH2NH lines towards eight high mass star-forming regions as shown in Figure 2. Among them, Orion KL, W51 e1/e2, G34.3+0.15 and G19.61-0.23 are known CH2NH sources in the past surveys (Dickens et al., 1997; Qin et al., 2010). However, we report the detection of the 404-313 transition for the first time. Other sources, NGC6334F, G10.47+0.03, G31.41+0.3, and DR21(OH), are new CH2NH sources. The observing results are summarized in Table 4.
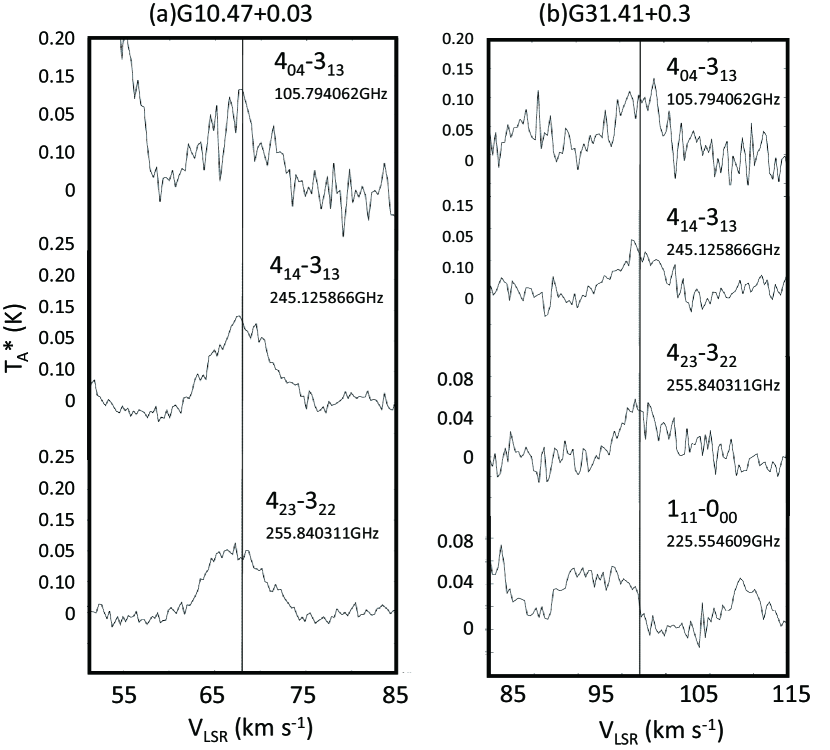
Figure 2 shows detected 404-313 line of CH2NH with the NRO 45 m telescope towards the eight high-mass star-forming regions. The dotted lines correspond to the rest frequency of the 404-313 transition (105.794062 GHz). Two other CH2NH lines (414-313 and 423-322) were detected with the SMT telescope towards G10.47+0.03 and G31.41+0.3. We note that the 404-313 line towards G10.47+0.03 and G31.41+0.3 show comparable intensities to that of Orion KL. Figure 3 shows the CH2NH lines observed towards G10.47+0.03 and G31.41+0.3 with the NRO 45 m telescope and the SMT telescope. In this figure, the vertical solid line corresponds to the systematic radial velocity of each source, shown in Table 3. The differences of radial velocities among the three observed transitions, -, -, and -, are within 0.25 km s-1. On the other hand, we did not detect the - transition towards G31.41+0.3.
In the other sources (Cep A, W3(H2O), W3(OH), G75.78+0.34, NGC2264 MM3 IRS1, NGC1333 IRAS4B, and IRAS16293-2422), no CH2NH transitions were detected. We briefly summarize their properties here. Cep A is a high mass star-forming region which harbors several radio continuum sources including several HII regions. These complex components are spatially unresolved in our beam. W3(H2O) is an H2O maser source with which HII regions are associated. G75.78+0.34 is known to contain at least two ultra compact (UC) HII regions ionized by B0-B0.5 ZAMS stars and possibly Hyper-Compact HII regions. NGC2264 MMS3 IRS1 is a dense core associated with a small star cluster, where HCOOCH3 emission was reported (Sakai et al., 2007). NGC1333 IRAS4B and IRAS16293-2422 are class 0 low-mass protostars where complex organic molecules have been reported. It is known that IRAS16293-2422 has three components named A1, A2, and B, which are unresolved in our beam. Outflow activities are confirmed in A2 and B (Loinard et al., 2013). Complex organic molecules such as methyl formate (HCOOCH3) and glycolaldehyde (CH2OHCHO) were detected towards IRAS16293-2422 (Jørgensen et al., 2012). NGC1333 IRAS4B is located 30” away from IRAS4A, enabling us to separate them with our beam. HCOOCH3 is detected towards NGC1333 IRAS4B (Sakai et al., 2006).
3.1 Derivation of Abundance
In this subsection we will describe the methodologies in deriving fractional abundances of CH2NH. In the following discussion, we will show that reliable CH2NH abundances can be obtained when we employ the same source size as that of continuum emission. If continuum data are not available, we assume a source size of 10” in the derivation. The estimated CH2NH abundances under compact source sizes, which will be described later in detail, and a source sizes of 10” are summarized in Tables 5 and 6, respectively.
In sources where more than two transitions are available, we calculated column densities of CH2NH using the rotation-diagram method described in Turner (1991), and the following equation was employed:
| (1) |
where is the integrated intensity, is the intrinsic line strength, is the permanent electric dipole moment, and are the nuclear spin degeneracy and the -level degeneracy, respectively, is the column density, is the rotational partition function, is the upper level energy, and is the rotation temperature. and are unity for CH2NH because CH2NH is an asymmetric top with no identical H atoms. The column density and the excitation temperature can be derived by utilizing the least-squares fitting. The column density is derived from the interception of a diagram, and its slope will give us the excitation temperature.
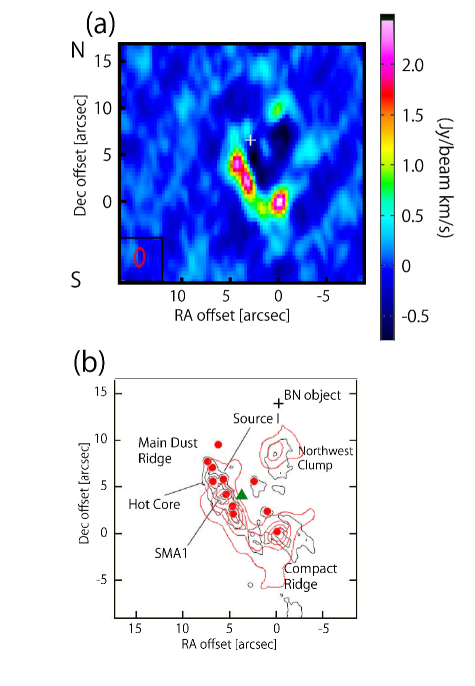
In the excitation analysis above, the beam coupling factors would be key parameters. We investigated the distribution of the CH2NH 111-000 transition at 225.55455 GHz towards Orion KL using the calibrated Science Verification data of ALMA cycle 0 (https://almascience.eso.org/almadata/sciver/OrionKLBand6/) to estimate CH2NH source sizes. The data were imaged with the Common Astronomy Software Applications (CASA) package. This data have the spectral resolution of 488 kHz and the synthesized beam size of 2”. We selected line-free channels for continuum subtraction in the (u, v) domain using the CASA task, uvcontsub. The channel maps of CH2NH 111-000 distribution were made by the CASA task, CLEAN. We employed the equal weighting of uv, and set the threshold value to stop CLEAN task at 72 mJy considering the r.m.s level. After that, we made the integrated intensity map from 225.55348 to 225.55641 GHz, corresponding to the VLSR range from 6.5 to 10.4 km s-1.
Our integrated intensity map of Orion KL is shown in Figure 4(a). The region corresponding to the beam of NRO 45 m telescope in our survey is shown by the black circle. We found that there are three strong CH2NH peaks in this region, which are unresolved with the synthesized beam of this data (2”). In Figure 4(b), CH2NH distributions are compared with the 0.8 mm dust continuum emission in Figure 4 of Hirota et al. (2015). We found that the peak positions of CH2NH are both in Orion Hot Core and Compact Ridge. There is also a weak peak of CH2NH in Northwest clump. Since the distribution of CH2NH and dust continuum emission look similar to each other, dust continuum emissions would be good indicators to estimate the source sizes of CH2NH. Thus, if dust continuum data were available, we employed the source size of dust continuum emission for CH2NH to calculate the beam coupling factors. In this case, column densities of molecular hydrogen were estimated from the dust continuum emission to calculate the fractional abundances of CH2NH (Table 5).
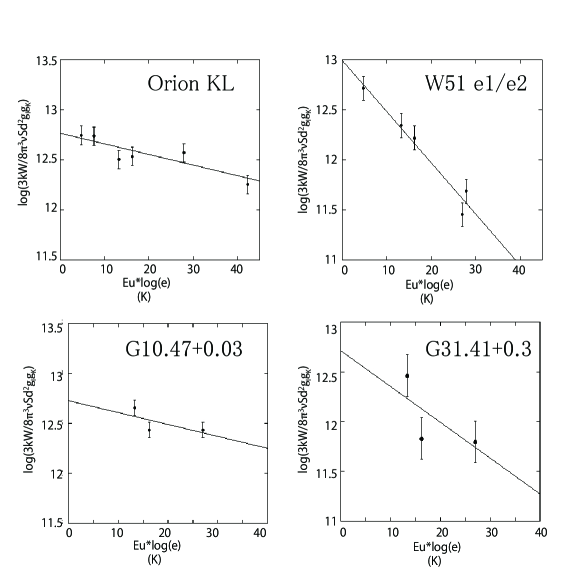
For G10.47+0.03 and G31.41+0.3, we made rotation diagrams to derive the column densities using the three transitions that we have observed. On the other hand, for Orion KL and W51 e1/e2, we made rotation diagrams by including other CH2NH transitions reported by Dickens et al. (1997). These results are shown in Figure 5. For these four CH2NH sources, we derived excitation temperatures ranging from 20 K to 90 K. Since only one transition was observed towards the other sources, we assumed that the excitation temperature is similar to that of HCOOH (40 K) reported by Ikeda et al. (2001) because the dipole moment of HCOOH is close to that of CH2NH. It would be important to know the error associated with the fractional abundances when the excitation temperature is fixed to be 40 K. Considering that the wide range of excitation temperatures were derived from the rotation diagram method, we assumed that the excitation temperatures can be changed within 20 K, which can change the column densities by 40. We note that the optical depths calculated with our method were less than 0.3 even for strong CH2NH transitions. The CH2NH column densities and the fractional abundances derived assuming the compact sources are summarized in Table 5.
For sources where dust continuum emission data are not available (G34.3+0.2, DR21(OH), W3(H2O), G75.78+0.34, Cep A, NGC2264 MMS3, NGC1333 IRAS4B, and IRAS16293-2422), we assumed, based on extended CO data, that CH2NH are spatially extended (source size of 10”) in calculating the fractional abundances. In this case, both CH2NH and molecular hydrogen may be underestimated due to beam dilution. It would be important to know how fractional abundances tend to be affected if we employ the source size of 10”. For this purpose, we calculated CH2NH fractional abundances towards Orion KL, G10.47+0.03, G31.41+0.3, NGC6334F, and W51 e1/e2 assuming source sizes of 10” in the upper side of Table 6, and the CH2NH fractional abundance ratio of compact source to 10” source were investigated. As a result, we found that the differences of the fractional abundances are within a factor of 3 (Table 6). Considering that the dependence on the source sizes is small, we employed a compact source size when dust continuum data are available (Table 5), and we used the source size of 10” to derive the CH2NH fractional abundances for the other sources (the lower side of Table 6).
3.2 CH2NH Abundances
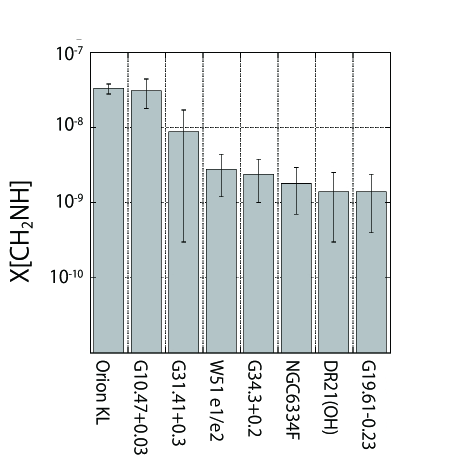
In Tables 5 and 6, we summarize the results of our analysis. Fractional abundances of CH2NH are compared in Figure 6. Our CH2NH fractional abundance is the highest in Orion KL. The column density of CH2NH towards Orion KL is 6.0 (1.8) 1014 cm-2 in Dickens et al. (1997) , and our value assuming a beam filling factor of unity is 1.2 (0.4) 1015 cm-2, which agrees within a factor of 2. In our calculation under compact source size, the column density and the corresponding fractional abundance are, respectively, 5.5 (0.8) 1015 cm-2 and 3.3 (0.5) 10-8.
G10.47+0.03 and G31.41+0.3 are CH2NH-rich sources next to Orion KL. In G10.47+0.03, the fractional abundance is 3.1 (1.1) 10-8. G31.41+0.3 has the fractional abundance of 8.8 (8.5) 10-9. The large error of the fractional abundance in G31.41+0.3 is due to scattering of the plots in its rotation diagram (Figure 5). Transitions in much higher energy levels will enable us to determine the column densities more accurately.
The fractional abundances of other sources are, 2.4 (1.6) 10-9, 2.8 (1.6) 10-9, 2.4 (1.7) 10-9, 1.4 (1.1) 10-10, and 1.4 (1.0) 10-9, in G34.3+0.2, W51 e1/e2, NGC6334F, DR21 (OH), and G19.61-0.23, respectively. If an extended source size was assumed, our column density towards W51 e1/e2, 6.6 (3.6) 1013 cm-2, is close to that reported by Dickens et al. (1997), 8 (0.4) 1013 cm-2. From these results, we found that CH2NH abundances range from 10-9 to 10-8.
CH2NH was not detected with sufficient S/N ratios towards other sources (W3(H2O), G75.78+0.34, Cep A, NGC2264 MMS3, NGC1333 IRAS4B, IRAS16293-2422). We derived upper limits to the column densities of CH2NH for these sources corresponding to the three sigma r.m.s noise levels and excitation temperatures of 40 K. We summarized these results in Table 6.
4 Discussion
4.1 Characteristics of CH2NH-rich Sources
As presented in Figure 6, the observed CH2NH abundances are different by a factor of about 20. What characteristics cause such a large difference among CH2NH abundances? In this section, we will discuss three hypotheses to explain the different CH2NH abundances in terms of distance, kinetic temperatures, and evolutionary phase of sources.
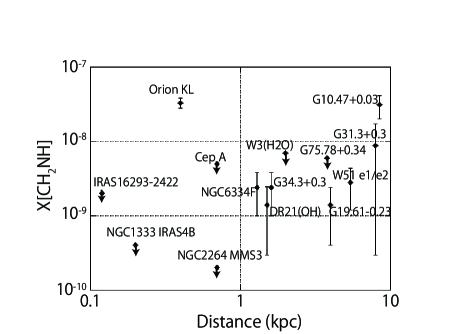
First of all, we will discuss the possibility that the differences of CH2NH abundances are simply originating from the different distances to the sources. Actually, the beam averaged CH2NH column densities would be high for closer sources since they are less affected by beam dilution. However, the differences depending on the source sizes were small when we compared their CH2NH fractional abundances. In Figure 7, we plotted the CH2NH fractional abundances against the distance to the sources. It would be difficult to find the correlation between CH2NH fractional abundances and the distances in Figure 7. The difference of CH2NH fractional abundances would be due to source properties rather than just an effect of beam dilution.
The second possibility is that the different temperatures of CH2NH sources might contribute to CH2NH abundances. Theule et al. (2011) demonstrated that CH2NH can be formed via the hydrogenation process to HCN on the dust surface (Figure 1). If CH2NH is produced on dust surface, gas phase CH2NH abundance would be lower until source temperature gets high enough to sublimate species from dust surface. Hernández-Hernández et al. (2014) reported rotation temperatures of CH3CN, which is often used as a tracer of the kinetic temperature, towards 17 sources including G10.47+0.03, NGC6334F, W51 e2, and W3(H2O). The rotation temperatures were 499 K for G10.47+0.03, 408 K for NGC6334F, 314 K for W51 e2, and 182 K for W3(H2O). It is notable that W3(H2O), where CH2NH was not detected, has a lower temperature than CH2NH sources. Thus, this scenario would be convincing when the desorption temperature of CH2NH is high (180 K). One easy way to roughly estimate desorption temperature would be to use the Clausius-Clapeyron equation (2) and the ideal gas law (3), described below:
| (2) |
| (3) |
where TB is the boiling point under the standard state, T is the sublimation temperature under the interstellar gas pressure P, and n is the number density of the species. We have to be cautious that the desorption temperature derived in this method is an approximated value, and it would have an uncertainty in two reasons. First, the Clausius-Clapeyron equation is applicable for the phase transition between pure solid or liquid and gas. However, the actual interstellar molecules would be far from pure material, which are physisorbed on H2O ice. In spite of the difference of the physical condition, the Clausius-Clapeyron equation succeeds to reproduce the commonly accepted sublimation temperature of H2O (from 90 to 100 K) and CO (from 15 to 18 K) in the ISM, assuming the density from 1105 to 1107 cm-3. Second, since the boiling point for CH2NH is not measured, we had to use theoretically predicted value of 215(15) K from a chemical database (http://www.chemspider.com/).
If we use the CH2NH fractional abundance of 3.110-8 (the value observed in G10.47+0.03) and the molecular hydrogen number density of 107 cm-3, the CH2NH number density n is 0.31 cm-3. In our calculation, we assume the initial T values of from 20 K to 200 K (=T0) and the P is obtained from the equation (2), then, next desorption temperature, T1 is obtained with the equation (3). In these iterations between equations (2) and (3), we are able to determine the final T value when the difference of successive temperatures reaches within 1 K. As a result, we found that the estimated desorption temperature of 40 K is quite low compared to the gas temperatures of star-forming regions.
We also calculated the desorption temperature in terms of the equilibrium of microscopic accretion and desorption process, which may better approximate the interstellar situation. The accretion rate Racc(i) (cm-3 ) and the desorption time scale tevap (s) for the species are described in Hasegawa et al. (1992) as shown below:
| (4) |
| (5) |
| (6) |
, v(i), ngas(i), ndust(i), nd, ED, ns, m, respectively, represent the cross section of the dust, averaged velocity of the gas species under a certain temperature, the gas and the dust surface phase number density of the species, the dust number density, the desorption energy, the surface density of the site (1.51015cm-2), and the mass of the molecule (4.83 10-23 g for CH2NH). Using the desorption time scale tevap, the desorption rate Rdes(i) (cm-3 ) is given by tndust(i). The desorption temperature is defined as the temperature which makes Rdes(i) and Racc(i) equal. Assuming the grain radius of 110-5 cm-1, the physical cross section of 3.1410-10 cm-2 is used for the . In Ruaud et al. (2015), the ED for CH2NH is assumed to be the same with CH3OH (5530 K). Although the mass of CH3OH and CH2NH are similar, this assumption may overestimate the desorption temperature for CH2NH, since OH group in CH3OH can strongly interact with H2O molecules in the interstellar ice. Thus, if we use the desorption temperature of CH3OH, we would be able to estimate the upper limit to the desorption temperature for CH2NH.
We used our simulation results by model A, described in the section 4.2, to estimate the number density of CH2NH (ngas and ndust) just before the warm-up of the core. Under the molecular hydrogen number density of 1107 cm-3, ngas (CH2NH) and ndust (CH2NH) are roughly 110-7 cm-3 and 110-4 cm-3. With this gas density, the dust number density nd can be estimated to be 1105 cm-3 assuming the gas-to-dust ratio of 0.01. Then, the upper limit to the desorption temperature can be calculated to be 160 K, which is comparable to the dust temperature in W3(H2O). Since CH2NH would be sufficiently desorbed even in W3(H2O), we can conclude that temperature differences among hot core sources could not explain our observational results.
The third hypothesis is that the different CH2NH abundances are related to the evolutionary phases of HII regions inside a hot core. In the ISM, it is well-known that star formation starts in a cold pre-stellar core. The gas temperature gradually rises when a protostar is formed inside the core, and finally frozen species on the dust are evaporated into the gas phase when the dust temperature gets high enough. As we have already mentioned, some of our sources are known to have high gas temperatures. Followed by that, CH2NH will be gradually photo-dissociated due to strong UV field in the vicinity of an evolved HII region inside the core. In this case, the CH2NH-rich sources can be explained as less evolved HII regions than the other sources, as is shown below.
The hydrogen recombination lines, which are originated from HII regions, would be good tools to study the evolutionary state of an HII region. We compared in Figure 8 the strength of a recombination line, H54, among five CH2NH sources. The observed line properties are summarized in Table 7. In G10.47+0.03 and G31.41+0.3, the observed H54 line is very weak or below 3 sigma level. For Orion KL, it is well known that recombination lines are originated from the foreground HII region; Plambeck et al. (2013) reported that recombination lines were not detected inside the Hot Core of Orion KL. Our results suggest that top three CH2NH-rich sources would possess less evolved HII regions, while the H54 line is prominent towards W51 e1/e2 and NGC6334F. These sources are considered to have more evolved HII regions, supporting our scenario. We also note that past observational results also agree with this scenario. Cesaroni et al. (2010) claimed that G10.47+0.03 contains two deeply embedded Hyper Compact HII regions in the positions of the hot core while no detectable HII region is present in G31.41+0.3. Although it is difficult to compare directly with our observations, Jiménez-Serra et al. (2011) detected H40, H34, and H31 towards Cep A. Cep A would possess an evolved HII region inside and the dissociation process might result in the non-detection of CH2NH. Considering above, the difference of the evolutionary phase would be the most plausible reason to explain the different CH2NH abundances.
4.2 Astrochemical Modeling
It is difficult to discuss actual formation processes of CH2NH only from our observations. In this section, we present the results of a gas-grain chemical model and discuss the chemistry of CH2NH.
4.2.1 The Nautilus Chemical Model
To simulate the abundance of CH2NH in hot cores, the NAUTILUS gas-grain chemical model (Semenov et al., 2010; Reboussin et al., 2014) has been used with the similar physical model used in Garrod (2013) where a collapse phase is followed by a static warm-up phase. This chemical model computes the time evolution of species in the gas-phase and at the surface of dust grains. The gas-phase chemistry is described by the public network kida.uva.2014 (Wakelam et al., 2015). During collisions with grains, species from the gas-phase can be physisorbed on the surfaces. They can then diffuse, react and be evaporated through thermal and non-thermal processes. All details about the model can be found in Ruaud et al. (2015). For our simulations, we have assumed that species are initially in the atomic form, except for H2, with abundances from Garrod (2013). The initial abundance is listed in Table 8.
4.2.2 The Physical Model
The physical conditions used as input to the chemical model are based on the ”fast warm-up model” from Garrod (2013). We have run four different models (A, B, C and D) with different peak density and/or temperature as listed in Table 9. The peak temperatures and densities were selected considering the recent observations towards hot cores (e.g., Hernández-Hernández et al., 2014). We will see how CH2NH formation processes depend on densities through the comparison of models A, B, and C, and on temperatures through the comparison of models A and D. The gas densities (n) were initially set to be 3103 cm-3, which gradually increased up to their peak densities along with the free-fall equation during collapsing phase. While gas temperatures were fixed at 10 K in the collapsing phase, dust temperatures decreased from 16 K to 8 K depending on the visual extinction, which were calculated from the gas density of the cloud. Once the peak densities were achieved, we fixed the densities, and the gas and dust temperatures were raised from 10 K to their peak temperatures in 7104 years.
4.2.3 Gas and Ice Phase Formation of CH2NH
As a result of our model, CH2NH is formed both in the gas phase and on the dust grain surface. We summarize the main chemical reactions to form CH2NH on the surfaces in Table 10. The dust surface reaction rates are proportional to both the probability of the reaction and the diffusion rates of reactant species (Hasegawa et al., 1992). is proportional to exp(-E), where EA represents the value of the activation barrier. The diffusion rates depend on the exponential of the dust temperature. For activation barriers of hydrogenation processes of HCN and CH2NH, the theoretically predicted values by Woon (2002) were employed.
The main reactions in the gas-phase to form CH2NH are summarized in Table 11. CH2NH is formed both by dissociative recombination processes and neutral-neutral reactions. The rate coefficients of gas phase reactions are given by the Arrhenius equation below, using the coefficients , , and :
| (7) |
where T represents the gas temperature. As shown in Table 11, the dissociative recombination processes have larger reaction rates.
4.2.4 Modeling Results and Discussions
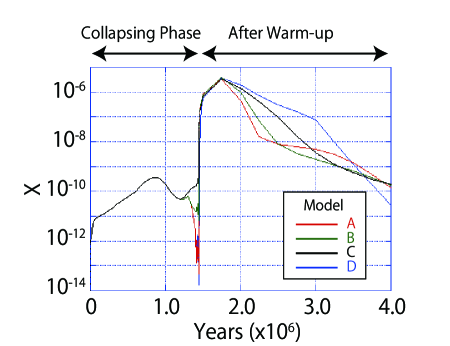
The simulated gas phase CH2NH abundances (relative to the total proton density; hereafter represented by a simbol X) for the four models A, B, C, and D are presented in Figure 9 with different colors. The origin in the X axis corresponds to the time of start the collapse of the gas. We found that the general behavior of X[CH2NH] along with the cloud evolution does not depend on the model. X[CH2NH] are almost the same in each model in the collapsing phase ( 1.4106 years). X[CH2NH] decreases just before the warm-up phase ( 1.4106 years), since gas phase species are accreted on the dust surface due to high gas density and low temperature environment. After the warm-up phase, X[CH2NH] increases dramatically. It would be important to discuss the detailed CH2NH formation process in this phase for understanding the dominant formation path. Following that, X[CH2NH] decreases via gas phase reactions with ions and/or radicals.
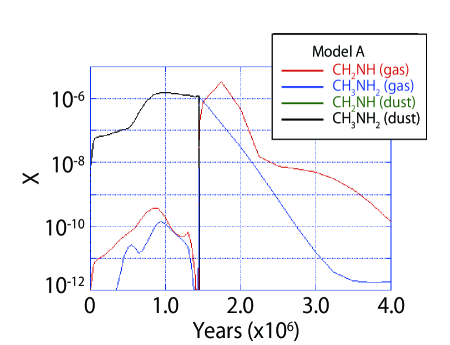
Which chemical precesses are the most dominant formation process for CH2NH? First of all, in Figure 10, we compared X[CH2NH] and X[CH3NH2] both in the gas phase and dust grain surface using model A. We can easily recognize that dust surface abundance before the warm-up phase (1.4106 years) and gas phase abundance of CH3NH2 after warm-up are almost the same. CH3NH2 would be mainly formed on the dust surface before the birth of a star, and evaporate to the gas phase. On the other hand, the dust surface X[CH2NH] is very low ( 10-12) compared to the gas phase X[CH2NH], since dust surface CH2NH is efficiently hydrogenated to CH3NH2 during the collapsing phase. We also confirmed the same trend in models B, C, and D. Thus, gas phase reactions would be dominant formation process to explain gas phase X[CH2NH] in the protostellar stage.
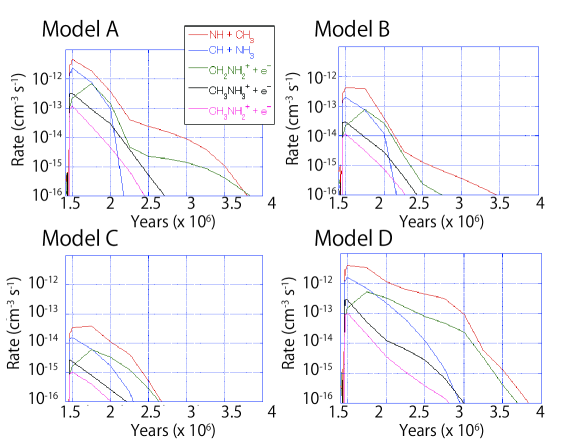
To discuss the most dominant gas phase reactions in Table 11, we compared their formation rates krate(T, t) (cm-3 s-1). Formation rates are presented by krate(T, t) = k(T) n1(t) n2(t), where k(T) is the temperature-dependent rate constant (cm3 s-1) calculated with the Arrhenius equation, and n1(t) and n2(t) are the number densities (cm-3) of reactant species in each time step. In Figures 11 (A)-(D), time dependent behaviors of krate(T, t) are shown for models A, B, C, and D, after the collapsing phase (t1.4106 years). In these figures, the formation rates of NH + CH3, CH + NH3, CH2NH + e-, CH3NH + e-, and CH3NH + e- are compared. As we can see through the comparison of models A and C, formation rates tend to be lower under low density environment, due to low number densities of reactant species. The difference between model A and model D is originated from the different rate coefficients determined by the gas temperatures. However, we confirmed that NH + CH3 reactions would be the most dominant formation process in all the models.
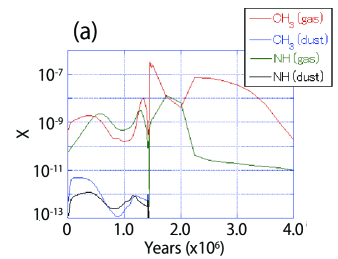
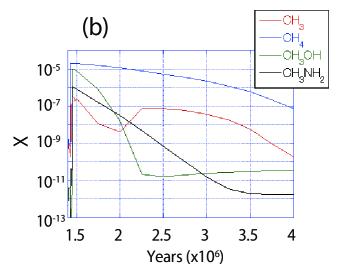
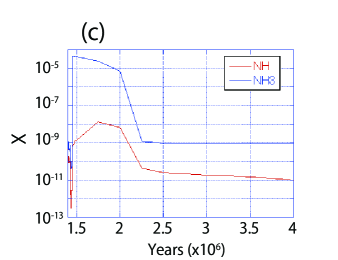
Finally, we will mention the origin of these radicals. The dust surface abundances of radicals are very low during the collapsing phase, since unstable species are quickly hydrogenated. In Figure 12 (A), we show the X[CH3] in the gas phase and on the dust surface with red and blue lines, and the X[NH] in the gas phase and on the dust surface with green and black lines. The dust surface X[CH3] and X[NH] are both nearly 10-12 before the warm-up phase (1.4106 years). Since X[CH3] and X[NH] in the gas phase are much higher than 10-12 after the warm-up phase, the gas phase reactions would be essential to explain the abundant X[CH3] and X[NH]. In the dataset of KIDA, radicals are formed via the destructions of complex species. We show the gas phase abundances of some species are related to the formations of CH3 and NH using model A, in Figures 12 (B) and (C). CH3 radical is originated from the destruction of larger saturated molecules like CH4, CH3OH, and CH3NH2 by atoms and/or secondary UV radiation (Figure 12 (B)). NH radical is formed via the destruction of NH3 (Figure 12 (C)).
We summarize the CH2NH formation process here. During the cold collapsing phase, saturated complex molecules like NH3, CH4, CH3OH, and CH3NH2 are formed on the dust surface. We note that dust surface CH2NH abundance is quite low in the collapsing phase. During the warm-up phase, these molecules are evaporated to the gas, and NH and CH3 radicals are produced through the gas phase reactions using these evaporated molecules. Finally, newly formed radicals form CH2NH.
5 Conclusion
The main results of this paper can be summarized as follows:
-
1.
We conducted the survey observations of CH2NH towards high-mass and low-mass star-forming regions; CH2NH were detected in eight high-mass star-forming regions. Among them, the first detections were made in four objects, G10.47+0.03, G31.41+0.3, DR21(OH), and NGC6334F. However, CH2NH was not detected towards low-mass star-forming regions.
-
2.
We calculated the column densities and fractional abundances or their upper limits in our sources. The fractional abundances range from 10-9 to 10-8. We also found that Orion KL and G10.47+0.03 have higher CH2NH abundances than other sources by almost one order of magnitude.
-
3.
CH2NH-rich sources, Orion KL and G10.47+0.03, have high temperature regions, while HII regions are less evolved than other sources. CH2NH would be much less likely photo dissociated by UV photons in such an environment.
-
4.
From the results of our chemical model, it appears that CH2NH in the hot sources seems to have been formed in the gas-phase rather than evaporated from the ices. First, saturated molecules are evaporated from the dust surface during the warm-up phase of the cloud. Second, such species are destructed in the gas phase to form radicals. Following that, the reaction between CH3 and NH radicals form CH2NH.
References
- Belloche et al. (2008) Belloche, A., Menten, K. M., & Comito, C., et al., A&A, 482 (2008)
- Brown et al. (1979) Brown, R. D., Godfrey, P, D., Storey J., W., V., —& Bassez Marie-Paule., MNRAS, 186, 5P (1979)
- Cauzax et al. (2003) Cazaux, S., Tielens, A. G. G. M., & Ceccarelli, C., et al., ApJ, 593, L51 (2003)
- Caselli et al. (1998) Caselli, P., Hasegawa, T. I., & Herbst, E., ApJ, 495, 3 (1998)
- Caswell et al. (1989) Caswell, J. L., Batchelor, R. A., Forster, J. R., & Wellington, K. J. Australian J., Phys., 42, 33 (1989)
- Ceccarelli et al. (2000) Ceccarelli, C., Castets, A., Caux, E., et al., A&A, 355, 1129 (2000)
- Cesaroni et al. (2010) Cesaroni R., Hofner P., Araya E., Kurtz S., A&A, 509, A50, (2010)
- Churchwell et al. (1990) Churchwell, E., Walmsley, C. M., & Cesaroni, R., A&AS, 83, 119 (1990)
- Combes et al. (1996) Combes, F., Nguyen-Q-Rieu, & Wlodarczak, G., A&A, 308, 618 (1996)
- Danger et al. (2011) Danger. G., Borget. F., Chomat. M,. et al., A&A 535, A47 (2011)
- Dickens et al. (1997) Dickens, J. E., Irvine,W. M., Devries, C. H., & Ohishi, M., ApJ, 479, 312 (1997)
- Ehrenfreund et al. (2002) Ehrenfreund, P., Irvine, W., Becker, L., et al., Rep. Prog. Phys. 65, 1427 (2002)
- Fourikis et al. (1974) Fourikis, N., Takagi, K., & Morimoto, M., ApJL, 191, L139 (1974)
- Garrod (2013) Garrod R. T., ApJ, 765, 60 (2013)
- Godfrey et al. (1973) Godfrey, P. D., Brown, R. D., Robinson, B. J., & Sinclair, M. W., Astrophys. Lett., 13, 119 (1973)
- Goldsmith et al. (1981) Goldsmith, P. F., Langer, W. D., Ellder, J., Irvine, W., & Kollberg, E., ApJ, 249, 52 (1981)
- Halfen et al. (2013) Halfen, D. T., Iyushin, V. V., & Ziurys, L. M., ApJ, 767, 66 (2013)
- Hasegawa et al. (1992) Hasegawa, T. I., Herbst, E., & Leung, C. M., ApJS, 82, 167 (1992)
- Hernández-Hernández et al. (2014) Hernández-Hernández, V., Zapata, L., Kurtz, S., & Garay, G., ApJ, 786, 38 (2014)
- Hirota et al. (2008) Hirota, T., Bushimata, T., Choi, Y. K., et al., PASJ, 60, 37 (2008)
- Hirota et al. (2015) Hirota, T., Kim, M. K., Kurono, Y., & Honma, M., ApJ, 801, 82 (2015)
- Holtom et al. (2005) Holtom, P. D., Bennett, C. J., Osamura, Y., Mason, N. J., & Kaiser, R. I., ApJ, 626, 940 (2005)
- Hofner & Churchwell (1996) Hofner, P., & Churchwell, E., A&AS, 120, 283 (1996)
- Isokoski et al. (2013) Isokoski, K.,Bottinelli, S., & van Dishoeck, E. F., A&A, 554, A 100 (2013)
- Ikeda et al. (2001) Ikeda, M., Ohishi, M., Nummelin, A., et al., ApJ, 560, 792 (2001)
- Jiménez-Serra et al. (2011) Jiménez-Serra, I., Martín-Pintado, J., Báez-Rubio, A., Patel, N., & Thum, C. 2011, ApJL, 732, L27
- Jones et al. (2007) Jones. F. A., Cunningham. M. R., Godfrey P. D., & Cragg D. M., MNRAS, 347, 579 (2007)
- Jørgensen et al. (2002) Jørgensen, J. K., Schöier, F. L., & van Dishoetahick, E. F., A&A, 389, 908 (2002)
- Jørgensen et al. (2012) Jørgensen, J. K., Favre, C., Bisschop, S, E., Bourke, T, L., van Dishoeck, E, F., & Schmalzl, M., ApJ, 757, L4 (2012).
- Kaifu et al. (1974) Kaifu, N., Morimoto, M., Nagane, K., et al., ApJL, 191, L135 (1974)
- Kaifu et al. (1975) Kaifu, N., Takagi, K., & Kojima, T., ApJL, 198, L85 (1975)
- Kim & Kaiser (2011) Kim, Y. S., & Kaiser, R. I., ApJ, 729, 68 (2011)
- Kuan et al. (2003) Kuan Y., Charnley S.B., Huang H., Tseng W, Kisiel Z., ApJ, 593, 848 (2003)
- Loinard et al. (2008) Loinard L., Torres R. M., Mioduszewski A. J., & Rodríguez L. F., ApJ, 675, L29 (2008)
- Loinard et al. (2013) Loinard, L., Zapata, L. A., Rodríguez, L. F., et al., MNRAS,430, L10 (2013)
- Majumdar et al. (2013) Majumdar, L., Das, A., Chakrabarti, S. K., & Chakrabarti, S. NewA, 20, 15 (2013)
- Menten et al. (2007) Menten, K. M., Reid, M. J., Forbrich, J., & Brunthaler, A., A&A, 474, 515 (2007)
- Miller (1953) Miller, S, L., Science, 117, 3046, 528 (1953)
- Minier & Booth (2002) Minier, V., & Booth, R. S., A&A, 387, 176 (2002)
- Mueller et al. (2002) Mueller K. E., Shirley Y. L., Evans N. J., II, & Jacobson H. R., ApJS, 143, 469 (2002)
- Nakajima et al. (2013) Nakajima, T., Kimura, K., Nishimura, A., et al., PASP, 125, 252 (2013)
- Pandian et al. (2008) Pandian J. D., Momjian E.,& Goldsmith P. F., A&A, 486, 191 (2008)
- Peltzer et al. (1984) Peltzer, E. T., Bada, J. L., Schlesinger, G., & Miller, S. L., Advances in Space Research, 4, 69 (1984)
- Peretto et al. (2006) Peretto, N., André, Ph., & Belloche, A., A&A, 445, 979 (2006)
- Plambeck et al. (2013) Plambeck, R. L., Bolatto, A. D., Carpenter, J. M., et al. ApJ, 765, 40 (2013)
- Qin et al. (2010) Qin S.-L., Wu Y. F., Huang M. H., Zhao G., Li D., & Wang J.-J., Chen S., ApJ, 711, 399, (2010)
- Reboussin et al. (2014) Reboussin L., Wakelam V., Guilloteau S., & Hersant F., MNRAS, 440, 3557 (2014)
- Reid et al. (2014) Reid M. J., Menten K. M., Brunthaler A., et al., ApJ, 783, 130 (2014)
- Ruaud et al. (2015) Ruaud M., Loison J. C., Hickson K. M., Gratier P., Hersant F., & Wakelam V., MNRAS, 447, 4 (2015)
- Rolffs et al. (2011) Rolffs, R., Schilke, P., Zhang, Q., & Zapata, L., A&A, 536, A33 (2011)
- Sakai et al. (2006) Sakai, N., Sakai, T., & Yamamoto, S., PASJ, 58, L15 (2006)
- Sakai et al. (2007) Sakai, N., Sakai. T., & Yamamoto. S., ApJ, 660, 363 (2007)
- Sanna et al. (2014) Sanna, A., Reid, M. J., Menten, K. M., et al., ApJ, 781, 108 (2014)
- Semenov et al. (2010) Semenov, D., Hersant, F., Wakelam, V., et al. A&A, 522, A42 (2010)
- Snyder et al. (1983) Snyder, L. E., Hollis, J.M., Suenram, R. D., et al., ApJ, 268, 123 (1983)
- Sung et al. (1997) Sung, H., Bessell, M. S., & Lee, S.-W., AJ, 114, 2644 (1997)
- Talbi et al. (1996) Talbi, D., Ellinger, Y., & Herbst, E., A&A, 314, 688 (1996)
- Theule et al. (2011) Theule, P., Borget, F., Mispelaer, F., et al., A&A, 534, A64 (2011)
- Turner (1991) Turner, B. E, ApJS, 76, 617. (1991)
- Turner et al. (1999) Turner, B. E., Terzieva, R., & Herbst, E., ApJ, 518, 699 (1999)
- van der Tak et al. (2013) van der Tak, F. F. S., Chavarria, L., Herpin, F., et al., A&A, 554, A83 (2013)
- Val’tts et al. (2012) Val’tts, I. E., Larionov, G. M., & Bayandina, O. S., arXiv:1005.3715 (2012)
- Wakelam et al. (2015) Wakelam V., Loison J.C., Herbst E., et al., ApJ, Supp. Series ,217, 20 (2015)
- Woon (2002) Woon, D. E., ApJL, 571, L177 (2002)
- Wu et al. (2009) Wu, Y., Qin, S.-L., Guan, X., et al., ApJL, 697, L116 (2009)
| Source | transitions | (MHz) | reference |
|---|---|---|---|
| Sagittarius B2∗ | (1) | ||
| Orion KL | 211-202 | 172267.113 | (2) |
| 110-111 | 225554.692 | (2) | |
| 414-313 | 245125.974 | (2) | |
| 716-707 | 250161.865 | (2) | |
| 606-515 | 251421.379 | (2) | |
| W51 e1/e2 | 111-000 | 225554.692 | (2) |
| 414-313 | 245125.974 | (2) | |
| 606-515 | 251421.379 | (2) | |
| 423-322 | 255840.431 | (2) | |
| G34.3+0.2 | 414-313 | 245125.974 | (2) |
| G19.61-0.23 | 313-202 | 340354.315 | (3) |
| Transition | (MHz) | Eu (K) | (D2) | Telescope |
|---|---|---|---|---|
| 404-313 | 105794.062 | 30.6 | 3.93 | NRO |
| 111-000 | 225554.609 | 10.8 | 2.34 | SMT |
| 414-313 | 245125.866 | 37.3 | 6.58 | SMT |
| 423-322 | 255840.311 | 62.2 | 5.27 | SMT |
| Source | (J2000) h m s | (J2000) ’ ” | VLSR (km s -1) | distance (kpc) | Masers | Mass High/Low | Detection | reference |
|---|---|---|---|---|---|---|---|---|
| W3(H2O) | 02 27 04.6 | +61 52 25 | -47 | 2.0 | M | H | no | 1, 6 |
| NGC1333 IRAS4B | 03 29 11.99 | +31 13 08.9 | 6.8 | 0.2 | L | no | 3, 7 | |
| Orion KL | 05 35 14.5 | -05 22 30.6 | 6 | 0.4 | M | H | confirm | 1, 8 |
| NGC2264 MMS3 | 06 41 12.3 | +09 29 11.9 | 8 | 0.7 | H | no | 4, 9 | |
| IRAS16293-2422 | 16 32 22.63 | -24 28 31.8 | 2.7 | 0.12 | L | no | 5, 10 | |
| NGC6334F | 17 26 42.8 | -36 09 17.0 | -7 | 1.3 | M | H | new | 1, 6 |
| G10.47+0.03 | 18 08 38.13 | -19 51 49.4 | 68 | 8.5 | M | H | new | 1, 6 |
| G19.61-0.23 | 18 27 38.0 | -11 56 42 | 41.9 | 4.0 | M | H | confirm | 1, 11 |
| G31.41+0.3 | 18 47 34.6 | -01 12 43 | 97 | 7.9 | M | H | new | 1, 12 |
| G34.3+0.2 | 18 53 18.54 | +01 14 57.0 | 58 | 1.6 | M | H | confirm | 1, 6 |
| W51 e1/e2 | 19 23 43.77 | +14 30 25.9 | 58 | 5.4 | M | H | confirm | 1, 6 |
| G75.78+0.34 | 20 21 44.1 | +37 26 40 | -0.1 | 3.8 | M | H | no | 2, 6 |
| DR21 (OH) | 20 39 01.1 | +42 22 50.2 | -3 | 1.5 | M | H | new | 1, 6 |
| Cep A | 22 56 17.9 | +62 01 49 | -10.5 | 0.7 | M | H | no | 2, 6 |
Note. — “M” represents CH3OH maser sources reported in Minier & Booth (2002). “H” and “L” respectively shows high-mass and low-mass star-forming regions. In the column of detection, “no”,“confirm”, and “new”, respectively, represent non-detection sources, confirmations of the past CH2NH surveys, and new CH2NH detections. References. (1) Ikeda et al. (2001) (2) Minier & Booth (2002) (3) Sakai et al. (2006) (4) Sakai et al. (2007) (5)Cauzax et al. (2003) (6)Reid et al. (2014) (7)Hirota et al. (2008) (8)Menten et al. (2007) (9) Sung et al. (1997) (10)Loinard et al. (2008) (11)Hofner & Churchwell (1996) (12)Churchwell et al. (1990)
| Source | Obs. freq (GHz) | TA* (mK) | (km s -1) | VLSR (km s -1) | rms (mK) |
|---|---|---|---|---|---|
| DR21(OH) | 105.79383 | 24 | 5.4 | -2.4 | 7 |
| G10.47+0.03 | 105.79429 | 99 | 7.7 | 67.4 | 11 |
| G31.41+0.3 | 105.79404 | 98 | 2.4 | 97.1 | 24 |
| G34.3+0.2 | 105.79384 | 42 | 9.7 | 58.6 | 14 |
| NGC6334F | 105.79420 | 47 | 1.8 | -7.4 | 19 |
| Orion KL | 105.79352 | 108 | 9.3 | 7.5 | 13 |
| W51 e1/e2 | 105.79406 | 54 | 11.6 | 57.0 | 15 |
| G19.61-0.23 | 105.79497 | 31 | 8.5 | 39.3 | 12 |
| Source | Size (components) | N[H2] (1024cm-2) | Tex (K) | N[CH2NH] (1016 cm-2) | X[CH2NH] (10-8) |
|---|---|---|---|---|---|
| Orion KL | 2” (3) | 1.4a | 88 (23) | 4.6(0.7) | 3.3(0.5) |
| G10.47+0.03 | 1.4” | 6.7b | 84 (57) | 21(7.3) | 3.1(1.1) |
| G31.41+0.3 | 1.7” | 3.5b | 28 (17) | 3.1(3.0) | 0.88(0.85) |
| W51 e1/e2 | 1.2” (2) | 4.0b | 20 (2) | 1.1(0.63) | 0.28(0.16) |
| NGC6334F | 3.7” | 1.4b | [40] | 0.3(0.2) | 0.24(0.14) |
| G19.61-0.23 | 2.5” | 6.7c | [40] | 0.94(0.65) | 0.14(0.10) |
Note. —
CH2NH column densities “N”, or its upper limits and fractional abundances “X” are shown.
The distributions of CH2NH were assumed to be equal to dust continuum.
Since it is known that Orion KL has three CH2NH peaks and W51 e1/e2 has two continuum components, beam coupling factors were modified for these sources.
Excitation temperatures are fixed at 40 K shown with square brackets if only one transition was available, and the uncertainty associated in this assumption is assumed to be 50 percent of its central value considering wide range of excitation temperatures derived with rotation diagram method.
References. (a)Hirota et al. (2015) (b) Hernández-Hernández et al. (2014) (c) Wu et al. (2009)
| Source | N[H2] (1023cm-2) | Tex (K) | N[CH2NH] (1015 cm-2) | X[CH2NH] (10-8) | Xcompact/X10sec |
|---|---|---|---|---|---|
| Orion KL | 1.0a | 88 (23) | 5.5(0.8) | 5.5(0.8) | 0.6 |
| G10.47+0.03 | 1.3a | 84 (57) | 4.7(1.6) | 3.6(1.3) | 0.9 |
| G31.41+0.3 | 1.6a | 28 (17) | 0.85(0.82) | 0.53(0.51) | 1.7 |
| NGC6334F | 2.0a | [40] | 0.3(0.2) | 0.16(0.12) | 1.1 |
| W51 e1/e2 | 3.6a | 20 (2) | 0.32(0.09) | 0.09(0.03) | 3.1 |
| G34.3+0.2 | 3.0a | [40] | 0.7(0.4) | 0.24(0.14) | |
| DR21(OH) | 2.0a | [40] | 0.27(0.21) | 0.14(0.11) | |
| W3(H2O) | 1.0a | [40] | 0.7 | 0.7 | |
| G75.78+0.34 | 1.0e | [40] | 0.6 | 0.6 | |
| CepA | 1.0e | [40] | 0.5 | 0.5 | |
| NGC2264 MMS3 | 5.7b | [40] | 0.1 | 0.02 | |
| NGC1333 IRAS4B | 3.0c | [40] | 0.1 | 0.04 | |
| IRAS16293-2422 | 0.8d | [40] | 0.1 | 0.2 |
Note. —
For the sources where dust continuum data are not available, a source size of 10” was assumed to derive the fractional abundances from the spatially extended CO observations.
Although we have already obtained more reliable fractional abundance towards Orion KL, G10.47+0.03, G31.41+0.3, NGC6334F, and W51 e1/e2 in Table 5, we also calculated them assuming 10” sources to know how fractional abundance can change depending on the source sizes.
As the results, the differences of the fractional abundances in two different source sizes were within a factor of 3.
The upper limits of CH2NH are shown for non-detection sources.
References. (a)Ikeda et al. (2001) (b) Peretto et al. (2006) (c) Jørgensen et al. (2002) (d) Ceccarelli et al. (2000) (e)Assumed value
| Source | Tb (mK) | (kms-1) | W (mKkms-1) | X[CH2NH] 10-8 |
|---|---|---|---|---|
| Orion KL | Not detected∗ | 3.3(0.5) | ||
| G10.47+0.3 | 24 | [30] | 72 | 3.1(1.1) |
| G31.41+0.03 | 131 | 23.6 | 1018 | 0.89(0.85) |
| NGC6334F | 383 | 29.7 | 3762 | 0.24(0.17) |
| W51 e1/e2 | 531 | 30.3 | 5306 | 0.28(0.16) |
Note. — Observed recombination line parameters, brightness temperatures Tb (mK), line width (kms-1), and integrated intensities W (mKkms-1) are shown. The upper limit was calculated for G10.47+0.03, with 3 noise level and line width of 30 kms-1. We also showed the fractional abundances of CH2NH from Table 5. ∗Reference: Plambeck et al. (2013).
| Element | Abundance | Element | Abundance |
|---|---|---|---|
| H2 | 0.499 | Na | 2.0(-8) |
| H | 2.0(-3) | Mg | 7.00(-9) |
| He | 9.00(-2) | Si | 8.0(-9) |
| C | 1.40(-4) | P | 3.0(-9) |
| N | 7.50(-5) | Cl | 4.00(-9) |
| O | 3.2(-4) | Fe | 3.0(-9) |
| S | 8.0(-8) |
Note. — Elemental abundance used in our chemical reaction model. This table is referred from Garrod (2013).
| Model | Peak Density (cm-3) | Peak Temperature (K) |
|---|---|---|
| A | 1107 | 400 |
| B | 1106 | 400 |
| C | 1105 | 400 |
| D | 1107 | 200 |
| Reaction | EA (K) |
|---|---|
| N + CH3 CH2NH | EA= 0 K |
| NH + CH2 CH2NH | EA= 0 K |
| NH2 + CH CH2NH | EA= 0 K |
| HCN + H H2CN | EA= 3647 K |
| HCN + H HCNH | EA= 6440 K |
| H2CN + H CH2NH | EA= 0 K |
| HCNH + H CH2NH | EA= 0 K |
| CH2NH + H CH3NH | EA= 2134 K |
| CH2NH + H CH2NH2 | EA= 3170 K |
| CH3NH + H CH3NH2 | EA= 0 K |
| CH2NH2 + H CH3NH2 | EA= 0 K |
Note. — The dust surface reactions related to CH2NH are shown. EA represents the value of the activation barrier. Since radical species are so reactive, radical-radical reactions would have no activation barriers. The activation barriers for HCN and CH2NH were cited from the theoretical study by Woon (2002).
| Reaction | |||
|---|---|---|---|
| NH + CH3 CH2NH + H | 1.310-10 | 1.710-1 | 0 |
| CH + NH3 CH2NH + H | 1.5210-10 | -510-2 | 0 |
| CH2NH + e- CH2NH + H | 1.510-7 | -510-1 | 0 |
| CH3NH + e- CH2NH + H2 + H | 1.510-7 | -510-1 | 0 |
| CH3NH + e- CH2NH + H2 | 1.510-7 | -510-1 | 0 |
Note. — , , and represent the coefficients for the Arrhenius equation.